Business games: evaluating the financial performance of companies using AHP
Jogos empresariais: avaliando o desempenho financeiro das empresas utilizando o AHP
Business games: evaluating the financial performance of companies using AHP
Research, Society and Development, vol. 5, no. 4, pp. 290-313, 2017
Universidade Federal de Itajubá

This work is licensed under Creative Commons Attribution 4.0 International.
Received: 01 June 2017
Accepted: 31 July 2017
Abstract: The business environment is permeated by uncertainty and volatility, making the activities related to the ever-challenging decision making for administrators. In the current context, it is fundamental premise for continuous evaluation of the assets applied in the organizations, be they of any segment or size. This article aims to evaluate the financial performance of companies in a simulated environment in business games by Analytic Hierarchy Process (AHP) using as a base the analysis of current liquidity ratios, profitability and apital structure, demonstrating, through these indices, the industry involved in the game that obtained the best performance.
Keywords: Business games, hierarchical analysis, financial indicators.
Resumo: O ambiente de negócios é permeado por incerteza e volatilidade, tornando as atividades relativas à tomada de decisão sempre desafiadora para os administradores. No atual contexto é premissa fundamental a avaliação contínua dos ativos aplicados nas organizações, sejam elas de qualquer segmento ou porte. Este artigo tem por objetivo avaliar o desempenho econômico-financeiro de empresas em um ambiente simulado, em uma dinâmica de jogos empresariais por meio do Processo Analítico Hierárquico (AHP) utilizando como base a analise dos índices de liquidez, rentabilidade e estrutura de capital, demonstrando, por meio destes índices, a indústria envolvida no jogo que obteve o melhor desempenho.
Palavras-chave: Jogos empresariais, análise hierárquica, indicadores financeiros.
1. Introdução
To attract investment in a globalized market, companies must create value for investors (Assaf Neto, 2012). This amount is provided by remuneration of the invested capital, offering a return to the risk assumed, so there is a continuous need to assess the risks incurred in investments in companies by evaluating the performance of these companies through employment given the resources obtained by them.
The evaluation of companies is an issue that has recurred in the Business Administration, especially in studies in Finance (Martins, 2001; Copeland et al., 2002; Martelanc et al., 2005; Damodaran, 2007; Assaf Neto, 2012). This is due to the wide range of purposes for which it can be used, such as business buy and sell, mergers, acquisitions, dissolution of companies, liquidation of ventures and privatizations, and the potential to serve as a basis for ability of managers to generate wealth for shareholders (Martins, 2001).
According to Martins (2001), the business assessment to be carried out from two perspectives: the discontinuity or continuity of operation. The first form defines the equity value of the company, through unadjusted accounting operations. The second form defines the economic value of the company, considering the future potential of wealth generation, carried out through variables and result projections that influence the result of the evaluation.
According to the economic perspective, Martelanc et al. (2005) consider that the valuation of a company aims to achieve its fair value, a value that represents in a balanced way the economic potential of the company, which allows to identify, classify and measure investment opportunities in companies. Thus, the determination of the value of this company is related to its ability to generate future benefits.
For Helfert (2000), the performance of a company portrays the financial and economic consequences of past management decisions, represented by the operational and investment actions carried out over time. Thus, it is possible to observe through the financial measures the quality with which the assets were used, if the financing was adequate, and the level of attendance to the profitability desired by the shareholders. In this sense, for Copeland et al. (2002), the evaluation of companies is a tool that must be transformed into a management tool and implemented through any organization to create value for shareholders.
However, it is not possible to accept that the valuation of companies is done by means of a single methodology, since different or complementary tools can be chosen according to the characteristics of the company to be evaluated (Damondaran, 2007; Assaf Neto, 2012). In addition, Copeland et al. (2002) report that, for an adequate evaluation process, a methodology is not enough, and it is more important to make consistent projections by means of the verified knowledge of the business of the evaluated company, industry and the economic environment in which it is inserted.
Regarding the assertiveness of projections, Assaf Neto (2012) reports that the definition of the value of a company is a complex task, requiring conceptual coherence and accuracy in the formulation of the calculation model. According to Martins (2001), several models of evaluation have different assumptions and levels of subjectivity, since an enterprise may have different perceptions depending on the evaluator.
Therefore, the objective of this article is through financial indicators, assess the financial performance of companies in a simulated environment in a dynamic business games by Analytic Hierarchy Process (AHP) using as a basis the Analysis of the liquidity, profitability and capital structure indices, showing, through these indices, the industry involved in the game that obtained the best performance.
2. Theoretical foundation
2.1. Financial indicators
Financial indicators are widely used to assess the strength, stability and performance of the various sectors of the economy (Antunes & Martins, 2007). Its usefulness lies in its ability to provide information on the relationships between economic and financial statistics, such as: debt amount, performance of assets and liabilities, performance of shareholders' equity, and the performance of the gross sales generated, improving the analytical content of information. For example, a debt analysis of a company by itself does not provide the maximum vision as does the analysis of the cost of debt service in relation to income or the level of indebtedness in relation to income or equity (Junior & Begalli, 2009). Gitman (2010) states that the use of financial indicators also facilitates international comparisons. A comparison of the debt to gross domestic product (GDP) ratios in all countries is analytically more informative than comparing debt levels since it provides a common relative basis for comparability.
According to Matarazzo (2010), financial indicators are important instruments to evaluate the economic-financial performance of a company or organization. Most of these indices can be calculated from information provided by the financial statements. These indicators can be used to analyze trends and compare the company's finances with those of other companies. With the financial analysis, it is possible to predict in the future the insolvency or bankruptcy of a company.
Matarazzo (2010) classifies the financial indicators according to the information it provides. The following frequently used types of indicators are:
-
Current liquidity indicator;
-
Indicators of profitability;
-
Indicators of capital structure.
2.2. Current liquidity indicator
For Gitman (2010) and Iudícibus (2009) the currentliquidity indicator provides information on the company's ability to meet its short-term financial obligations. This indicator is especially interesting for companies that need to obtain short-term credit.
The rationale for calculating this indicator is the ratio of current assets to current liabilities as presented in Equation 1.
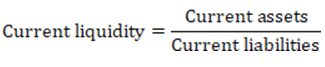 (1)
(1)Assaf Neto (2012) adds that short-term creditors prefer a high current liquidity index, as this indicates the reduction of credit risk. However, Gitman (2010) states that shareholders may prefer a low current liquidity index indicating that the company's assets are working to grow the business. The typical values for the current liquidity index vary according to the company and the business segment. For example, firms in cyclical industries may maintain a higher current liquidity ratio to remain solvent during the recession.
2.3. Profitability indicators
Profitability indicators indicate how efficiently the firm uses its assets (Gitman 2010). Assaf Neto (2012) clarifies that these indicators, in some cases, are referred to as efficiency indices regarding the use of assets or equity. Matarazzo (2010) states that four profitability indicators are commonly used:
-
Asset turnover;
-
Net margin;
-
Return on assets (ROA);
-
Return on equity (ROE).
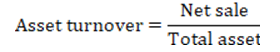
Asset turnover: According to Reis (2009) it is the ratio of the value of net income obtained by a company in relation to the value of its total assets sales. The proportion of total business assets can often be used as an indicator of the company's efficiency in applying its assets to revenue generation.
Matarazzo (2010) states that, in general, the higher the asset turnover rate, the greater the company's efficiency, the increase of this index implies that the company is generating more revenue per monetary unit of assets. However, Gitman (2010) states that this proportion may vary from one company to another, especially when they operate in different segments. As such, it is considered significant the comparative evaluation of the rates of turnover of assets only of companies of the same segment.
Asset turnover, as described by Assef Neto (2010) and illustrated in Equation 2, is typically calculated on an annual basis using the fiscal year. The number of total assets used in the denominator can be calculated based on the average assets obtained by a company at the end of the year.
 (2)
(2)Net margin: according to Assef Neto (2010) it is a key financial indicator used to evaluate the profitability of a company. It is the ratio between the net income of the revenues generated by a company or a business segment, usually expressed as a percentage, which demonstrates how much of each monetary unit earned by the company translates into profits. Junior & Begalli (2009) emphasize that lower profit margin indicates a lower margin of safety or a greater pre-disposition to the risk that, should a decline occur in sales, it will erase profits and result in a net loss. The net margin in percent is obtained as shown in Equation 3.
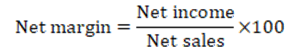 (3)
(3)Gitman (2010) adds that net margins can vary from company to company, and certain ranges can be expected from industry to industry, since there are similar business constraints in each distinct industry.
Gitman (2010) also adds that companies that are able to expand their net margins over time are generally rewarded with the growth in the price of their stock as it leads directly to higher levels of profitability.
Return on assets: according to Matarazzo (2010) this index indicates how profitable a company is relative to its total assets. Return on Assets (ROA) illustrates how well management is employing the company's total assets to achieve profitability. The higher the return, the more efficient management is the management of the use of its asset base. The ROA indicator is calculated based on the ratio of net profit to total average assets, and is expressed as a percentage as shown in Equation 4.
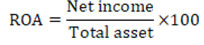 (4)
(4)According to Gitman (2010), the need for investment in current and non-current assets varies widely between companies. According to Assaf Neto (2012), in the case of capital intensive companies, which has a large fixed asset base, will calculate its ROA based on a large number in the denominator of this indicator. On the other hand, non-capital intensive companies with a small investment in fixed assets will generally be favored with a relatively high ROA because of a low denominator number.
It is precisely because companies need asset bases of different sizes that investors need to think about as they use the ROA indicator. Hoji (2010) emphasizes that, for the most part, the ROA measurement should be used historically for the company to be analyzed. If comparisons between peer companies are made, it is imperative that the companies being analyzed act on similar types of business. Simply being categorized in the same industry will not automatically make a company comparable.
Return on equity: indicates how profitable a company is comparing its net income to average shareholders' equity, as described by Matarazzo (2010). The rate of return on equity (ROE) measures how much shareholders have earned for your investment in the company. The higher the percentage ratio, the more efficient the management is in using its capital base and getting better returns for investors. Gitman (2010) states that the ROE indicator is calculated based on the ratio of net income to average shareholders' equity, and is expressed as a percentage as shown in Equation 5.
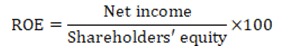 (5)
(5)Widely used by investors, according to Assaf Neto (2010), the ROE index is an important measure of the evolution of a company's results. The ROE tells ordinary shareholders how their money is actually being used. However, it should be recognized that there are variations in this indicator between some types of companies.
However, Gitman (2010) adds that, while considered as an indicator of profitability, ROE has a recognized weakness. Investors need to be aware that a disproportionate amount of debt in a company's capital structure would translate into a smaller capital base. Thus, a small amount of net income, in which this indicator counts as a numerator, could still produce a high ROE outside a modest capital base that is the denominator of this index.
2.3.1 Capital structure indicators
Iudícibus (2009) states that for equity investors favoring well-founded companies, a strong balance sheet is an important consideration for investing in a company's stock. In which a company describes its permanent or long-term capital composition, consisting of a combination of debt and capital. The proportional use of debt and equity to support its assets is a key indicator of a firm's balance sheet soundness. Assaf Neto (2012) adds that a healthy capital structure that reflects a low level of debt and a corresponding high level of capital is a very positive signal about financial capacity.
Matarazzo (2010) emphasizes that the strength of a company's balance sheet can be evaluated by four broad categories of investment quality measures:
-
Third-party capital participation;
-
Composition of debt;
-
Immobilization of shareholders' equity;
-
Immobilization of non-current resources.
Third-party capital participation: indicates how much is the company's dependence on the resources employed by third parties, such as banks and loans from financial institutions (Matarazzo, 2010). According to Assaf Neto (2012), this index provides an indication of the company's solvency, mainly in the long term, representing the relationship of financial leverage, through resources obtained through short and long-term loans, to the company's equity.
The participation rate of third-party capital is obtained as shown in Equation 6.
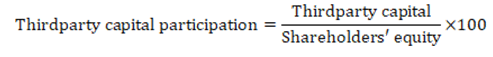 (6)
(6)Composition of debt: according to Assaf Neto (2012) this ratio compares the total current liabilities of a company with total assets employed by third parties in auscultated company, which is used to get a general idea about the amount of leverage being used by a company. The low percentage means that the company is less dependent on leverage. Assaf Neto (2012) states that the lower the percentage, the less financial leverage the company uses to strengthen its equity position. In general, the higher the proportion, the greater the credit risk assumed by the company.
The debt composition index is obtained as shown in Equation 7.
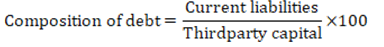 (7)
(7)Immobilization of shareholders' equity: indicates how much the company invested in fixed assets for each unit monetary of equity. Matarazzo (2010) states that companies can become dependent on third-party capital when they apply all
their resources to permanent or fixed assets.
According to Hoji (2010) this percentage index demonstrates the share of the company's financial resources that are invested in permanent assets, in which, as represented in Equation 8, it illustrates the relation between the total permanent assets with the shareholders' equity in which the lower this index the better the company's economic situation.
 (8)
(8)Immobilization of non- current resources: according to Assaf Neto (2012) This ratio indicates the how much non - current resources the company invested in fixed assets by comparing the total fixed assets of a company with the resources invested by the shareholders and for third parties in the long term, in which such index is used to obtain an idea about the amount of permanent assets that the company has in relation to the funds raised for the construction of this asset being used by the company. The low percentage means that the company is more efficient in allocating non-current resources or that permanent assets, as described by Matarazzo (2010), which has a life of its own, can self-finance in the long run. The lower the percentage, the less leveraged shareholder resources the company uses, making its equity position stronger.
The debt composition index is obtained as shown in Equation 9.
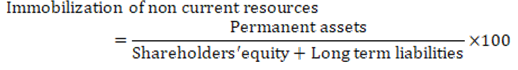 (9)
(9)2.4. Business Games
In order to develop practical skills for management training, such as the skills needed during decision-making, techniques have been increasingly adopted for business games (Sauaia, 2010).
For Khrushchev et al. (2015), enterprise games are a tool for simulating various aspects of the business environment, imitating an industrial process, allowing for a simplified reconstruction of real manufacturing situations.
Two types of activities are possible in business games: representation activities, through the performance of particular professional tasks, and educational activities, which involve the development of skills and knowledge (Khrushchev et al., 2015). In this sense, Tal Ben-Zvi (2010) highlights the capacity of this approach as an important motivation and learning tool, which offers students an opportunity to learn by doing (Marinho et al, 2016), through a simulated real-world experience, immersion in authentic situations management.
In this sense, Sauaia (2010) presents the business games as a component of the so-called Management Laboratory. The Management Laboratory is a model of experiential learning where participants interact and are able to develop skills not captured by traditional teaching methods. The first component of the Management Laboratory is the organizational simulator, which consists of a didactic instrument governed by economic rules, which the participants must know and use of knowledge about management models and economic logic. The second component is the business game, where participants must formulate and control strategies, practice management models, and make decisions in uncertain environments. The third component is applied research, where the participants analyze and discuss the results of the business game in the light of the theories adopted.
2.5. Analytic Hierarchy Process (AHP)
According to Lee & Lee (1975) the Analytic Hierarchy Process (AHP) is a measure of theory used to derive ratio scales of discrete and continuous pairwise comparisons in hierarchical problems for decision-making from a scale that reflects the relative strength of preference. It was developed by Thomas Saaty in the 1970s and has been extensively studied and refined ever since. Escobar et al. (2004) point out that the AHP method decomposes the problem into a hierarchy of criterias and subcriterias, making it easy to understand, in which each of the subcriterias can be independently analyzed through peer-to-peer priorities.
The AHP method was used in this study to identify in a set of fictitious firms the one that obtained the best performance in a business gaming environment, although the applicability of this method is still being extensively explored for the performance evaluation of organizations.
Aguaron & Moreno-Jiménez (2003) and Cao et al. (2008) state that the AHP method has adequate measures to estimate the consistency of the priorities of the decision-making experts and then to improve the consistency of these priorities. Bryson (1996) and Van Den Honert (1998) argue that the AHP method also provides broad theories for aggregation of group preferences and subsequently aids consensus building by systematically using these aggregate preferences. Thus, the AHP method is extremely suitable for group decision support and, therefore, it is justified to adopt this method for the accomplishment of this study. According to Saaty (1990), this method is based on the realization of three stages of analytical thinking, which are:
Construction of hierarchies: according to Tam& Tummala (2000) an AHP hierarchy is a structured way of manually modeling a decision. It consists of a global goal, a set of alternatives to be achieved, and a set of factors or criteria that relate to the alternatives to achieve the goal. Dong et al. (2010) states that criteria can be subdivided into subcriteria in their various nodes and so on, on as many levels as the problem requires. A criterion may not apply evenly, but may have gradual differences. In this case, the criterion is divided into subcriteria indicating different intensities among them, such as: little, medium, high and these intensities are prioritized through comparisons between the pairs of criteria.
Saaty & Vargas (2001) emphasize that hierarchical ordering allows the decision maker a comprehensive view of the system and the interrelationship between the elements involved, allowing the understanding of the impacts that this interrelationship between the elements exerts on the system as aneverything. The Figure 1 illustrates a basic hierarchical structure of the AHP method.
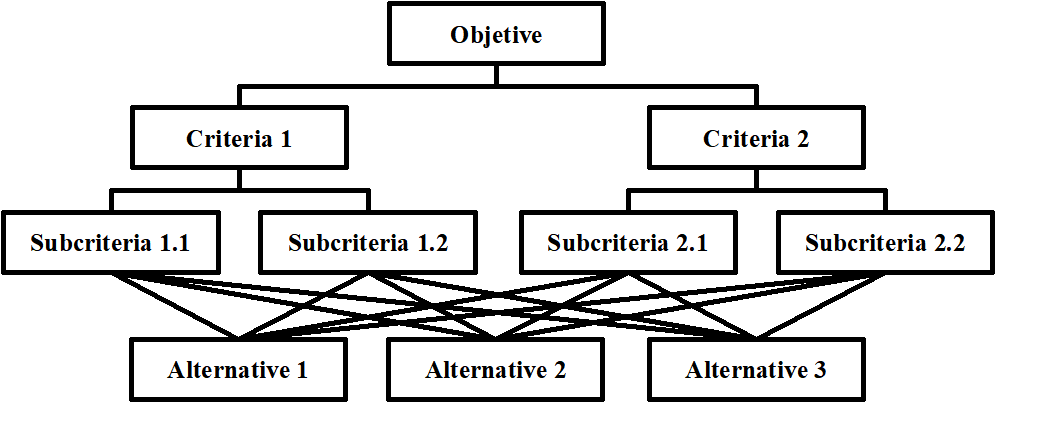
Figure 1 :
Hierarchical Structure
Source: Adapted from Saaty & Vargas (2001).
Setting priorities: Trevizano & Freitas (2005) state that the priorities are numbers associated with the nodes of a AHP hierarchy and are based from the individual 's ability to evaluate the relationship between objects. They represent the relative weights of the nodes in any group of the observed situations, being compared in pairs, by means of a certain criterion, focus or parity judgment (Trevizano & Freitas, 2005).
As probabilities, priorities are absolute numbers between zero and one, without units or dimensions. A criterion with priority 0.4 is twice as important as a criterion as a priority with 0.2, ten times the weight of a priority with 0.04, and so on. Depending on the problem, the "weight" may refer to the importance, or preference, or probability, in which the factor is being considered by decision makers.
Saaty & Vargas (2001) proposes a relative scale of importance between two alternatives as presented in Table 1 and is widely used when applying the AHP method. However, according to Saaty (1990), the parity judgment of the elements using the AHP can be performed in different ways, so its use is not a rule and can be replaced by other metrics, techniques or even methods for affirming factor weights.
| Intensity of Importance | Definition | Explanation |
| 1 | Same importance | The two attributes also contribute to the goal. |
| 3 | Weak importance of one over another | Experience and judgment favor one attribute slightly in relation to the other. |
| 5 | Strong or essential importance | Experience and judgment strongly favor one attribute over another. |
| 7 | Very strong or demonstrated | One attribute is strongly favored over the other; Its predominance of importance is demonstrated in practice. |
| 9 | Absolute Importance | Evidence favors one attribute over another with the highest degree of certainty. |
| 2, 4, 6, 8 | Intermediate values between adjacent values | When a favor condition is sought between two definitions. |
Saaty & Vargas (2001) comment that priorities are distributed by a hierarchy according to their architecture, and their values depend on the information entered by process users. Priorities about objectives, criteria and alternatives are closely related, yet need to be considered separately.
The priority of the objective is 1. The priorities of the alternatives always add up to 1. The complexity of the problem increases as criteria levels increase, yet with only one level, your priorities also contribute to 1.
Consistency logic: According to Saaty (1990) The individual has the ability to create consistent relationships between ideas or objects allowing be consistency between the relationships built about goals. Thus, the AHP among its stages, proposes the realization of the calculation of the judgments consistency ratio, in which JC=CI/RC, where RC is the Random Consistency Index obtained from a reciprocal matrix of order n, by means of non-negatively generated elements. But the Consistency Index (CI) is obtained by CI=(λmáx -n)/(n-1) where λmáx, inserted into an array of trials, is the largest eigenvalue. Saaty (1990) states that, so there is consistency of judgments, it is necessary that JC≤1,10.
3. Methodology
Following the classification proposed by Gonçalves (2007), this research is characterized as descriptive regarding the objectives, adopting the method of longitudinal case study as a research procedure, using documents from the management laboratory as sources of information (Gama et al, 2016), and making use of quantitative data. Furthermore, it is an ex post facto search for occurrences will be evaluated after the variables have interfered about the search object, since it is not possible interference in the results.
4. Results
In order to present the applicability of the performance indicators related to the assets employed, a case study carried out in a simulated environment characterized as a business game, in which such dynamics occurred in the discipline of Simulated ManagementBusiness, of Professional Master's Degree in Administration of the Federal Fluminense University, in the campus of the city of Volta Redonda, state of Rio de Janeiro. This dynamic involved six groups of students of the discipline, having as instructor and mediator of the game the teacher of the discipline.
The six groups involved formed six companies in a single competitive market environment, but competing in two distinct segments of companies that were related, which are the industry and the wholesale. Three groups served as companies in the industry segment and the other three groups operated in the wholesale segment.
The dynamics of the game unfolded involving the industry that, in order to produce the products, acquired the raw material of a fictitious company mediated by the professor, who not only was involved in the game as a supplier of raw material but also as a supplier of financial products and market information consulting services for all participating companies.
The industry had the manufacturing capability of three types of fictitious electronic products called Alpha, Beta and Omega. Each one with demands, costs of production and consumption of different times of productions.
The wholesale market, in turn, market the three products produced by the industry in a relationship of supplier and customer, in which the wholesale was act as an industry customer and, when acquiring the products of the industry, marketed them to the simulated retail, based on a relation of demand expectation of the consumer market and prices practiced for the commercialization of the products. Therefore, wholesale companies needed to negotiate the purchase prices of the products with the industry in order to become competitive in prices and costs, and in turn the industry needed to acquire the raw materials and produce them at the lowest cost aimed at maximizing financial results, based on production costs, transaction costs and selling prices for wholesale.
The dynamics of the game occurred with eight rounds, each round being equivalent to a quarter of a fiscal period in which the entire game lasted two ficticious years.
At the end of each round, the mediator distributed the results of the decisions taken by the companies through financial, accounting and operational statements. The financial statements included the balance sheet (BS) and the profit and loss (P&L) for the period.
The eight quarterly periods were denominated as: t1, t2, t3, t4, t5, t6, t7 and t8, respectively from the first to the eighth quarter. And the two fiscal years are termed as 2015 and 2016.
The three game industries, research objetcs, were formed under the following denominations: BIT S/A, EJM S/A and BMP S/A.
The present study is delimited in evaluating the performance of the assets of the three companies of the industry segment engaged in the game. For this purpose, the financial statements for the simulated year 2015 and 2016 were used as the basis of calculation, briefly in whichTable 2shows the Balance Sheet for the simulated periods of 2015 and 2016 andTable 3shows the Income Statement of the Simulated exercises of 2015 and 2016, for each of the three industries of the game.
| Balance Sheet - BIT S/A | |||||
| Asset | 2015 | 2016 | Liabilities | 2015 | 2016 |
| Current | 58,667 | 103,3 17 | Current | 60,722 | 177,059 |
| -Cash & Banks | 27,677 | - | -Supplier | 27,984 | 107,520 |
| - Customers | 30,991 | 103,317 | - Taxes Payable | - | - |
| - Inventories | - | - | -IR/CSLL Payable | 21,349 | 12,186 |
| -Dividends Payable | 7,686 | 22,065 | |||
| Permanent | 31,528 | 91,513 | - Loans | 3,703 | 35,288 |
| - Property | 32,555 | 101,175 | |||
| (-)Depr. accumulated | -1,027 | -9,662 | Shareholders' equity | 29,473 | 17,771 |
| (=)Net | 31,528 | 91,513 | -Capital & Reserves | -6,186 | -28,250 |
| -Accumulated profits | 35,659 | 46,022 | |||
| TOTAL | 90,195 | 194,830 | TOTAL | 90,195 | 194,830 |
| Balance Sheet - EJM S/A | |||||
| Asset | 2015 | 2016 | Liabilities | 2015 | 2016 |
| Current | 41,493 | 152,082 | Current | 25,378 | 82,871 |
| - Cash & Banks | 16,344 | 43,808 | - Supplier | 14,548 | 48,945 |
| - Customers | 25,148 | 78,942 | - Taxes Payable | - | - |
| - Inventories | - | 29,332 | -IR/CSLL Payable | 10,726 | 33,925 |
| -Dividends Payable | 104 | - | |||
| Permanent | 6,243 | 11,936 | - Loans | - | - |
| - Property | 6,755 | 15,043 | |||
| (-)Depr. accumulated | -512 | -3,106 | Shareholders' equity | 22,358 | 81,147 |
| (=)Net | 6,243 | 11,936 | -Capital & Reserves | 882 | 12,494 |
| -Accumulated profits | 21,476 | 68,653 | |||
| TOTAL | 47,736 | 164,018 | TOTAL | 47,736 | $ 164,018 |
| Balance Sheet - BMP S/A | |||||
| Asset | 2015 | 2016 | Liabilities | 2015 | 2016 |
| Current | 71,727 | 229,150 | Current | 51,226 | 168,165 |
| - Cash & Banks | 36,981 | 161,532 | - Supplier | 31,093 | 66,566 |
| - Customers | 34,747 | 67,618 | - Taxes Payable | - | - |
| - Inventories | - | - | -IR/CSLL Payable | 20,132 | 91,598 |
| -Dividends Payable | - | 10,000 | |||
| Permanent | 21,874 | 17,273 | - Loans | - | - |
| - Property | 23,005 | 23,005 | |||
| (-)Depr. accumulated | -1,132 | -5,733 | Shareholders' equity | 42,375 | 78,258 |
| (=)Net | 21,874 | 17,273 | -Capital & Reserves | 1,500 | 2,375 |
| -Accumulated profits | 40,875 | 75,883 | |||
| TOTAL | 93,601 | 246,423 | TOTAL | 93,601 | 246,423 |
| P&L - BIT S/A | 2015 | 2016 |
| Gross Sales | 113,487 | 670,971 |
| (-) Sales Taxes | - | - |
| (=) Net Sales | 113,487 | 670,971 |
| (-)Costs of Sales | -76,656 | -660,390 |
| (=) Contribution Margin | 36,832 | 10,589 |
| (-)Operational Expenses | -4,502 | -23,283 |
| (+) Financial Income | 32,666 | 188,798 |
| (=) Operational Income | 64,996 | 176,097 |
| (-)Financial Expenses | -303 | -139,170 |
| (=) Earnings Before Taxes | 64,694 | 36,927 |
| (-) Income Tax | -21,349 | -12,186 |
| (=) Net Profit/ (Loss) | 43,345 | 24,741 |
| (-)Dividends | -7,686 | -14,379 |
| (=) Retained Earnings | 35,659 | 10,362 |
| P&L - EJM S/A | 2015 | 2016 |
| Gross Sales | 72,568 | 242,360 |
| (-) Sales Taxes | - | - |
| (=) Net Sales | 72,568 | 242,360 |
| (-) Costs of Sales | -47,677 | -229,085 |
| (=) Contribution Margin | 24,891 | 13,275 |
| (-) Operational Expenses | -3,446 | -10,047 |
| (+) Financial Income | 11,554 | 99,351 |
| (=) Operational Income | 33,000 | 102,579 |
| (-) Financial Expenses | -180 | - |
| (=) Earnings Before Taxes | 32,820 | 102,579 |
| (-) Income Tax | -10,726 | -33,925 |
| (=) Net Profit/ (Loss) | 22,094 | 68,653 |
| (-) Dividends | -618 | -21 |
| (=) Retained Earnings | $ 21,476 | $ 47,177 |
| P&L - EJM S/A | 2015 | 2016 |
| Gross Sales | 126,580 | 421,656 |
| (-) Sales Taxes | - | - |
| (=) Net Sales | 126,580 | 421,656 |
| (-) Costs of Sales | -86,900 | -302,084 |
| (=) Contribution Margin | 39,680 | 119,572 |
| (-) Operational Expenses | -4,774 | -13,643 |
| (+) Financial Income | 26,568 | 171,395 |
| (=) Operational Income | 61,475 | 277,324 |
| (-) Financial Expenses | -115 | - |
| (=) Earnings Before Taxes | 61,359 | 277,324 |
| (-) Income Tax | -20,132 | -91,598 |
| (=) Net Profit/ (Loss) | 41,227 | 185,726 |
| (-) Dividends | -352 | -150,718 |
| (=) Retained Earnings | 40,875 | 35,008 |
Table 4 shows the results achieved in the nine indicators proposed in this article.
| 1. Current Liquidity | 2.1 Asset Turnover | 2.2 Net Margin | ||||
| Company | 2015 | 2016 | 2015 | 2016 | 2015 | 2016 |
| BIT S/A | 0.96616 | 0.58352 | 1.25824 | 3.44389 | 38.194% | 3.687% |
| EJM S/A | 1.63501 | 1.83517 | 1.52019 | 1.47764 | 30.446% | 28.327% |
| BMP S/A | 1.40022 | 1.36265 | 1.35234 | 1.71111 | 32.570% | 44.047% |
| 2.3.1 ROA | 2.3.2 ROE | 3.1Immobilization of shareholders' equity | ||||
| Company | 2015 | 2016 | 2015 | 2016 | 2015 | 2016 |
| BIT S/A | 48.057% | 12.699% | 147.065% | 139.221% | 106.972% | 514.953% |
| EJM S/A | 46.284% | 41.857% | 98.820% | 84.603% | 27.923% | 14.709% |
| BMP S/A | 44.046% | 75.369% | 97.291% | 237.324% | 51.619% | 22.071% |
| 3.2 Immobilization of non-current resources | 3.3 Composition of debt | 3.4 Third-party capital participation | ||||
| Company | 2015 | 2016 | 2015 | 2016 | 2015 | 2016 |
| BIT S/A | 0.00% | 0.00% | 1639.635% | 501.752% | 12.565% | 198.569% |
| EJM S/A | 0.00% | 0.00% | 0.000% | 0.000% | 0.000% | 0.000% |
| BMP S/A | 0.00% | 0.00% | 0.000% | 0.000% | 0.000% | 0.000% |
The methodology applied to assist in the selection of the fictitious company that performed best in the business game is based on the concepts of AHP, which is a multi-criteria method to aid decision making, which is based on the realization of multiple comparisons of qualitative and quantitative attributes.
The objective of this method is to make comparisons, in order of priority, multiple alternatives, identifying the most suitable alternative.
To illustrate a vision of the case study, we constructed a hierarchical structure as shown inFigure 2, which is shown at the top of the tree the objective to be achieved in this research work, which is to identify the companies involved in the business game that have achieved the bests financials performance in accordance with the three established criteria that were: a) current liquidity ratio; b) profitability ratios; c) capital structure ratios. Being that these criteria have subcriteria and that will contribute to the company's definition with better performance, in which case comprises the best alternative, which are: a) BIT S/A; b) EJM S/A; c) BMP S/A.
The logical and mathematical rational process involved in applying the AHP method establishes the need to define weights or preferences for the criteria and subcriteria in the various hierarchical levels, allowing then, from the data obtained by the indicators, involve a mathematical process which leads to identification alternative of greater relevance. The next step was the determination of the weights for each of the criteria and subcriteria in identifying an order of most important to least important. The definition of weights to the criteria and subcriteria, as shown in
Table 5, was according to a valuation model of financial performance proposed by Bertoluzzi et al. (2011), in which these authors used multiple criteria methodology to support decision constructivist (MCDA-C) integrating these same indicators used in this research work to assess the financial performance of a coffee industry.
Using the same premise of weights to the criteria is relevant because what is wanted to highlight in this research is the application of the AHP method for identifying, in a business gaming, the company that achieved the best financial performance.
It is important to emphasize that subjectivity in defining weights or preferences of the criteria is an impactful variable in the range of the object result of a study involving the application of a multi-criteria methodology such as the AHP method, so they are important, depending of complexity of the study, preliminary steps for a more careful definition of weights and preferences for the criteria involved.
The software used for the application of the AHP method was SuperDecisions®.
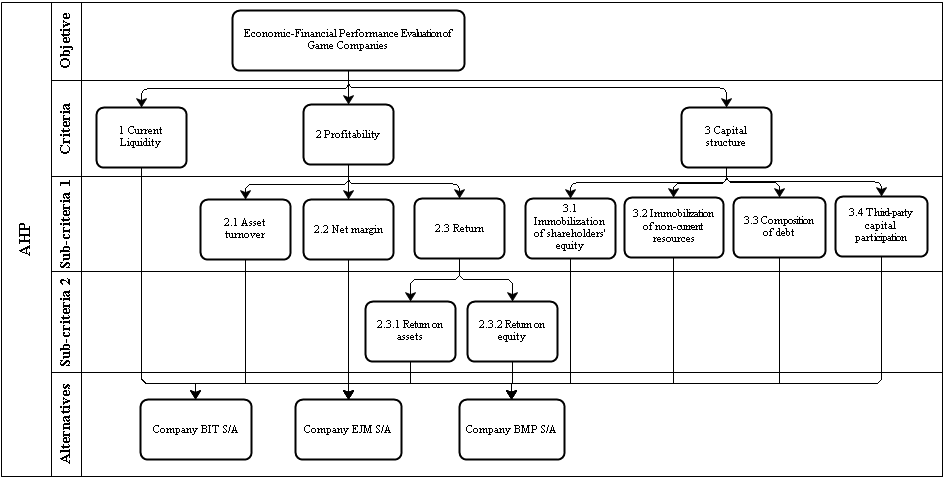
Figure 2 :
Hierarchical structure of criteria and alternatives for achieving the objective. Source: Prepared by the author.
Source: Prepared by the author.
| Criteria | Weight Criteria | Subcriteria 1 | Weight Subcriteria 1 | Subcriteria 2 | Weight Subcriteria 2 |
| Current Liquidity | 27% | ||||
| Profitability | 64% | Asset turnover | 7% | ||
| Net margin | 33% | ||||
| Return | 60% | ROA | 66% | ||
| ROE | 34% | ||||
| Capital structure | 9% | Immobilization of shareholders’ equity | 44% | ||
| Immobilization of non-current resources | 20% | ||||
| Composition of debt | 4% | ||||
| Third-party capital participation | 32% |
The determination of weights to each criterion in line with the objective proposed in this study is calculated from the priority vector. However, as the weights were assigned directly in percentage there is no need to calculate the vector using the arithmetic mean of the values for each of the criteria.
The amounts allocated as weights the criteria and subcriteria has significant physical importance to AHP because it is the participation of that criteria on the overall outcome of the objective defining the priority criteria and subcriteria. In
Graphic 1 is illustrated standard criteria and their order of importance. As seen in
Graphic 1the most relevant criterion is the profitability index, and its lower level as subcriteria1 priority are returns rates, highlighting the ROE index at the level of sub-criterion 2 getting the highest priority among these subcriteria.
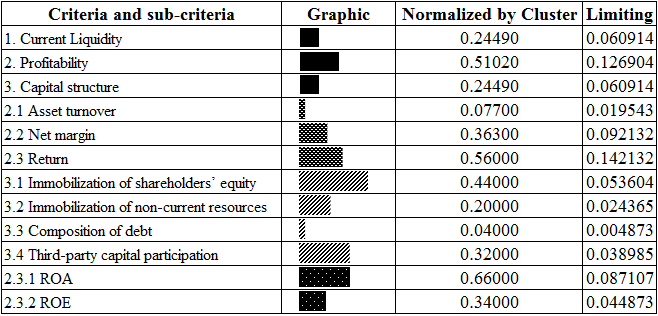
Graphic 1 :
Priorities of the criteria and alternatives in 2015 from the application of AHP
Source: Prepared by the author.
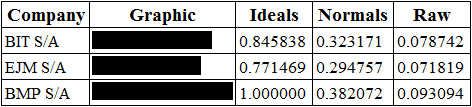
It is worth noting that the company that achieved the highest results in relation to this criterias results was the company BIT S/A in the 2015 period, highlighting the net margin rates (38.194%), ROA (48.057%) and ROE (147.065%). The EJM S/A company achieved the second best result in the indices for the results, highlighting the asset turnover rate in which this company achieved the best performance (1.52019%), the company BIT S/A obtained the second position in this index. The results of 2015 obtained applying the AHP method with the SuperDecisions® software were synthesized as shown inGraphic 2.
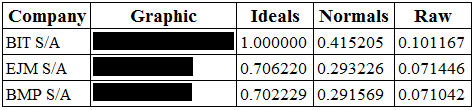
Graphic 2 :
Synthesized results of companies in the year 2015 from the application of AHP
Source: Prepared by the author.
Though in the year 2016 the financial performance of companies has changed, likely a result of changes in pricing strategies and volume/ mix products. This fact becomes evident when performing the analysis by AHP for indexes obtained by the companies during the period of 2016. It is observed inGraphic 3that in this period the company that achieved the best performance was the company BPM S/A, overcoming the company BIT S/A company and EJM S/A getting these second and third respectively. Note that, following the same assumptions concerning the weights of the criteria in the year 2015 to the year 2016, the BMP S/A company performed better on the results than its competitors on the indexs, highlighting the following: net margin (44.047%), ROA (75.369%), and ROE (237.324%).
Graphic 3 :
Synthesized results of companies in the year 2016 from the application of AHP
Source: Prepared by the author.
5. Considerations
The analysis obtained from the performance of assets employees in the companies must be an activity constantly performed by administrators, regardless of the type or nature of the organization. Given the importance of obtaining return on the capitals invested in the companies in order to reach the satisfaction of shareholders or meet the investors' expectations. Therefore, the monitoring of these indicators used in this research work allows not only show the result, but diagnosing the elements that support to achieve this.
The instruments used in this research work aiming to appraise the performance of the assets of the companies were the current liquidity index, the indexs of profitability and capital structure indexs. It was applied the AHP method for the identification of the company had the best financial performance in the game by balancing the weights of the criteria, in which, even though some limitations on their applicability, allow us to observe important signals about the performance of managers in relation to asset management, decision making, and especially the maximization of available resources.
In this study, it was concluded that, among the three analyzed industries, BMP S/A company achieved the highest performance on the management of the assets, creating greater economic value, thus allowing remunerate the capital invested in this company. The EJM S/A company also achieved favorable results to return on invested capital, created additional value, but not in the same effectiveness of the company BMP S/A and BIT S/A. Already BIT S/A company stands out in the first year with the highest levels of performance, especially in the indexes related to the profitability, but observing the financial statements it is observed that there were non-operating disbursements in the second year, however, it is unclear what the reason for this disbursement was and it is also unclear whether it should really have an impact on the outcome, since the significant increase in the cost of capital is not justified by an increase in debt, taking the findings that, or there was a significant increase in interest on loans, or the postings of the accounting are wrong harming the results of this company. But what is evident through the BS report and the P&L, is that in the second year the BIT S/A company destroyed value. However, reaching positive return on equity obtaining the second position in performance in the 2016 period.
It is worth noting the limitations of this experiment because of the few companies involved in the environment, however the application of the method does not affect the amount of surveyed companies, nor as to the corporate segment. So is it important and serves as an opportunity for future research applying the same valuation model for the wholesale segment companies also involved in the game, in order to corroborate the method Besides the use of other performance assessment tools on resources financial and implementing a better structured approach to the allocation of weights to the criteria.
References
Aguaron, J.,& Moreno-Jiménez, J. M. (2003). The geometric consistency index: Approximated thresholds. European Journal of Operational Research, 147(1), 137-145.
Assaf, A. Nt.(2012). Finanças corporativas e valor. São Paulo: Atlas. stocks. In Annual Meeting of the American Finance Association (pp. 435-452).
Ben-Zvi, T. (2010). The efficacy of business simulation games in creating Decision Support Systems: An experimental investigation. Decision Support Systems, 49(1), 61-69.
Berzakova, V., Bartosova, V., & Kicova, E. (2015). Modification of EVA in Value Based Management. Procedia Economics and Finance, 26, 317-324.
Bortoluzzi, S. C., Ensslin, S. R., Lyrio, M. V. L., & Ensslin, L. (2011). Avaliação de desempenho econômico-financeiro: uma proposta de integração de indicadores contábeis tradicionais por meio da metodologia multicritério de apoio à decisão construtivista (MCDA-C). Revista Alcance, 18(2), 200-218.
Bryson, N. (1996). Group decision-making and the analytic hierarchy process: Exploring the consensus-relevant information content. Computers & Operations Research, 23(1), 27-35.
Cao, D., Leung, L. C., & Law, J. S. (2008). Modifying inconsistent comparison matrix in analytic hierarchy process: A heuristic approach. Decision Support Systems, 44(4), 944-953.
Copeland, T. E., Koller, T., & Murrin, J. (2002). Avaliação de empresas-valuation: calculando e gerenciando o valor das empresas. Pearson Makron Books.
Damodaran, A. (2007). Avaliação de empresas. Pearson Prentice Hall.
Dong, Y., Zhang, G., Hong, W. C., & Xu, Y. (2010). Consensus models for AHP group decision making under row geometric mean prioritization method. Decision Support Systems, 49(3), 281-289.
Escobar, M. T., Aguarón, J.,& Moreno-Jiménez, J. M. (2004). A note on AHP group consistency for the row geometric mean priorization procedure. European Journal of Operational Research, 153(2), 318-322.
Gama, M. X. B. et al (2016). A Liderança na Era da Informação e do Conhecimento nas empresas. Research, Society and Development, 3(1) 02-18.
Gitman, L. J. (2010). Princípios de administração financeira. Pearson Prentice Hall.
Gonçalves, E. P. (2007). Iniciação à pesquisa científica. Campinas: alínea.
Helfert, E. A. (2000). Técnicas de análise financeira: um guia prático para medir o desempenho dos negócios. Erich A. Helfert.
Hoji, M. (2010). Administração Financeira E Orçamentária: Matemática Financeira Aplicada, Estratégias Financeiras, Orçamento Empresarial . Editora Atlas SA.
de Iudicibus, S. (2009). Análise de balanços. Atlas.
Junior, J. H. P., Begalli G. (2010). Elaboração e análise das demonstrações contábeis. Editora Atlas SA.
Khrushchev, Y., Batseva, N., Fix, N., Chesnokova, I., & Khar’kovskaya, V. (2015). Business Games in Training Engineering Students. Procedia-Social and Behavioral Sciences, 206, 267-271.
Lee, S. C., & Lee, E. T. (1975). Fuzzy neural networks. Mathematical Biosciences, 23(1), 151-177.
Marinho, A. S. et al (2016). Aplicação móvel de matemática no ensino básico para crianças do ensino fundamental I do 1° ao 3° ano.Research, Society and Development, 3(1), 69-90.
Martelanc, R., Pasin, R., & Cavalcante, F. (2005). Avaliação de empresas: um guia para fusões e aquisições e gestão de valor. Pearson Prentice Hall.
Martins, E. (2001). Avaliação de empresas: da mensuração contábil à econômica. Caderno de estudos, (24), 28-37.
Matarazzo, D. C. (2010). Analise financeira de balanços: abordagem básica e gerencial. Atlas.
de Rezende Reis, A. C. (2009). Demonstrações contábeis: estrutura e análise. Saraiva.
Saaty, T. L. (1990). How to make a decision: the analytic hierarchy process. European journal of operational research, 48(1), 9-26.
Saaty, T. L., & Vargas, L. G. (2001). Models, methods, concepts & applications of the analytic hierarchy process. Springer Science & Business Media.
Jakub, S., Viera, B., & Eva, K. (2015). Economic Value Added as a Measurement Tool of Financial Performance. Procedia Economics and Finance, 26, 484-489.
Sauaia, A. C. A. (2010). Laboratório de gestão: simulador organizacional, jogo de empresas e pesquisa aplicada. Editora Manole.
Da Silva, J. P. (2008). Análise financeira das empresas. Editora Atlas SA.
Tam, M. C., & Tummala, V. R. (2001). An application of the AHP in vendor selection of a telecommunications system. Omega, 29(2), 171-182.
Trevizano, W. A., & Freitas, A. L. P. (2005). Emprego do Método da Análise Hierárquica (AHP) na seleção de Processadores. XXV Encontro Nac. de Engenharia de Produção–Porto Alegre.
Van den Honert, R. C. (1998). Stochastic group preference modelling in the multiplicative AHP: A model of group consensus. European Journal of Operational Research, 110(1), 99-111.
Wernke, R. (2008). Gestão financeira: ênfase em aplicações e casos nacionais. Saraiva.
Young, S. D., & O’byrne, S. F. (2001).EVA and value-based management. New York.