Abstract: Recent IPCC reports suggest that the world is getting warmer. Consequently, the concentration of atmospheric water vapor, which determines the water for precipitation, is substantially increasing in accordance with the Clausius-Clapeyron (CC) relationship, which establishes that water vapor in the atmosphere increases at a rate of 7% per °C of warming. In this study, we explored the relationship between extreme precipitable water events and temperature over the whole globe, its two hemispheres, and the 5° latitudinal bands by using NCEP/NCAR and MERRA-2 reanalysis data for 1980-2017. Our results indicate that extreme precipitable water events linked to temperature basically follow the CC relationship at temperatures roughly below 5°C and the sub-CC relationship for temperatures above ~5°C, globally and in both hemispheres. The relationship between extreme precipitable water events and temperature over latitudinal regions is not uniform and varies regionally. Our results further indicate that the increasing rate of extreme precipitable water events is higher in the tropics and mid-latitudes of the southern hemisphere than in the northern hemisphere. This study shows the usefulness of the principle of Clausius-Clapeyron relationship to explain extreme precipitable water events linked to temperature.
Keywords:Clausius-Clapeyron relationshipClausius-Clapeyron relationship,NCEP/NCARNCEP/NCAR,MERRA-2MERRA-2.
Resumen: Informes recientes del IPCC sugieren que el mundo se está calentando. Como resultado, la concentración atmosférica de vapor de agua, que determina el agua precipitable, está aumentando de manera considerable en concordancia con la relación Clausius-Clapeyron (cc), la cual establece que el vapor de agua en la atmósfera se incrementa a razón de 7% por cada grado centígrado de calentamiento. En este estudio se explora la relación entre eventos extremos de agua precipitable y la temperatura a nivel global, en ambos hemisferios, y en las bandas latitudinales de 5°, utilizando para ello datos de reanálisis de NCEP/NCAR y MERRA-2 correspondientes al periodo 1980-2017. Nuestros resultados indican que los eventos extremos de precipitación vinculados con temperatura obedecen básicamente a la relación CC para temperaturas por debajo de los 5°C y a una relación sub-CC para temperaturas por encima de los 5°C a nivel global y en ambos hemisferios. La relación entre eventos extremos de precipitación y temperatura en regiones latitudinales no es uniforme y presenta variaciones regionales. Los resultados indican también que el incremento en la tasa de eventos de precipitación extrema es mayor en los trópicos y latitudes medias del hemisferio sur en comparación con los del hemisferio norte. Este estudio demuestra la utilidad de la relación CC para explicar eventos de precipitación extrema vinculados a la temperatura.
Palabras clave: relación Clausius-Clapeyron, NCEP/NCAR, MERRA-2.
Dependence of extreme precipitable water events on temperature
Universidad Nacional Autónoma de México

This work is licensed under Creative Commons Attribution-NonCommercial 4.0 International.
Received: 17 April 2017
Accepted: 04 March 2019
According to recent Intergovernmental Panel on Climate Change (IPCC) reports, the world is getting warmer (IPCC 2007, 2012). Consequently, the concentration of atmospheric water vapor, which determines the water for precipitation, is substantially increasing in accordance with the Clausius-Clapeyron (CC) relationship, which establishes that the water vapor content in the atmosphere increases at a rate of 7% per 1°C rise in temperature. Thus, under warmer air temperature, the amount of water vapor available for precipitation is expected to significantly increase, which may lead to the increase in the occurrence of precipitation events. Previous studies also revealed an increasing rate of global precipitation in recent decades and suggest wet regions to become further wetter (Durack et al., 2012).
Precipitable water is a measure of the global precipitation changes and has a positive correlation with precipitation in a synoptic scale (Lu et al., 2009). In a recent study, Roman et al. (2015) reported that extreme precipitable water events are expected to increase globally by a factor of 9 under future warmer climate. In addition, several studies (e.g., Held and Soden, 2006; Durack et al., 2012; Westra et al., 2014; Nayak and Dairaku, 2016; Prein et al., 2017; Nayak, 2018) highlight that extreme precipitation events will increase in rough proportion to the rate anticipated from CC relationship, i.e., at a rate of ~7% per degree centigrade of rise in temperature in a regional scale and at a lower rate globally due to energy constraints. In general, extreme precipitation events need a high amount of precipitable water, which is determined from atmospheric water vapor. Thus, it is also expected that extreme precipitable water events will increase with temperature in accordance to the rate expected from the CC relationship.
However, no comprehensive studies have yet been conducted to discuss the relationship between extreme precipitable water events and temperature. Previous studies did not give enough consideration to this topic because their main objective was to investigate the relationship of extreme precipitation events with temperature. Although the increase of atmospheric water vapor with temperature is obvious from the CC relationship as well as some previous studies (e.g., Allen and Ingram, 2002; Held and Soden, 2006; Nayak and Dairaku, 2016; Nayak et al., 2017), it is unclear if a relationship between extreme precipitable water events and temperature changes exists and if it follows the CC relationship. How robust is this relationship in both hemispheres and latitude intervals? This study intends to answer these questions by analyzing two reanalysis datasets over the globe for the period 1980-2017 (38 years): (1) the National Centers for Environmental Prediction/National Center for Atmospheric Research (NECP/NCAR) data; and (2) the Modern-Era Retrospective Analysis for Research and Applications, v. 2 (MERRA-2) data.
Surface air temperature and atmospheric precipitable water fields were analyzed from NCEP/NCAR (Kalnay et al., 1996) and MERRA-2 (Gelaro et al., 2017) reanalyses for the period 1980-2017 (38 years). Data from the NCEP/NCAR reanalysis had 2.5° daily resolution, while those from MERRA-2 50-km hourly resolution. NCEP/NCAR precipitable water was captured in the entire atmospheric column at each grid point and directly obtained from the source. However, in the case of MERRA-2, a daily sum was calculated from the hourly precipitable water vapor in the entire atmospheric column at each grid point. In these methods, precipitable water events (defined as ≥ 1 mm d–1) are paired with the corresponding day’s temperature and the pairs are placed in different temperature bins with a 1°C interval. Finally, the 99th percentile of precipitable water events is computed in each temperature bin. The rate of increase of extreme precipitable water is explored by applying a least squared linear regression to the logarithm of precipitable water events, which is similar to the following equation:
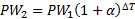 (1)
(1)where PW1 and PW2 are precipitable water events at two different temperatures T1 and T2, respectively;  is the change in temperature, and α is the rate of change of extreme precipitable water, which is equivalent to ~0.07 in the case of CC. Eq. (1) is derived from the August-Roche-Magnus approximation of the Clausius-Clapeyron relationship and a similar derivation is described in Nayak et al. (2017).
This method is applied separately to analyze the relationship between extreme precipitable water events and temperature over the whole globe, its two hemispheres, and the 5° latitudinal bands.
The 99th percentile of precipitable water events linked to temperature during 1980-2017 from NCEP/NCAR and MERRA-2 data are illustrated in Figure 1, which shows the relationship between extreme (99th percentile) precipitable water events and temperature over the whole globe, the northern and southern hemisphere, and 36 regions within 5° latitudinal bands. The results indicate that extreme precipitable water events increase with temperature over the whole globe irrespective of the hemispheres and the latitudinal regions. This increasing behavior is also noticed in all temperature ranges with different magnitudes depending on the latitudinal bands.
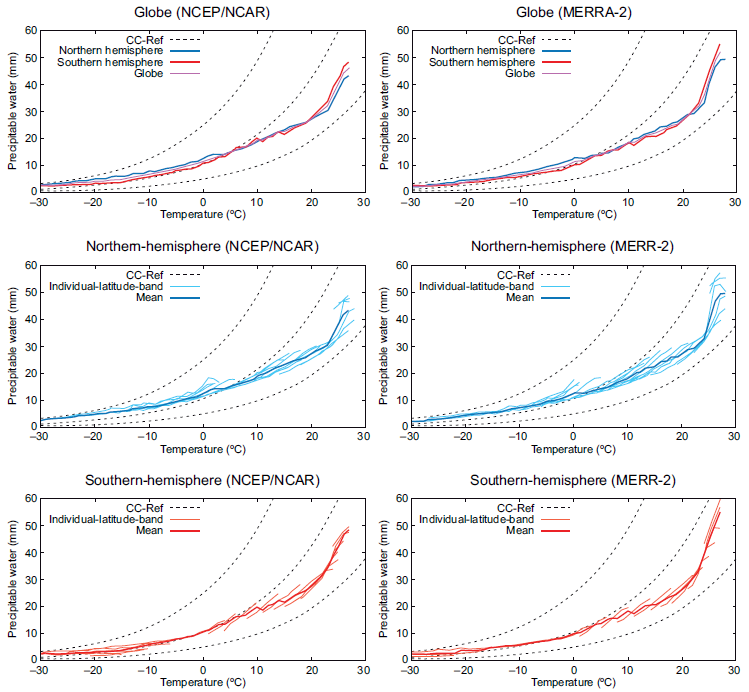
Fig. 1
99th percentile of mean daily precipitable water (column integrated) with a 1 mm day–1 threshold as a function of daily mean temperature during 1980-2017 from NCEP/NCAR reanalysis (left panel) and MERRA-2 reanalysis (right panel). Results correspond to the whole globe (magenta), the two hemispheres (northern hemisphere, solid blue, and southern hemisphere, solid red, respectively). The CC relationship (~7% per °C rise in temperature) is used as a reference and shown as dotted lines. Thin lines show the results from different regions within 5° latitudinal bands (18 regions in northern hemisphere [light blue] and 18 regions in the southern hemisphere [light red])
The relationship between precipitable water and temperature is found almost similar in both the NCEP/NCAR and MERRA-2 datasets, indicating the robustness of the results. The relationship in MERRA-2 shows slightly higher values at higher temperatures above ~25°C compared to those in NCEP/NCAR, probably owing to a higher increasing rate of precipitable water in this period (Fig. A1). Extreme precipitable water events increase with temperature and follow the CC relationship for temperatures roughly below 5°C; however, extreme precipitable water events follow sub-CC relationship for temperatures above 5°C.
Since atmospheric water vapor determines the water for precipitation, the dependent behavior of atmospheric precipitable water events on temperature should also follow the CC relationship. Perhaps atmospheric precipitable water becomes insufficient at higher temperatures to hold the CC relationship. Berg et al. (2009) highlighted that at higher temperatures more moisture is required for saturation to maintain the CC relationship. Moreover, increasing the temperature does not increase the atmospheric water vapor endlessly (e.g., Westra et al., 2014). The relationship between extreme precipitable water events and temperature is not uniform at different latitudinal regions. It follows the CC relationship at few latitudinal regions, while sub-CC relationship over some regions and super-CC relationship over other regions. The variation could be due to latitudinal temperature differences and associated moisture availability. However, the magnitude of extreme precipitable water events linked to temperature is found to be slightly higher (lower) over the northern hemisphere than over the southern hemisphere at lower (higher) temperatures.
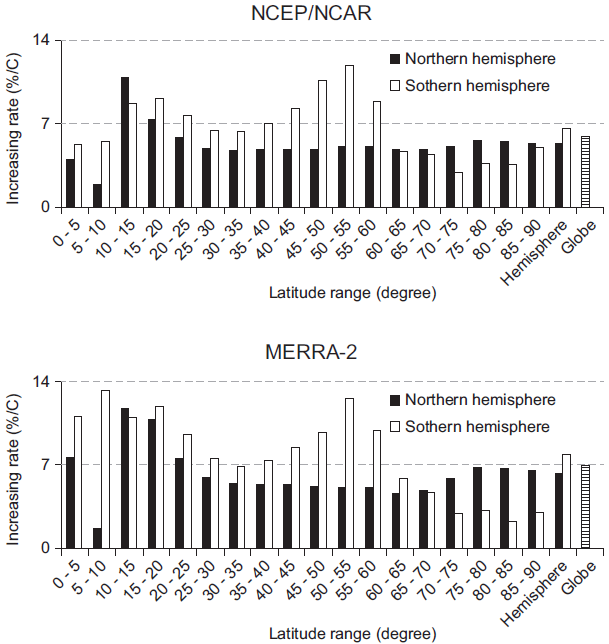
Fig. 2
Rate of change of the 99th percentile of precipitable water events during 1980-2017 from NCEP/NCAR and MERRA-2 reanalysis. Results correspond to the CC scaling from different latitudinal regions with 5° intervals in the two hemispheres.
The rate of change of the 99th percentile of precipitable water events (i.e., α) over each latitudinal region during the period 1980-2017 from NCEP/NCAR and MERRA-2 is computed using Eq. (1) and shown in Figure 2. It indicates that the rate of increase of extreme precipitable water events is very similar in both datasets with slightly higher values over the tropics in MERRA-2. The increasing rate is higher (lower) in the tropics and mid-latitudes (poles) of the southern hemisphere than in the northern hemisphere. The reason could be associated with the seasonality and regionality because atmospheric water vapor is not uniform along the latitudinal regions throughout the seasons (Takemi et al., 2012). For example, in January the highest amount of atmospheric moisture is available over the equatorial west Pacific while the lowest amount may be found in the northwest regions of the Pacific and Atlantic. Similarly, the amount of atmospheric moisture may be higher over mid-latitudes of the southern hemisphere (40-60°S) due to larger ocean surface. The increasing rates of extreme precipitable water events are found in the range of 4 - 6% °C–1 over the regions above 25°N, while the same is found higher than 6% °C–1 over the regions between 60°S-20°N except between 5 °S - 10°N in NCEP/NCAR (found as 1 - 4% °C–1 including the regions below 60 °S). The results indicate that extreme precipitable water events during 1980-2017 exhibit the CC scaling behavior over the region between 40° - 20° S, and 15°-20°N, while those events exhibit sub-CC scaling over all other regions except between 60° - 45°S, 20°-10°S, and 10°-15°N, where super-CC scaling is found. However, the overall results from NCEP/NCAR and MERRA-2 datasets indicate that extreme precipitable water events over the northern (southern) hemisphere increases at a rate of ~6% °C–1 (~7% °C–1).
This study explored the relationship between extreme precipitable water events and temperature over the whole globe, two hemispheres and 36 different latitudinal regions within 5° bands using the NCEP/NCAR and MERRA-2 datasets. Results indicate that extreme precipitable water events linked to temperature basically follow the CC relationship at temperatures roughly below 5°C and sub-CC relationship for temperatures above ~5°C over the whole globe as well as in each hemisphere. The results further indicate that the increasing rate of extreme precipitable water events is higher in the tropics and mid-latitudes of the southern hemisphere than in those of the northern hemisphere. The overall results indicate that extreme precipitable water events increase at a rate of ~7% °C–1 (~6% °C–1 over the northern hemisphere and ~7% °C–1 over the southern hemisphere). This study provides a general idea on the dependence of extreme precipitable water events on temperature. More in-depth analysis is required on this issue by using climate model datasets over different regions for each season.
The comments by anonymous reviewers are greatly acknowledged to improve the manuscript. The authors gratefully acknowledge the National Oceanic and Atmospheric Administration (NOAA) and the National Aeronautics and Space Administration (NASA) for providing the NCEP/NCAR reanalysis data (http://www.esrl.noaa.gov/psd/) and MERRA-2 reanalysis data (https://gmao.gsfc.nasa.gov/reanalysis) respectively. This study was supported by the TOUGOU Program, funded by the Ministry of Education, Culture, Sports, Science, and Technology, of the Government of Japan.
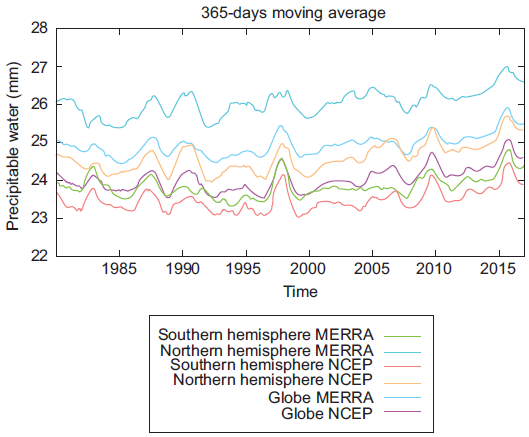
Fig. A1
365-days moving average of precipitable water during 1980-2017 from NCEP/NCAR and MERRA-2 reanalysis. Results correspond to the moving average of precipitable water over the whole globe and the two hemispheres.
Fig. 1
99th percentile of mean daily precipitable water (column integrated) with a 1 mm day–1 threshold as a function of daily mean temperature during 1980-2017 from NCEP/NCAR reanalysis (left panel) and MERRA-2 reanalysis (right panel). Results correspond to the whole globe (magenta), the two hemispheres (northern hemisphere, solid blue, and southern hemisphere, solid red, respectively). The CC relationship (~7% per °C rise in temperature) is used as a reference and shown as dotted lines. Thin lines show the results from different regions within 5° latitudinal bands (18 regions in northern hemisphere [light blue] and 18 regions in the southern hemisphere [light red])
Fig. 2
Rate of change of the 99th percentile of precipitable water events during 1980-2017 from NCEP/NCAR and MERRA-2 reanalysis. Results correspond to the CC scaling from different latitudinal regions with 5° intervals in the two hemispheres.
Fig. A1
365-days moving average of precipitable water during 1980-2017 from NCEP/NCAR and MERRA-2 reanalysis. Results correspond to the moving average of precipitable water over the whole globe and the two hemispheres.
