Decision tree applied in classifying the occurrence of cyber claims in banking sector companies
Árvore de decisão aplicada na classificação de ocorrência de sinistro cibernético em empresas do setor bancário
Árbol de decisión aplicado en la clasificación de la ocurrencia de siniestros cibernéticos en empresas del sector bancario
 Alana Katielli Nogueira Azevedo alanakna@gmail.com
Decision tree applied in classifying the occurrence of cyber claims in banking sector companies
Contextus – Revista Contemporânea de Economia e Gestão, vol. 21, núm. 1, Esp., e83423, 2023
Universidade Federal do Ceará

Esta obra está bajo una Licencia Creative Commons Atribución-NoComercial 4.0 Internacional.
Recepción: 03 Febrero 2023
Aprobación: 10 Abril 2023
Publicación: 17 Octubre 2023
Abstract: The study aimed to predict cyber claims in companies in the banking sector using a decision tree. To this end, 683 cases of cyber losses were extracted from an operational risk database. The independent variables considered in the modeling were the region of domicile, the size of the company and, as main explanatory variable, revenue. The classification reached 89% of global hits. The modeling in question guarantees a good classification quality and better fit when compared to traditional GLM modeling. The results of this work are useful and can act in an innovative way as a tool to support the decision making of insurers, aiming at useful responses to the management of cyber risks.
Keywords: risk management, cyber risk, decision tree, GLM, banking sector.
Resumo: O estudo teve como objetivo a previsão de sinistros cibernéticos em empresas do setor bancário através do uso de árvore de decisão. Para tanto, foram extraídos 683 casos de perdas cibernéticas de um banco de dados de risco operacional. As variáveis independentes consideradas na modelagem foram a região de domicílio, o porte da empresa e, como principal variável explicativa, o faturamento. A classificação apresentou 89% de acertos globais. A modelagem em questão garante uma boa qualidade de classificação e melhor ajuste quando comparada a modelagem tradicional GLM. Os resultados desse trabalho são úteis e podem atuar de forma inovadora como ferramenta de apoio à tomada de decisão das seguradoras, visando respostas úteis ao gerenciamento de riscos cibernéticos.
Palavras-chave: gerenciamento de risco, risco cibernético, árvore de decisão, GLM, setor bancário.
Resumen: El estudio tuvo como objetivo predecir ciber siniestros en empresas del sector bancario utilizando un árbol de decisión. Para ello, se extrajeron de una base de datos de riesgo operacional 683 casos de ciberpérdidas. Las variables independientes consideradas en la modelación fueron la región de domicilio, el tamaño de la empresa y, como principal variable explicativa, los ingresos. La clasificación alcanzó 89% de los hits globales. El modelado en cuestión garantiza una buena calidad de clasificación y un mejor ajuste en comparación con el modelado GLM tradicional. Los resultados son útiles y pueden actuar de forma innovadora como una herramienta de apoyo a la toma de decisiones de las aseguradoras, buscando respuestas útiles a la gestión de los riesgos cibernéticos.
Palabras clave: gestión de riesgos, ciberriesgo, árbol de decisiones, GLM, sector bancario.
1 INTRODUCTION
The digital age has come to definitively transform corporate structures and develop complex information technologies. On the other hand, such an evolution entails vulnerabilities when it comes to cyber threats. Cyber attacks are more and more frequent and can generate financial losses to a very high degree.
According to Allianz (2022), cyber risks are the main concern for companies around the world. Brazil, in the year 2022, ranked second in the ranking of countries that suffered cyber attacks in Latin America, Mexico was the first one, and presenting an increase of 94% compared to the year 2021 (Fortinet, 2022). Hacker attacks, data breaches and system failures are among the main threats. Improving understanding of this type of risk is the current challenge for managers.
When it comes to financial services, these have always been very targeted when talking about fraud. With the advent of new means of payment, increasingly digitized forms of customer/company relationship, possibilities offered by open banking, this sector has become even more attractive to cyber criminals. In this way, vulnerability management becomes essential. Identifying, notifying, analyzing and correcting cybersecurity vulnerabilities are part of this process (Ecotrust, 2023).
Allied to vulnerability management, cyber risk insurance is presented as an option for a risk transfer mechanism. Despite gaining attention in the insurance market, this type of insurance still raises questions regarding financial viability for both the insured and the insurer. Because it is a risk category on the rise, with limited availability of historical data, pricing can sometimes generate inaccurate values (Carfora, 2019).
The data modeling process is a fundamental part of correct pricing in the field of insurance. In contrast to the fact that many studies, including Carfora (2019) and Karam (2014), were conducted to characterize and model cyber risk through traditional approaches such as collective risk theory, loss distribution approach (LDA) and generalized linear models (GLM), this work aims a quantitative modeling using machine learning, more specifically, decision trees, a methodology that develops increasingly effective and efficient algorithms, offering the possibility of increasing understanding on the subject under analysis (Faceli, 2011).
This work proposes an analysis of the frequency (number of occurrences) of cyber risk, using all available information from companies in the banking sector and introducing a decision tree structure capable of identifying whether a given company is subject to cyber claims. The strengths and differentials of this work are: (i) Within the scope of the decision tree methodology, the use of risk classes to compare with the traditional GLM, identifying significant risk classification variables and (ii) The use of real data from a worldwide collection of publicly reported operating losses.
The manuscript is organized as follows. In the next section, a literature review was carried out on the two thematic axes, cyber risk and decision tree. Section 3 is dedicated to presenting the database, as well as describing the decision tree methodology applied for prediction. Section 4 presents and discusses the main results. The last section closes the study with some final considerations.
2 THEORETICAL FRAMEWORK
2.1 Cyber risks
The dependence of companies from different sectors of the economy on technologies, especially those that generate and store valuable information, highlights the need for correct risk management. Among these risks, cyber risk has been gaining prominence and, particularly, financial institutions are increasingly aware of the threats that this type of risk can bring.
According to Dal Moro (2020), cyber risk generally refers to any risk of financial loss, interruption or damage to an organization's reputation, resulting from the failure of its information technology systems. An adequate classification and the choice of a management methodology relevant to this risk class are essential for the mitigation process to be efficient. Studies have been developed in the most varied ways in order to better understand the characteristics of cyber risks.
Peng et al. (2018) developed the first statistical approach, centered on a Copula-GARCH model that uses copulas to model the multivariate dependence exhibited by real-world cyberattack data. Such methodology is characterized by its flexibility in being able to accommodate different dependency structures between different pairs of variables and capacity to estimate a large number of parameters. The results show that the multivariate dependence between cyberattacks has a significant effect on the total loss. The authors showed that ignoring the due multivariate dependency causes a severe underestimation of cybersecurity risks.
Xu and Hua (2019) produced a robust and systematic approach to modeling and pricing cyber risks, studying risks through epidemic models along with loss functions and pricing strategies. The authors used stochastic processes (Markov and non-Markov) to describe the dynamics of an epidemic spread over time. A simulation approach to calculate the cybersecurity risk premium has been implemented for practical use. The effects of different distributions of infection and dependence between infection processes on losses were also studied.
Subroto and Apriyana (2019) presented an algorithmic model that uses social media big data analysis and machine learning to predict cyber risks. Data for the study consisted of 83,015 instances of the database of common vulnerabilities and exposures and 25,599 instances of Twitter cyber risks. Considering artificial neural network and analyzing software vulnerabilities to threats, the experimentation resulted in an accuracy rate for the prediction of claims of 96.73%.
Carfora et al. (2019) pointed out the peculiarities of cyber insurance contracts in relation to classic non-life insurance, both from the perspective of the insurer and the perspective of the insured. The most suitable distributions to represent the frequency (negative binomial) and severity (log-normal) of reported cyber claims are examined and the Value at Risk measure estimated.
Much has been studied about cyber risks, but the lack of data limits the ability of the insurance industry to propose coverage for this type of risk. Marotta et al. (2017) explain that organizations are afraid of disclosing too much information about their internal systems to avoid diminishing their reputation, as well as to avoid leaking knowledge about the weaknesses of the system. For Eling and Schnell (2016), the difficulties to handle cyber risk are immense, especially due to the lack of data and modeling approaches, incalculable accumulation risks and the risk of change that is linked to inadequate resources or budget, resistance to change organizational culture, lack of management support for change, and lack of commitment to change.
2.2 Decision trees
For non-parametric regression problems, decision trees are an extremely popular tool to obtain high-quality predictions (Linero, 2018). The use of such methodology is vast and varied, and can be used in several areas of knowledge. For example, Hamoud et al. (2018) presented a model based on decision tree algorithms to analyze the collective information of higher education students as well as classify the collected data to predict and categorize student performance.
Yuvaraj et al. (2021) created a decision tree model for classifying and identifying texts with characteristics of cyberbullying, an epidemic among young people. Bonini (2016) used a decision tree to extract information from a breast tumor sample database in order to classify them as benign or malignant.
As for the financial sector, research has been carried out with several purposes. The decision tree-based forecasting model proposed by Podhorská et al. (2020) assists in the proper classification of companies that may experience financial difficulties, reaching bankruptcy, under the conditions of emerging markets.
Sousa et al. (2021), applied three types of decision trees to predict invoice payments. The first model aimed to identify invoices with on-time or late payment. The second identified, among the overdue invoices, the payment in the due month or later. The third model, on the other hand, predicted, among the overdue invoices, how many days they would be overdue beyond the due month. The average precision obtained for the three models was 81.85%, 85.63% and 73.98%, respectively.
The article by RL and Mishra (2022) addressed the application of decision tree algorithms to predict the performance of manufacturing companies in an emerging economy. The study uses data from 25 financial variables for a sample of 1,923 Indian manufacturing companies in the period between 2011 and 2018. The results showed that the net profit margin and the total asset turnover rate are the most critical factors that determine the performance of the company in an Indian market. These findings can help managers in their decision-making process and also have vital implications for investors in evaluating the company's performance.
Saha et al. (2023) investigated the issue of predicting the financial performance of registered manufacturing companies in developing countries using machine learning methods. The model had an average ranging from 0.922 to 0.934 for sales forecast. An important and significant independent variable for predicting sales across all categories and algorithms was actual raw material expenditures, explaining approximately 83% to 88% of the total sums of squares across all validations. The dependent variable profits was more difficult to predict in relation to sales. According to the authors, the results of a machine learning approach can improve the understanding of the mechanisms that translate sales into profits.
Sembiring et al. (2021) used decision trees in order to classify customers as likely solvent or insolvent in relation to taking bank credit. For the authors, a good selection of clients is essential for them to be able to pay their debts within the correct period.
The fact of not assuming any particular distribution for the data, of being able to consider both categorical (qualitative) and numerical (quantitative) attributes, of being able to build models for any function as long as the number of training examples is sufficient and of having a high degree of understanding makes the use of decision trees advantageous (Lemos et al., 2005).
3 METHODOLOGICAL PROCEDURES
3.1 Data base
In insurance market and financial sector terms, cyber risk is categorized as operational risk. Karam (2014) defines this category as the risk of loss resulting from inadequate or faulty internal processes, people and systems, or from external events. The enumeration of CRO (2016) helped to guide the identification of cyber risks for this work, namely:
• Any risks arising from the use of electronic data and its transmission, including technological tools such as the internet and telecommunications networks.
• Physical damage that can be caused by cyberattacks.
• Frauds committed by misuse of data.
• Any liability arising from the use, storage and transfer of data.
• The availability, integrity and confidentiality of electronic information (whether related to individuals, companies or governments).
For cyber risk analysis, SAS OpRisk Global Data was used, which is the world's largest collection of publicly disclosed operating losses, organized and provided by the company Statistical Analysis System. The database considered provides information on 26,762 occurrences of operational loss in the period between January 2004 and January 2021. For each occurrence, the database informs, in addition to the amount of the loss, the description of the event, the lines of business and industry sectors, risk category, country of incident (which could be worldwide) and other information about the companies involved. All losses, expressed in US$, are presented at present value, referring to January 2021, for proper comparison.
The present study considered two subcategories for cyber risk: (1) Actions of people and (2) Technical failures of systems. Considering the information from the SAS database with complete records, a total of 683 cyber risk incidents were identified in a set of 2718 companies in the banking sector. The attributes chosen were the region of domicile, the size of the company according to the number of employees and revenue in US$, important determinants of the terms and prices of cyber insurance policies, as highlighted by Biener et al. (2015).
3.2 Prediction using decision trees
Decision trees, through machine learning, offer a range of algorithms that support predictive models for both classification and regression. According to Breiman et al. (2017), the idea is to represent data as a tree where each internal node represents a test on an attribute, each branch represents a test result and each leaf node presents a class label.
The decision tree method is characterized by being non-parametric and supervised. By the definition of Cunningham et al. (2008), supervised learning involves learning a mapping between a set of input variables and an output variable, applying this mapping to predict the outputs for unseen data.
There are two types of decision trees that are defined according to the output variable. When this is a categorical variable, it is a decision tree for classification. When the output variable is continuous, it refers to a decision tree for regression.
Figure 1 presents the basic structure of a decision tree. Each tree has a root node, where entries are passed. This root node is split into sets of decision nodes where results and observations are conditionally based. If a node does not split into more nodes, it is called a leaf node or terminal node. A subsection of a decision tree is called a branch or subtree.
Figure 1.
Decision tree example.
Source: adapted from Vidhya (2021).
The algorithm of a decision tree model will depend on the output variable. In the present study, such variable is categorical, which determines the algorithm to be used for classification. Another important setting is how the data will be split. Split rules influence model optimization and performance.
The division rule chosen to be applied to the decision tree modeled here was the Gini impurity. According to Ruiz-Maya (1978), the purpose of the Gini impurity is to measure the degree of importance of each explanatory variable. In the context of decision trees, such a rule is used to measure the probability of a randomly chosen example being misclassified by a given node. When all elements are correctly divided into different classes, the division is considered pure.
Equation 1 mathematically represents the Gini impurity measure, where pi is the probability that a given element belongs to a specific class.
 (1)
(1)The Gini impurity score concentrates values between 0 and 1. When it is equal to 0, the division is called pure, in this way, all elements belong to a certain class. In case of a value equal to 1, the elements are randomly segregated into different classes.
3.3 Performance measures
One of the forms of representation to verify the performance of the decision tree model is the confusion matrix, since it is a two-class problem. One class is classified as positive (+) and the other as negative (-). The matrix model can be seen in Table 1, where:
• VP corresponds to the number of companies that suffered cyber losses and were classified as such.
• VN corresponds to the number of companies that did not suffer cyber accidents and were classified as such.
• FP corresponds to the number of companies that suffered cyber claims and were classified as companies without claims.
• FN corresponds to the number of companies that did not suffer cyber claims and were classified as companies that suffered claims.
| Predicted values | ||
| Real values | + | - |
| + | VP | FN |
| - | FP | VN |
From the confusion matrix, other measures can be calculated to assess the effectiveness of the decision tree model. In this work, the total error rate, total accuracy, sensitivity and specificity will be calculated.
The total error rate, Equation 2, is represented by the sum of the main diagonal of the confusion matrix, divided by the sum of all matrix elements. Accuracy is the measure that translates the precision of a test (Equation 3).
 (2)
(2)
 (3)
(3)According to Martinez et al. (2003), sensitivity (Equation 4) is the probability that the test under analysis will provide a positive result, that is, it translates the test's ability to identify a company that is suffering a cyber attack. Still according to the author, specificity (Equation 5) is the probability of the test providing a negative result, translating the test's ability to identify a company that does not suffer a cyber attack.
 (4)
(4)
 (5)
(5)4 ANALYSIS AND DISCUSSION OF RESULTS
4.1 Exploratory data analysis
Table 2 provides a summary of the cyber risk sample. Regarding geographic region, Panel B shows that companies in North America have almost half of the incidents (48.9%). Europe comes in second with 25.3%. Despite a higher number of claims in relation to the average value of losses, North America has one of the lowest. For Biener et al. (2015), US companies are more able and willing to invest in risk mitigation measures for extreme losses.
Separating the companies by size based on quantiles, Panel C of Table 2 shows a similarity in the number of claims in each of the categories, despite differences in relation to the average revenue of each group. It is also seen that the chance of having a cyber attack is greater in large companies, with a probability of 50.6%, a much higher percentage when compared to small (14.2%) and medium-sized companies ( 37%).
Still analyzing Panel C, it appears that the average value of claims is very similar for all types of company size. For ClearSale (2022), small and medium-sized companies can be considered easy targets for criminals who seek more agility in scams due to inexperience. This can lead to high losses.
| No. of companies | Average revenue of company (in millions of US$) | No. of companies that suffered cyber claim | Average value of claims(in millions of US$) | |
| Panel A: Full sample | ||||
| Total | 2,718 | 14,974.64 | 683 | 14.16 |
| Panel B: Region of domicile | ||||
| Asia | 592 | 6,012.92 | 106 | 19.05 |
| Europe | 682 | 27,659.09 | 173 | 18.93 |
| North America | 1,230 | 13,951.55 | 334 | 11.77 |
| Other | 214 | 5,222.02 | 70 | 6.32 |
| Panel C: Company size according to the number of employees | ||||
| Small | 1,679 | 1,818.70 | 238 | 15.86 |
| Medium | 592 | 12,024.07 | 219 | 12.15 |
| Large | 447 | 68,298.01 | 226 | 14.31 |
Table 3 shows that, in 89.4% of cases, human behavior is the main source of cyber risk incidents. Theft of information, damage caused by hackers and loss of customer data are some examples. With regard to the average value of claims, the situation is quite different for the two categories. Claims caused by technical system failures generate an additional $34.41 million in losses.
| Generating action of cyber claim | No. of Companies affected | Average revenue of company (in millions of US$) | Average value of Claims (in millions of US$) |
| People actions | 611 | 34 952,63 | 10,53 |
| Technical failures of systems | 72 | 27 211,91 | 44,94 |
Allied to the main objective of this study, which is to predict the occurrence of claims in companies in the banking sector and to better understand the cyber risk category, an additional analysis of the frequency of these claims was carried out. Fitting a probability distribution to monthly data on the number of claims helps in analyzing the probabilistic behavior of this risk. Figure 2 graphically shows, through a box-plot, the distribution of cyber claims in the period considered.
Figure 2
Box-plot representing the frequency of claims.
Source: Developed by the author.
The location of most data at the bottom of the graph is indicative of asymmetry, which determines that the data cannot be normally distributed. Such a representation also helps to identify outliers, data values that are distant from others and that can affect the results. Its representation is performed through asterisks, which was not the case in the present study.
In order to find the best distribution to represent the frequency of claims, the Akaike information criterion (AIC) was considered, a method that allows comparing models with different families of distributions and that does not require further inferences about the model to corroborate its result (Burnham & Anderson, 2004). The best model is the one with the lowest AIC value. For the data analyzed here, the logarithmic distribution (LG) provided the best fit with an AIC of 182.52, in addition to having a statistically significant estimated parameter.
Figure 3 shows the histogram of the fit and the worm plot, which provides a diagnosis of the residuals. The mean and variance of the residuals were -0.34 and 1.71, respectively, which shows a good fit for the LG distribution since such values are not so far from the values of a standard normal distribution.
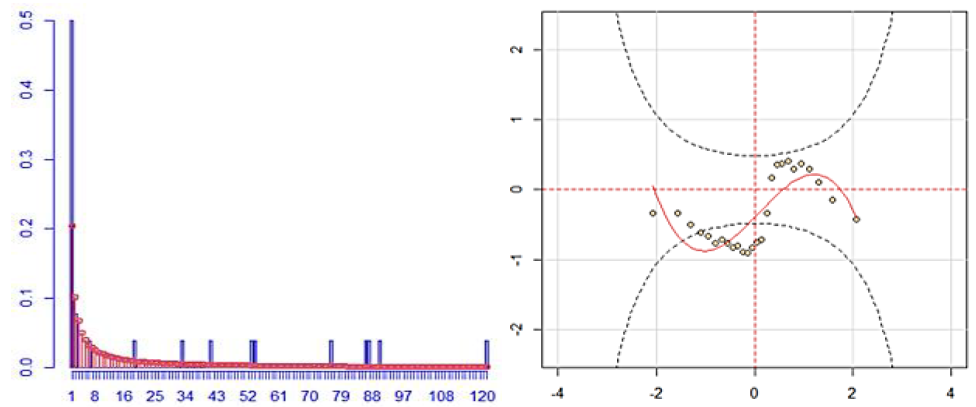
Figure 3.
Histogram and worm plot of the LG distribution fit for claims frequency.
Source: Developed by the author.
The parameter in Table 4 was estimated using the maximum likelihood (ML) method, see Portugal (1995). This information is essential for calculating the expected number of claims, represented by the first moment of the LG distribution, defined by Equation 6.
 (6)
(6)
| Parameter | Estimated value | Standard error | t value | Pr(>|t|) |
| β | 0.9922226 | 0.486406 | 9.96847 | < 2.22e-16 *** |
By substituting the estimated value of parameter β in Equation 1, the total value is 26.3 referring to the expected number of cyber risk claims, considering the monthly occurrence data.
All this information on frequency can guide the process of risk acceptance by insurers, as well as for greater awareness of the cyber risk to which companies are exposed.
4.2 Decision tree modeling
The tree defined the revenue of companies in the banking sector as the main explanatory variable. Next, the company size variable was selected and the third variable was the region of domicile. According to Quinlan (1993), the most important variable is the one with the lowest entropy and the highest information gain. Such importance is evidenced in Figure 4.
Figure 4
Independent variables importance.
Source: Developed by the author.
The classification process carried out with the intention of predicting the occurrence of cyber claims generated the results shown in Table 5, as well as the decision tree shown in Figure 5.
| Predicted values | ||
| Real values | + | - |
| + | 422 | 261 |
| - | 97 | 1938 |
The proportion of total agreement (Accuracy) for the decision tree was 89%. Companies that suffered cyber claims, as well as companies that did not, were correctly classified in 89% of cases.
| Performance measure | Decision tree | GLM |
| Accuracy | 89% | 78% |
| Error | 11% | 22% |
| Sensitivity | 62% | 28% |
| Specificity | 95% | 95% |
According to the results presented in Table 6, it is observed that the decision tree has a sensitivity value of 62% and a specificity of 95%, showing that the model was more efficient in classifying the negative class than the positive one. Despite this percentage difference, there are always advantages in using the decision tree technique, in the sense that it presents results that are easy to understand, detailing which of the information about the analyzed companies was most relevant in the classification (Lemos et al., 2005).
As can be seen, when comparing the decision tree model with the GLM approach, there was a decrease in accuracy resulting in an error with twice the value. The sensitivity rate decreased to 28%, while the specificity reached the same level of 95%. Such values indicate that the implemented GLM is very good at classifying patterns belonging to the negative class, but lost efficiency for data from the positive class.
The difference in performance between the two methodologies can be explained by also considering the fact that in the GLM models it is necessary to choose a particular distribution of the exponential family for the response variable (Pekár & Brabec, 2017). From the adjustment made in section 3.1, it is clear that it is impossible to use GLM to analyze the data on the frequency of cyber claims presented here, as the logarithmic distribution is highlighted as the best adherence.
The fact is that the use and study of decision trees can be opportune to assist in solving the presented problem.
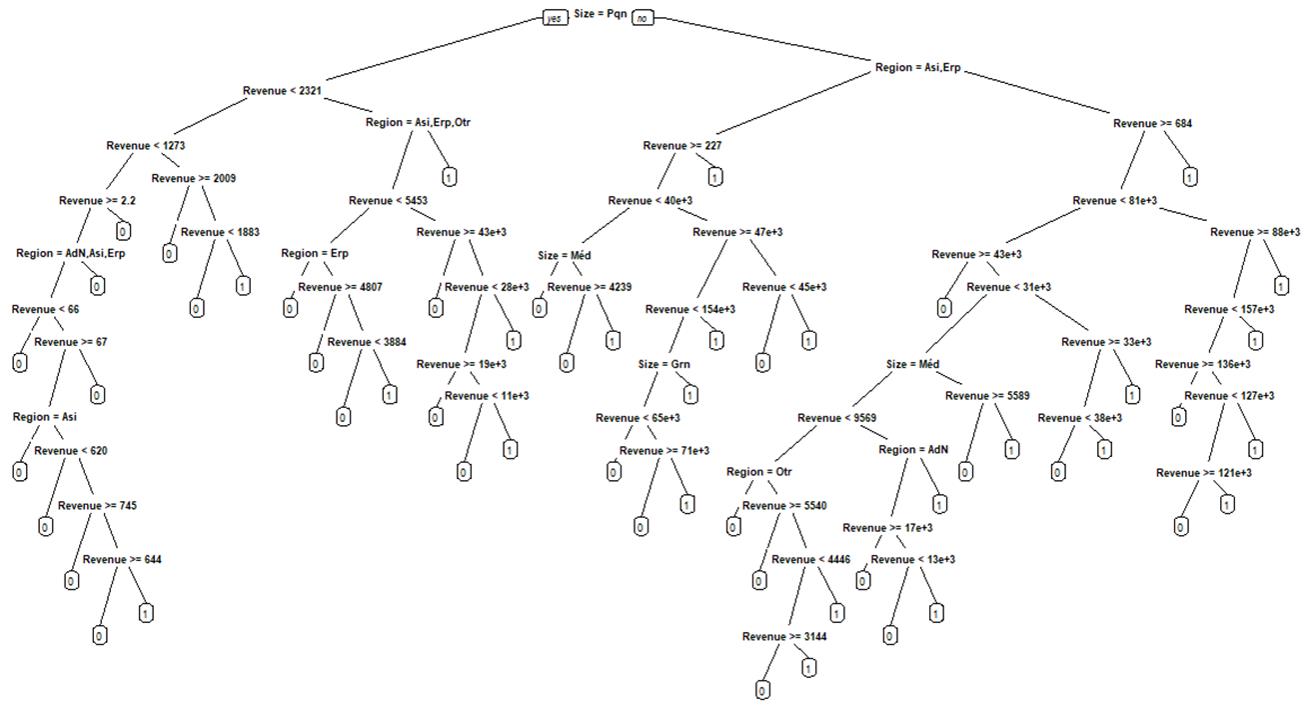
Figure 5
Decision tree model for interpretation.
Source: Developed by the author.
5 CONCLUSIONS
The present study highlights the potential of the technique of inducing decision trees to classify cases of occurrence and non-occurrence of cyber claims in companies in the banking sector and to identify the importance of associated variables from a worldwide database. The results of the classification using a decision tree trained algorithm showed 89% global success. Using company registration information, insurers are able to diagnose new companies in relation to the possibility of cyber attacks.
In addition, when compared with the traditional GLM modeling, the decision tree methodology provided a better fit when verifying an error percentage of 11%, half of the percentage achieved by the GLM. Regarding sensitivity, the percentage difference was even greater. While the decision tree correctly classified 62% of the companies, the GLM reached only 28%.
In this sense, it is understood that the modeling in question guarantees a good classification quality in relation to the data used, allowing the values presented by it to act in an innovative way as a support tool for the insurers' decision-making, aiming at useful answers to the management of cyber risks. An important part of the pricing process is to identify all the characteristics that allow predicting the amount of future claims and to select policyholders well, charging lower premiums for lower risk groups and higher premiums for higher risk groups. Since there are few studies that encompass the problem presented here, it is expected that the present study will encourage further discussions about the correct estimation of the risk that can be potentially harmful economically.
REFERENCES
Allianz. (2022). 11º Allianz Risk Barometer 2022. https://www.abtra.org.br/inovacao-e-tecnologia/11o-allianz-risk-barometer-2022/
Biener, C., Eling, M., & Wirfs, J. H. (2015). Insurability of cyber risk: An empirical analysis. The Geneva Papers on Risk and Insurance-Issues and Practice, 40, 131-158. https://doi.org/10.1057/gpp.2014.19
Bonini, J. A. (2016). Aplicação de algoritmos de árvore de decisão sobre uma base de dados de câncer de mama. Revista ComInG-Communications and Innovations Gazette, 1(1), 57-67. https://doi.org/10.5902/2448190421132Breiman, L., Friedman, J. H., Olshen, R. A., & Stone, C. J. (2017). Classification and regression trees. New York: Routledge.
Burnham, K. P. and Anderson, D. R. (2004). Multimodel inference: understanding aic and bic in model selection. Sociological methods & research, 33(2), 261-304. https://doi.org/10.1177/0049124104268644
Carfora, M., Martinelli, F., Mercaldo, F., & Orlando, A. (2019). Cyber risk management: An actuarial point of view. Journal of Operational Risk, 14(4). https://doi.org/10.21314/JOP.2019.231
ClearSale (2022). Mapa da fraude 2022.https://br.clear.sale/mapa-da-fraude
CRO. (2016). Forum concept paper on a proposed categorisation methodology for cyber risk. https://www.thecroforum.org
Cunningham, P., Cord, M., & Delany, S. J. (2008). Supervised learning. In M. Cord & P. Cunningham (Eds.), Machine learning techniques for multimedia (pp. 21-49). Berlin: Springer.
Dal Moro, E. (2020). Towards an economic cyber loss index for parametric cover based on IT security indicator: A preliminary analysis. Risks, 8(2), 45. https://doi.org/10.3390/risks8020045
Ecotrust. (2023). Gestão de vulnerabilidades na área financeira: por que se preocupar?https://blog.ecoit.com.br/gestao-de-vulnerabilidades-na-area-financeira/
Eling, M., & Schnell, W. (2016). What do we know about cyber risk and cyber risk insurance?. The Journal of Risk Finance, 17(5), 474-491. https://doi.org/10.1108/JRF-09-2016-0122
Faceli, K., Lorena, A. C., Gama, J., & Carvalho, A. C. P. D. L. F. D. (2011). Inteligência artificial: uma abordagem de aprendizado de máquina. Rio de Janeiro: LTC.
Fortinet. (2022). Brasil é o segundo país que mais sofre ataques cibernéticos na América Latina.https://www.fortinet.com/br/corporate/about-us/newsroom/press-releases/2022/brasil-e-o-segundo-pais-que-mais-sofre-ataques-ciberneticos-na-a
Gai, K., Qiu, M., & Elnagdy, S. A. (2016, April). Security-aware information classifications using supervised learning for cloud-based cyber risk management in financial big data. In 2016 IEEE 2nd International Conference on Big Data Security on Cloud (BigDataSecurity), IEEE International Conference on High Performance and Smart Computing (HPSC), and IEEE International Conference on Intelligent Data and Security (IDS), 197-202. New York, United States of America.
Hamoud, A., Hashim, A. S., & Awadh, W. A. (2018). Predicting student performance in higher education institutions using decision tree analysis. International Journal of Interactive Multimedia and Artificial Intelligence, 5, 26-31. https://doi.org/ 10.9781/ijimai.2018.02.004
Karam, E. (2014). Measuring and managing operational risk in the insurance and banking sectors (Doctoral dissertation, Université Claude Bernard-Lyon I).
Lemos, E. P., Steiner, M. T. A., & Nievola, J. C. (2005). Análise de crédito bancário por meio de redes neurais e árvores de decisão: uma aplicação simples de data mining. Revista de Administração-RAUSP, 40(3), 225-234.
Linero, A. R. (2018). Bayesian regression trees for high-dimensional prediction and variable selection. Journal of the American Statistical Association, 113(522), 626-636. https://doi.org/10.1080/01621459.2016.1264957
Marotta, A., Martinelli, F., Nanni, S., Orlando, A., & Yautsiukhin, A. (2017). Cyber-insurance survey. Computer Science Review, 24, 35-61. https://doi.org/10.1016/j.cosrev.2017.01.001
Martinez, E. Z., Louzada-Neto, F., & Pereira, B. D. B. (2003). A curva ROC para testes diagnósticos. Caderno saúde coletiva, 11, 7-31.
Pekár, S., & Brabec, M. (2018). Generalized estimating equations: A pragmatic and flexible approach to the marginal GLM modelling of correlated data in the behavioural sciences. Ethology, 124(2), 86-93. https://doi.org/10.1111/eth.12713
Peng, C., Xu, M., Xu, S., & Hu, T. (2018). Modeling multivariate cybersecurity risks. Journal of Applied Statistics, 45(15), 2718-2740. https://doi.org/10.1080/02664763.2018.1436701
Podhorská, I., Vrbka, J., Lazaroiu, G., & Kovacova, M. (2020). Innovations in financial management: Recursive prediction model based on decision trees. Marketing and Management of Innovations, 3, 276-292. https://doi.org/10.21272/mmi.2020.3-20
Portugal, M. S. (1995). Notas introdutórias sobre o princípio de máxima verossimilhança: Estimação e teste de hipóteses. DECON/UFRGS, Porto Alegre, Abril.
Quinlan, J. R. (1993). C4.5: Programs for Machine Learning. São Francisco: Morgan-Kaufmann.
Sembiring, N. S. B., Sinaga, M. D., Ginting, E., Tahel, F., & Fauzi, M. (2021, September). Predict the Timeliness of Customer Credit Payments at Finance Companies Using a Decision Tree Algorithm. In 2021 9th International Conference on Cyber and IT Service Management (CITSM), Bengkulu, Indonesia.
RL, M., & Mishra, A. K. (2022). Measuring financial performance of Indian manufacturing firms: application of decision tree algorithms. Measuring Business Excellence, 26(3), 288-307. https://doi.org/10.1108/mbe-05-2020-0073
Ruiz-Maya, L. (1978). Sobre la metodología del Índice de Gini. Universidad Autónoma de Madrid. https://repositorio.uam.es/bitstream/handle/10486/5861/36175_6.pdf?sequence=1
Saha, D., Young, T. M., & Thacker, J. (2023). Predicting firm performance and size using machine learning with a Bayesian perspective. Machine Learning with Applications, 11, 100453. https://doi.org/10.1016/j.mlwa.2023.100453
Sousa, A. F., Neto, Silva, J. F. G., & Oliveira, G. N. (2021). Predição de Pagamentos Atrasados Através de Algoritmos Baseados em Árvore de Decisão. Revista de Engenharia e Pesquisa Aplicada, 6(5), 1-10. https://doi.org/10.25286/repa.v6i5.1746
Subroto, A., & Apriyana, A. (2019). Cyber risk prediction through social media big data analytics and statistical machine learning. Journal of Big Data, 6(1), 1-19. https://doi.org/10.1186/s40537-019-0216-1
Vidhya, A. (2021). Tree Based Algorithms: A Complete Tutorial from Scratch (in R & Python).https://www.analyticsvidhya.com/blog/2016/04/tree-based-algorithms-complete-tutorial-scratch-in-python/
Xu, M., & Hua, L. (2019). Cybersecurity insurance: Modeling and pricing. North American Actuarial Journal, 23(2), 220-249. https://doi.org/10.1080/10920277.2019.1566076
Yuvaraj, N., Chang, V., Gobinathan, B., Pinagapani, A., Kannan, S., Dhiman, G., & Rajan, A. R. (2021). Automatic detection of cyberbullying using multi-feature based artificial intelligence with deep decision tree classification. Computers & Electrical Engineering, 92. https://doi.org/10.1016/j.compeleceng.2021.107186