Automatización y Control, Mecatrónica, Electromecánica, Automotriz
Effect of the filling percentage on tensile strength in 3D desktop printing for different printing patterns, using a randomized design of experiments
Efecto del porcentaje de relleno en la resistencia a la tracción en la impresión de escritorio 3D para diferentes patrones de impresión, utilizando un diseño aleatorio de experimentos
Effect of the filling percentage on tensile strength in 3D desktop printing for different printing patterns, using a randomized design of experiments
Enfoque UTE, vol. 10, no. 4, pp. 13-27, 2019
Universidad Tecnológica Equinoccial

This work is licensed under Creative Commons Attribution 4.0 International.
Received: 12 August 2019
Accepted: 19 November 2019
Abstract: The evaluation of the tensile strength of printed parts by means of fused deposition modeling (FDM) or fused filament fabrication (FFF) is essential, since parts whose resistance does not differ significantly depending on the percentage of filling used can be obtained, optimizing the use of the material. The present work details the analysis of polylactic acid (PLA) specimens manufactured according to ASTM D 638 with different percentages for the most commonly used filling patterns (Honeycomb, Octagram, Stars, Archimedean, Hilbert and Triangles). With the help of an analysis of variance and a design of experiments with a single factor, the appropriate percentages for printing parts according to the desired filling pattern are obtained.
Keywords: 3D printing, Filling percentage, Filling pattern, PLA, Stress.
Resumen: La evaluación de la resistencia a la tracción de las piezas impresas mediante el modelado por deposición fundida (FDM) o la fabricación de filamentos fundidos (FFF) es esencial, ya que se pueden obtener piezas cuya resistencia no difiere significativamente dependiendo del porcentaje de relleno utilizado, optimizando el uso del material. El presente trabajo detalla el análisis de muestras de ácido poliláctico (PLA) fabricadas de acuerdo con ASTM D 638 con diferentes porcentajes para los patrones de relleno más comúnmente utilizados (Panal, Octagrama, Estrellas, Archimedean, Hilbert y Triángulos). Con la ayuda de un análisis de varianza y un diseño de experimentos con un solo factor se obtienen los porcentajes apropiados para imprimir piezas de acuerdo con el patrón de llenado deseado.
Palabras clave: impresión 3D, porcentaje de relleno, patrón de relleno, PLA, estrés.
1. Introduction
The 3D printing started in the 70’s with the technological revolution started by Steve Jobs with the Apple brand and, at the same time, when Charles W. Hull invented a method of stereolithography (SLA) that was used for the production of mockups; this method is the prologue for the creation of 3D printers.
Currently, applications in this research area have increased, obtaining prototypes for the simulation of surgical interventions, production rehabilitation prosthesis, among others. (Ordoñez-Alemán, 2017). Funding modeling allows consumers to become creators, especially in the case of professionals. For example, an electronic engineer can create his own housings for the electronic equipment that he develops; an architect can create his models; a traumatologist can create and develop prosthesis; a mechatronic can create his robot prototypes, machines, parts, mechanisms, converting 3D printers in tools that make real any object your creativity designs (Díaz Abad, 2016).
3D printers have the ability to make parts with different fill patterns, depending on the model and brand of the printer. However, these characteristics are rarely used properly since they are usually only limited to printing parts in the shortest time and with the least use of raw material (PLA) with 0 % filler, regardless of tensile strength of the final piece. In other cases, its used to print parts with 100 % fill printing, overriding the fill pattern setting. To determine the appropriate filling percentage, specimens are manufactured under ASTM D638 to be tested in order to obtain their maximum breaking strength, a variance analysis and a completely randomized block design with five treatments and three repetitions; this method doesn’t considers the existence of a factor almost always unknown and hardly controllable, as the weather conditions during the test. With Basic Manual of the IBM SPSS Statistics software (González, 2009), the dedicated mathematical models for the type of analysis implemented are processed and the variability factor is compared with that obtained from Fisher's F table (Polished, 2012) in 95 % desired reliability function.
The work was based on research of Haid (2014), which considered rectilinear patterns, in both ABS and PLA, and the study by Álvarez, Lagos & Aizpun (2016), which studied hexagonal patterns in ABS, establishing the appropriate filling percentages based on Tensile strength Globally; the growth that 3D printing has experienced projects a growth of 184 % by 2021. In Ecuador this phenomenon is in full development due to the accessibility of this technology, but at the time of manufacturing parts there are uncertainties related to the configuration of the print parameters and the possibility to obtain a good tensile strength in the manufactured parts.
The results obtained in previous investigations are taken as starting parameters, but articulated to the prevailing atmospheric conditions in the city of Quito-Ecuador for six different filling patterns with PLA, with the purpose of contributing with 3D printing configuration parameters in our environment , which allow a good tensile strength compared to a solid piece, optimizing the use of material and printing time.
2. Materials and methods
This research takes into account that the unknown factor will directly influence the process. It will not be possible to have a complete control over the environment in which the specimens are printed, nor the weather conditions during the test. Within the design of completely randomized experiments (Montgomery, 2004) a null hypothesis is proposed: "The percentages and fill patterns have no relation to their tensile strength"; and an alternative hypothesis: "The fill percentages and patterns are directly related to the tensile strength of the specimens” to reach the best number of the filling percentage depending on the printing pattern used. The reliability for this study is 95 % and two study groups were considered: Group 1, with the patterns Hilbert, Triangular and Archimedean; Group 2, with the Stars, Honeycomb and Octagram patterns, with fill percentages shown in Table 1.
| Pattern | Number of specimens manufactured and tested | Fill Percentages (Treatments) |
| Hilbert | 15 | 25,40,60,80, 90 |
| Triangular | 15 | 25,40,60,80, 90 |
| Archimedean | 15 | 25,40,60,80, 90 |
| Stars | 15 | 30,40,60,80,90 |
| Honeycomb | 15 | 30,40,60,80,90 |
| Octagram | 15 | 30,40,60,80,90 |
| TOTAL | 90 |
Distribution of specimens according to the filling pattern
Table 1The chosen treatments for each group are based on the work carried out by Haid (2014) and Álvarez, Lagos & Aizpun (2016) who studied rectilinear and hexagonal patterns.
2.1 Characterization of PLA test specimens
The 3D printing of the specimens was done on the Prusa i3 MK2S printer, that has the technical features listed in table 2.
| Print Area | (250 x 210 x 200) mm |
| Nozzle size | 0.4 mm for 1.75 mm filament |
| Layer height | since 0,05 mm |
| Compatible materials | PLA, ABS, PET, HIPS, Flex |
| PLA extrusion temperature (min) | 180°C |
Technical features of Prusa i3 MK2S
The most used material in 3D printing is the polylactic acid (PLA), which has similar properties to PET (Polyethylene Terephthalate), which is also used for beverage packaging. According to its properties, this material is used in many different industries such as food, chemical, plastic, textile, among others. The mechanical and physical properties of the PLA filament used as raw material are listed in Table 3. It must be considered that, at the time of PLA specimens manufacturing, the properties of the material may vary according to the color in which the tests are carried out (Wittbrodt & Pearce, 2015); for this study, a green color was used with the patterns corresponding to the group 1; the red color was used for the patterns corresponding to group 2.
| Tensile strength | 65 MPa |
| Viscosity | 0.61 - 8.2 dL/g |
| Tension Module | 3 - 4 GPa |
| Density | 1.241 g/cm3 |
Physical and mechanical properties of PLA filament (ESUN)
According to Castillo, Loor, Muñoz, Naranjo, Padrón & Peralta (2016), the traction machine to be used complies with the ASTM D3039 design standard and has the technical features presented in the table 4; this machine allows to obtain the mechanical resistance to the traction of the PLA filament specimens, using the stress-strain graph according to Escobar & Escobar (2018).
| Supply source | 120/220 VAC |
| Power | 360 W |
| Range Temperature | (5 - 40) °C |
| Maximum Humidity | Up to 85 % (non condensing) |
| Load cell | 100 Kg (980 N) |
Technical specifications of tensile machine.
It is important to consider the conditions in which the specimens were printed and the tensile test is performed, as presented in Table 5. Three specimens of each percentage and fill pattern are printed following the research of Cazañas, San Miguel & Parra (2017), which indicates the appropriate sample size to perform such an analysis.
| Altitude | 2978 a.s.l. |
| Pressure | 717.39 mbar |
| Environmental Temperature | 13 °C - 24 °C |
| Humidity | 30 % - 45 % |
Environmental conditions during the test
With the data obtained from the environment conditions and the technical specifications to be used, the specimens are sized to perform the stress tests. According to Navas, Reyes & Galván (2015), for any analysis involving the production of material an attempt should be made to prevent the environmental impact through recycling or technological improvements; in this case, all the material tested can be recycled.
2.2 Sizing and sketching of PLA specimens
The specimens of plastic materials fit to ASTM D638 (2008) type IV, for specimens with thicknesses less than or equal 4 mm, where the measures are established to be tested.
The specimen is sized in the Solidworks 2018 CAD software that, according to Juiña, Cabrera & Reina (2017), has a higher rating respect to others (see Figure 1). Once the drawing in 3D it’s saved in * .STL format to be processed in the software Slic3r PE of the manufacturer of the 3D printer, the configuration of the type and percentage of filling begins.
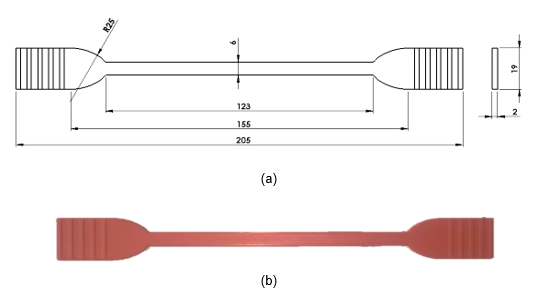
Figure 1
Figure 1.
General dimensions of the 3D specimens printed in PLA (thickness: 2 mm) (a) CAD model (b) 3D print
Figure 2 shows the different types of infill patterns used in the present investigation: Archimedean (A), Hilbert Curve (B), Triangular (C), Honeycomb (D), Octagram (E) and Stars (F)
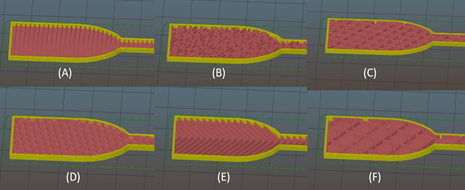
Figure 2
Figure 2.
3D printing of different pattern types (Allevi, 2014)
A small part of the printing of specimens with the Archimedean, triangular, Honeycomb and Octagram patterns is presented on figure 3.
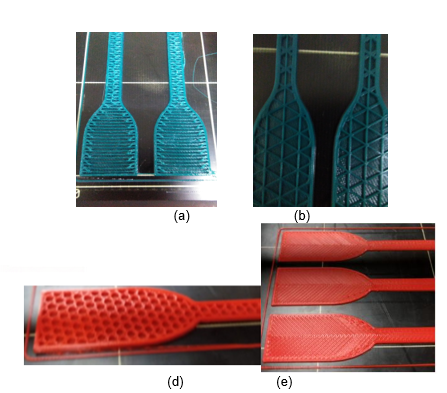
figure 3
Figure 3.
Printed specimens (a) Archimedean with 60 % infill (b) Triangular with 40 % infill (c) Honeycomb with 80 % infill (e) Octagram with 70 % infill
3. Results
To identify values that differ or aren’t significantly from each other, the analysis of variance of a completely randomized block design is carried out by means of Table 6 (Montgomery, 2004), using the data obtained by the tensile test; subsequently, with the SPSS Statistics software, validation tests of the statistical data are carried out to verify the information obtained and find the Fisher value calculated .
| Source of variation | Sum of squares | Freedom Degrees | Middle square(M) | |
| Treatments | -1 | ()/(-1) | M/M | |
| Error | (-1)(-1) | ()/(-1)(-1) | - | |
| Total | -1 | - | - |
Variance for a completely randomized block design
Treatment equations for the sum squares (1), total (2) and error (3) are presented based on the mechanical strength data of the three repetitions in all the analyzed treatments (patterns, fill percentages and number of repetitions), located as shown in Table 7
| Blocks | ||||||
| Treatments | 1 | 2 | 𝑗 | 𝐽 | ||
| 1 | ||||||
| 2 | ||||||
| 𝑖 | ||||||
| 𝐼 | ||||||
Fully randomized block design (Pérez, 2014)
Where
: Sum of treatment squares
: Column position
: Row position
: Total rows
: Value according to row
: Sum of all the values obtained in the tests
: Multiplication of total columns by total rows
Where
: Sum of the squares of the total
: Total rows
: Total columns
: Row position
: Column position
: value according to row and column
: Sum of all the values obtained in the tests
: Multiplication of total columns by total rows
Where
: Sum of error squares
: Sum of squares of the total
: Sum of treatment squares
The tensile test of the specimens with patterns and percentages of filling is carried out; the data obtained by the test is presented in Tables 8, 9, 10, 11, 12 and 13, while in Figures 4, 5, 6, 7, 8 and 9 the data is displayed graphically. It is taken into account that the test specimens can be used for additional studies within the same analysis, considerably reducing the cost of the study (Tamayo, Pazmiño, Valencia, Galván & Batista, 2015).
Table 8 shows the tensile strength values of the specimens with an Archimedean pattern.
| Treatments | Specimen 1 | Specimen 2 | Specimen 3 |
| 25 % | 20,505 | 19,985 | 20,072 |
| 40 % | 28,519 | 28,148 | 28,460 |
| 60 % | 29,465 | 30,572 | 29,307 |
| 80 % | 24,366 | 24,957 | 24,475 |
| 90 % | 27,018 | 27,957 | 24,475 |
Tensile strength (Mpa) of specimens with an Archimedean pattern
Figure 4 shows the values of table 8 in graphical form; it is evident that the highest tensile strength occurs with a 60 % fill.
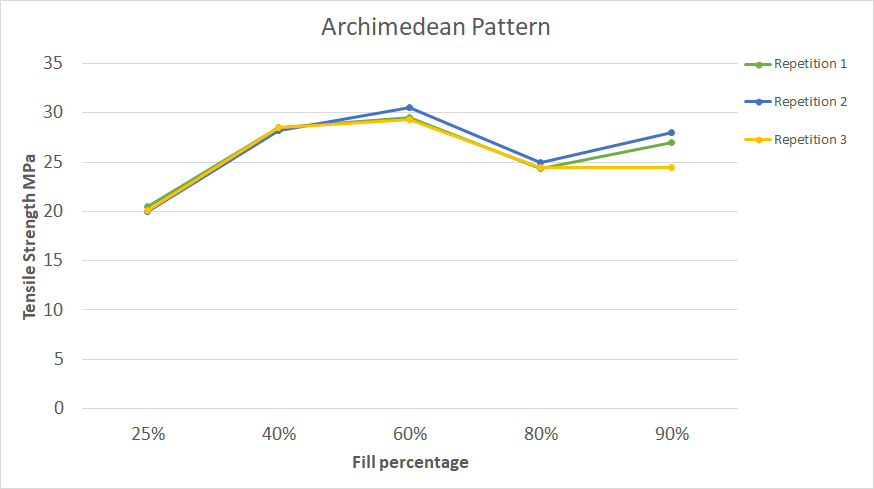
Figure 4
Figure 4.
Graphical representation of the data in table 8
Table 9 shows the tensile strength values of the specimens with a Hilbert curve pattern.
| Treatments | Specimen 1 | Specimen 2 | Specimen 3 |
| 25 % | 22,433 | 23,001 | 23,101 |
| 40 % | 27,837 | 27,812 | 27,494 |
| 60 % | 33,772 | 33,412 | 33,800 |
| 80 % | 33,578 | 31,055 | 36,938 |
| 90 % | 26,576 | 26,621 | 26,601 |
Tensile strength (Mpa) of specimens with Hilbert curve pattern
Figure 5 shows the values of table 9 in graphical form;; it is evident that the highest tensile strength occurs with an 80 % fill.
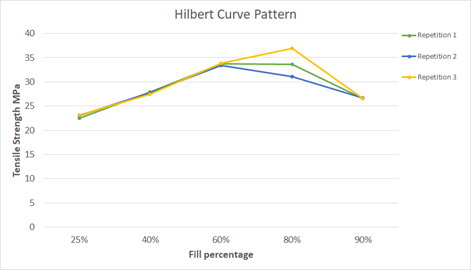
Figure 5
Figure 5.
Graphical representation of the data in table 9
Table 10 shows the tensile strength values of the specimens with a Triangular pattern.
| Treatments | Specimen 1 | Specimen 2 | Specimen 3 |
| 25 % | 31,274 | 31,249 | 31,575 |
| 40 % | 25,618 | 25,905 | 25,551 |
| 60 % | 45,065 | 43,840 | 45,724 |
| 80 % | 39,279 | 43,185 | 39,823 |
| 90 % | 31,196 | 31,223 | 31,271 |
Tensile strength (Mpa) of specimens with Triangular pattern
Figure 6 shows the values of table 10 in graphical form;; it is evident that the highest tensile strength occurs with a 60 % fill.
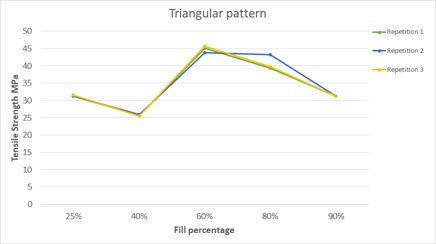
Figure 6
Figure 6.
Graphical representation of the data in table 10
Table 11 shows the tensile strength values of the specimens with a Honeycomb pattern.
| Treatments | Specimen 1 | Specimen 2 | Specimen 3 |
| 30 % | 25,650 | 19,206 | 15,852 |
| 40 % | 43,348 | 52,780 | 65,667 |
| 60 % | 52,639 | 40,350 | 50,258 |
| 80 % | 29,990 | 27,561 | 31,368 |
| 90 % | 30,358 | 32,220 | 32,416 |
Tensile strength (MPa) of specimens with Honeycomb pattern
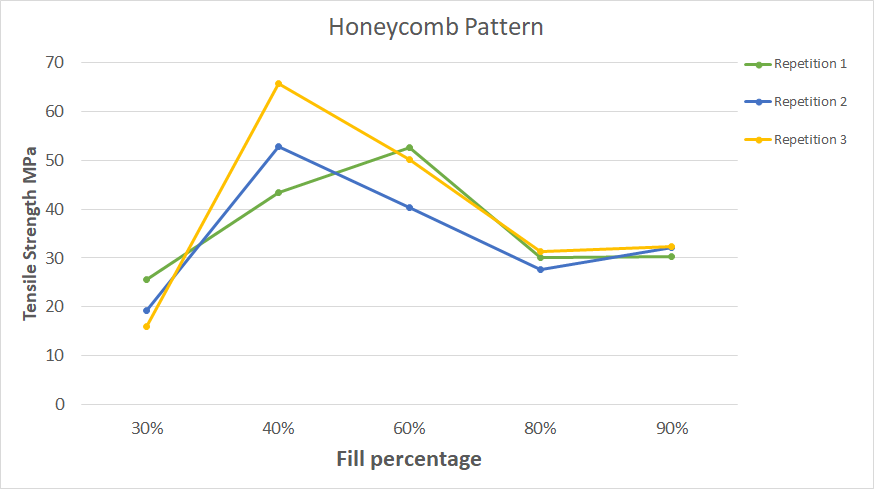
Figure 7
Figure 7.
Graphical representation of the data in table 11
Table 12 shows the tensile strength values of the specimens with an Octagram pattern.
| Treatments | Specimen 1 | Specimen 2 | Specimen 3 |
| 30 % | 32,223 | 27,314 | 21,159 |
| 40 % | 13,583 | 20,437 | 16,548 |
| 60 % | 14,233 | 16,406 | 18,739 |
| 80 % | 24,598 | 29,770 | 26,013 |
| 90 % | 30,208 | 25,360 | 27,254 |
Tensile strength (Mpa) of specimens with Octagram pattern
Figure 8 shows the values of table 12 in graphical form; it is evident that the highest tensile strength occurs with a 30 % fill.
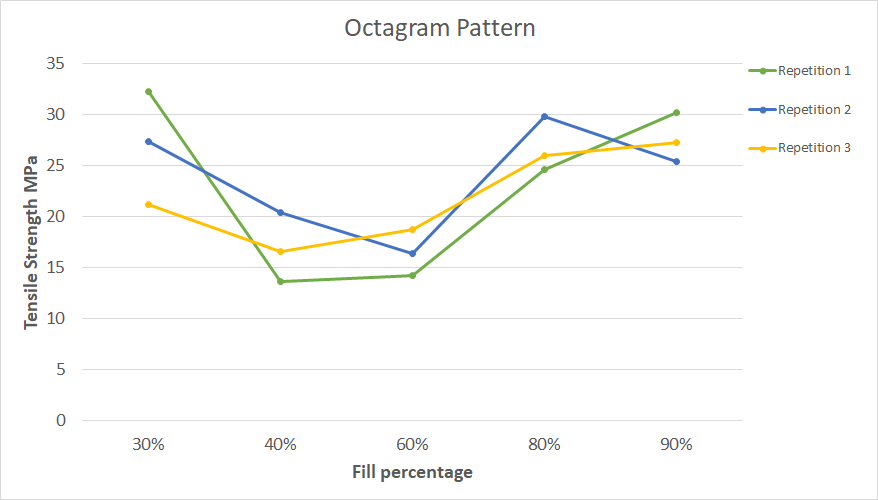
Figure 8
Figure 8.
Graphical representation of the data in Table 12
Table 13 shows the tensile strength values of the specimens with a Stars pattern.
| Treatments | Specimen 1 | Specimen 2 | Specimen 3 |
| 30 % | 24,050 | 24,452 | 24,965 |
| 40 % | 24,014 | 24,201 | 23,322 |
| 60 % | 20,618 | 21,360 | 19,517 |
| 80 % | 25,493 | 22,647 | 27,835 |
| 90 % | 24,997 | 26,406 | 29,815 |
Tensile strength (Mpa) of specimens with Stars pattern
Figure 9 shows the values of table 13 in graphical form; it is evident that the highest tensile strength occurs with a 90 % fill.
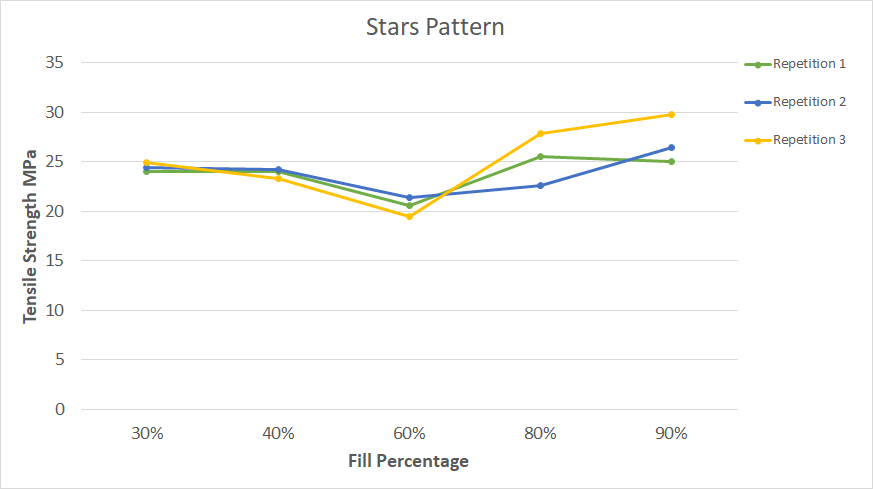
Figure 9
Figure 9.
Graphical representation of the data in table 13
The variance analysis for triangular pattern is performed in the IBM statistics SPSS software, and the results are presented in the table 14; the work with the other patterns proposed in the present study are developed in a similar way. Chart 15 shows the results of the triangular pattern obtained on SPSS Statistics software.
| Sum of squares | Degrees of freedom | Middle square (M) | F | Sig. | |
| Between groups | 733,785 | 4 | 183,489 | 167,992 | .000 |
| Within groups | 10,920 | 10 | 1,092 | - | - |
| Total | 744,677 | 14 | - | - | - |
ANOVA result using the SPSS Statistics software for the triangular pattern
Finally, a statistical summary is presented using means graphs of each type filled; these graphs are presented in figures 10, 11 and 12.
Figure 10 shows the statistical means obtained for the Archimedean patterns and Hilbert curves.
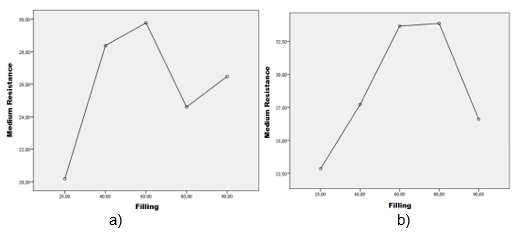
Figure 10
Figure 10.
Statistical summary patterns: (a) Archimedean and (b) Hilbert
Figure 11 shows the statistical means obtained for the Triangular and honeycomb patterns.
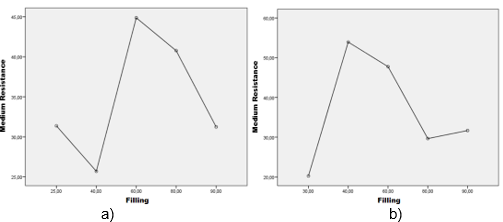
Figure 11
Figure 11.
Statistical summary patterns: (a) Triangular and (b) Honeycomb
Figure 12 shows the statistical means obtained for the Octagram and Stars patterns.
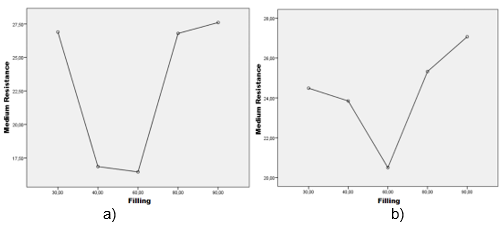
Figure 12
Figura 12.
Statistical summary patterns: (a) Octagram and (b) Stars
In the ANOVA results showed in Table 14, it was determined that the null hypothesis raised is rejected and the alternative hypothesis, “the percentages and filling patterns are directly related to the tensile strength of the specimens”, is accepted, with in a 95 % confidence. In addition, using the Tukey statistical test, it was determined that filling percentages do not differ significantly, choosing the lowest for each filling pattern as the most appropriate to guarantee good tensile strength with the least use of material, as presented in Table15.
| Pattern | Percentage |
| Archimedean | 40 % |
| Hilbert | 40 % |
| Triangular | 25 % |
| Octagram | 30 % |
| Honeycomb | 40 % |
| Stars | 30 % |
Recommended percentages of filling according to the pattern used
for an acceptable mechanical tensile strength with 95 % confidence
4. Discussion
The experimental tensile tests on PLA specimens reflect a similar behavior in terms of percentage of filling and type of pattern. According to Haid (2014), a graph of means between the two mentioned considerations, approximately in a range between 20 to 30 %, of a rectilinear filling pattern, does not have a significant difference respect to a 100 % test that, according to Fernández, Calle, Ferrandiz & Conejero (2016), has a similar value. It should be noted that in this research 6 different types of filling are compared. Choosing an optimal percentage for each one of them relates to their tensile strength.
According to Álvarez, Lagos & Aizpun (2016), comparisons are made between tensile strength, fill percentage and printing time, where the information is related to the average tensile strength and various fill percentages of the hexagonal pattern; by visual inspection it is determined that there is no significant difference between approximately 25 and 40 %. It also ensures that the printing time is shorter if the fill percentage decreases.
According to Molina, Pender, Moro & Piovan (2018), when setting the temperature conditions when it is printing, it is possible to obtain the maximum creep resistance. By means of thermofluence tests they conclude that when stresses greater than 20 MPa are applied, significant decreases are evidenced of mechanical resistance; however, the atmospheric conditions must be considered, so that the mechanical properties obtained are met.
The percentages obtained for each filling pattern studied in the city of Quito are in ranges from 25 % to 40 % for specimens made with PLA, depending on the pattern used. The alternative hypothesis is confirmed: "the tensile strength if it depends on the percentage of filling" and the value of the tensile strength corresponding to the identified percentage does not differ significantly with the high value of tensile obtained in the respective tests.
5. Conclusions and Recommendations
With this research it is possible to compare results between several types of 3D printing patterns, as well as different fill percentages. And by means of a variance analysis, the appropriate fill percentages have been determined for the conditions stipulated in the study and for each analyzed pattern.
The data obtained from ultimate tensile strength may differ from other tests due to the type of 3D printer, the printing parameters, as well as the weather conditions and even the brand of the filament used, both for printing of the specimens and for the test of these; however, the statistical procedure performed will allow to determine the appropriate percentages based on the tensile strength obtained.
The use of Octagram, Triangular and Star patterns within the conditions presented in the investigation (Table 15) to reduce the use of material in prints without damaging their tensile strength it is recommended.
6. Collaborations
The following people supported and contributed during the stress tests carried out in this work: Juan Ullauri, Lenin Pasaca, Stefano Buitrón, Eduardo Urresta, Ángel Enriquez, David Racines, Mauricio González, Martín Flor and Estefanía Suasti.
References
Alvarez, K., Lagos R., y Aizpun, M. (2016). Influencia del porcentaje de relleno en la resistencia mecánica en impresión 3D, por medio del método de Modelado por Deposición Fundida (FDM), vol 24, p.8. Ingeniare. Revista Chilena de Ingeniería.
ASTM D3039. (2008). Standard test method for tensile properties of polymer matrix composite materials. ASTM International, West Conshohocken, PA. doi: 10.1520/D3039_D3039M-17
ASTM D638-14. (2014). Standard test method for tensile properties of plastics. ASTM International, West Conshohocken, PA. doi: 10.1520/D0638-14
ALLEVI. (2014). Infill Options on Slic3r. Recuperado de https://allevi3d.com/build-with-life/infill-slic3r (accedido el 09/07/2019).
Castillo, E., Loor, O., Muñoz, C., Naranjo, C., Padrón, D., y Peralta, D. (2016). Diseño y construcción de una máquina para ensayos de tracción. p.6. Quito, Ecuador: Universidad Internacional del Ecuador
Cazañas, A., De San Miguel, A. y Parra, E. (2017). Estimación del tamaño de la muestra para pruebas de usabilidad. Quito, Ecuador. Enfoque UTE, 7(1), 172-185.
Díaz Abad, J. (2016). Bioprinting: el mundo del 3D en la medicina. (Documento electrónico). Elsevier. Recuperado de https://www.elsevier.com/es-es/connect/ciencia/bioprinting-el-mundo-del-3d-en-la-medicina (accedido el 08/07/2019).
Escobar, J., y Escobar, R. (2018). Determinación de la velocidad óptima para la soldadura MIG de la aleación 5086-H116, mediante ensayo de dureza, prueba de tracción y examen metalográfico para la fabricación de tanqueros de aluminio. Enfoque UTE, 9(3), 42-49.
ESUN. (2007). Product and Services. (Documento electrónico). Recuperado de http://www.esun3d.net/Products/PLA (accedido el 09/07/2019).
Fernandez, M., Calle, W., Ferrandiz, S. y Conejero, A. (2016). Effect of Infill Parameters on Tensile Mechanical Behavior in Desktop 3D Printing. 3D Printing and Additive Manufacturing, 3(3). doi: 10.1089/3dp.2015.0036
González, J. (2009) Manual Básico SPSS. Talca, Chile: Centro de Inserción Laboral Programa Jóvenes Profesionales.
Haid C. (2014). Characterizing Tensile Loading Responses of 3D Printed Samples. Massachusetts , EE.UU.: Massachusetts Institute of Technology, 38-40.
Juiña, L., Cabrera, V., y Reina, S. (2017). Aplicación de la teoría de restricciones en la implementación de un Sistema de Manufactura CAD-CAM en la industria Metalmecánica-Plástica, Caso de estudio Quito, Ecuador. Enfoque UTE, 8(3), 56-71.
Pérez, M (2014). Diseño de experimentos. Aplicaciones con IBM SPSS. Createspace Independent Publishing Platform.
Pulido, H. G., De la Vara Salazar, R., González, P. G., Martínez, C. T., & Pérez, M. D. C. T. (2012). Análisis y diseño de experimentos. New York, EE.UU.: McGraw-Hill.
Molina, R., Pender, G., Moro, L., y Piovan, M. (2018). Comportamiento al creep de un polímero utilizado para impresión 3D. Revista Materia, 23(2).
Montgomery D.C. (2004). Diseño y Análisis de Experimentos. 2da edición. Arizona, EE.UU.: Universidad Estatal de Arizona.
Navas, A., Reyes, R. y Galván, L. (2015). Impactos ambientales asociados con el proceso de producción del concreto. Enfoque UTE, 6(4), 67-80.
Ordoñez-Alemán, G. (2017). La contribución al emprendimiento ecuatoriano de una empresa de tecnología 3D. Revista de Negocios y PYMES 2017. 3-7:35-46.
Tamayo, I., Pazmiño, L., Galván, M. y Batista, M. (2015). Implementación de prácticas de laboratorio con costo mínimo. Quito, Ecuador. Enfoque UTE, 6(2), 44-58.
Wittbrodt B. y Pearce J.M., (2015) The Effects of PLA Color on Material Properties of 3-D Printed Components. Additive Manufacturing, 8(1), 110-116