Miscellaneous/Misceláneos
Fault detection in axial piston hydraulic pumps: integrating principal component analysis with silhouette-based cluster evaluation
 Fabian H Diaz Palencia
Carlos Borrás
Cecilia E. García Cena
Fabian H Diaz Palencia
Carlos Borrás
Cecilia E. García Cena
Fault detection in axial piston hydraulic pumps: integrating principal component analysis with silhouette-based cluster evaluation
Enfoque UTE, vol. 16, núm. 2, pp. 1-9, 2025
Universidad UTE
Recepción: 17 Diciembre 2024
Revisado: 16 Enero 2025
Aprobación: 05 Febrero 2025
Abstract: This paper presents an approach integrating principal component and silhouette analysis with clustering algorithms for fault detection in hydraulic systems. The methodology was validated through a study in which vibration and pressure signals were collected under normal and fault conditions. These signals were then processed through filtering and normalization, followed by dimensionality reduction using principal component analysis. The resulting lower-dimensional feature vectors retained the critical characteristics of both normal and faulty conditions and were subsequently fed into a clustering algorithm. The quality of the resulting clusters was evaluated using silhouette analysis, which offers a reliable means of assessing cluster quality and visualising the outcomes of fault classification. The study demonstrates the effectiveness of this method in accurately representing the patterns of normal and malfunctioning hydraulic pump conditions, ultimately leading to successful diagnostic results.
Keywords: Principal Component Analysis, Silhouette Analysis, Failure Detection, hydraulic piston pump.
Resumen: Este artículo presenta un enfoque que integra el análisis de componentes principales y el análisis de siluetas con algoritmos de agrupamiento para la detección de fallos en sistemas hidráulicos. La metodología se validó a través de un estudio en el que se recopilaron señales de vibración y presión en condiciones normales y de fallo. Estas señales fueron procesadas mediante filtrado y normalización, seguidos de una reducción de la dimensionalidad con el análisis de componentes principales. Los vectores de características de menor dimensión resultantes conservaron las características críticas tanto de las condiciones normales como de las defectuosas y posteriormente se introdujeron en un algoritmo de agrupación. La calidad de los conglomerados resultantes se evaluó con el análisis de siluetas, que ofrece un método fiable para evaluar la calidad de los conglomerados y visualizar los resultados de la clasificación de fallos. El estudio demuestra la eficacia de este método a la hora de representar con precisión los patrones de las condiciones normales y defectuosas de las bombas hidráulicas, lo que en última instancia conduce a resultados de diagnóstico satisfactorios.
Palabras clave: Análisis de Componentes Principales, Análisis de Silueta, Detección de fallas, Bomba Hidráulica de Pistones.
I. INTRODUCTION
Fault monitoring and diagnosis in dynamic systems is a key challenge in industrial engineering, particularly in the analysis of sensor data. The axial piston hydraulic pump is a critical component within hydrostatic systems [1]; it is used as equipment to transmit power in various applications, and its good performance depends on the success and efficiency of the operations in which it is involved within industrial processes. For this reason, companies invest significant efforts and capital in maintenance issues to take advantage of or prolong to the maximum its operation; early detection of failures in the components that integrate it has been a constant research task in recent years. This task consists of determining the type of failure, and for this purpose, it is possible to distinguish three main approaches [2][3][4].
-
Diagnostic systems for hydraulic systems based on the developed model of the diagnosed system.
-
Diagnostic systems for hydraulic systems based on signal analysis.
-
Diagnostic systems for hydraulic systems based on knowledge or so-called intelligent fault identification.
Fault detection using knowledge-based methods is a heuristic process. System characteristic values are used to extract features under normal and erratic conditions; once the features are extracted under both conditions, they are compared and the change detection methods are applied. Artificial neural networks, fuzzy logic, principal component analysis and neuro-fuzzy methods can be considered knowledge-based [5]. This paper focuses on applying Principal Component Analysis (PCA) for anomaly and fault detection in time series data, followed by a detailed analysis using T2. In addition, silhouette plot analysis is included to assess the quality of the clusters generated from the PCA scores. The aim is to provide a robust methodology for detecting system failures from vibration data or other sensor measurements.
II. BACKGROUND
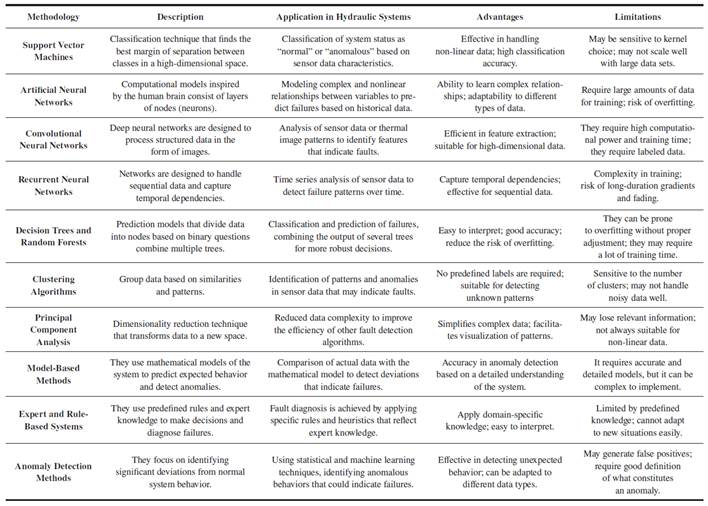
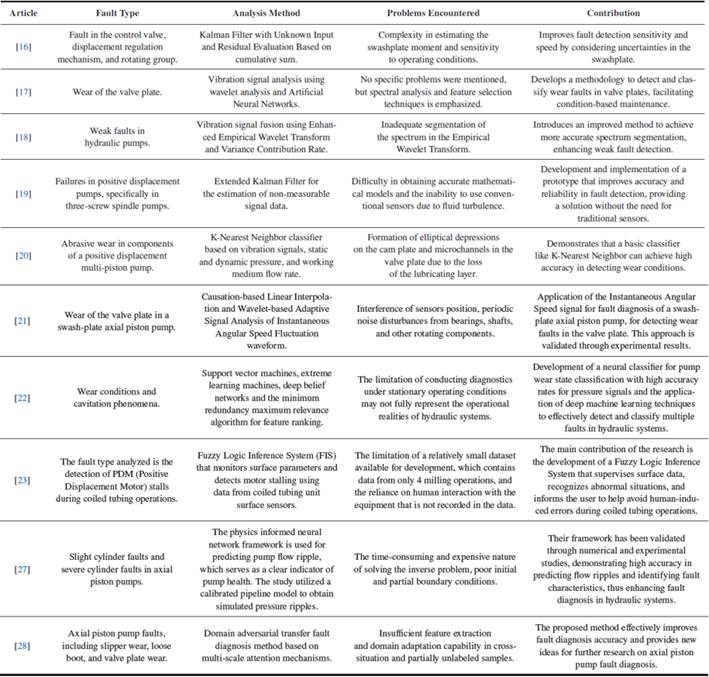
Several methods have been employed for fault detection and diagnosis in hydraulic systems. Table I compares various techniques used for this purpose. Each process is described in terms of its basic functionality, specific applications in the context of hydraulic systems, key advantages, and inherent limitations. On the opposing side., Table II shows some techniques for detection or diagnosis. of faults in hydraulic systems based on the methods previously described.
A. Principal Components Analysis as a Methodology for Fault Detection
The Principal Components Analysis (PCA) method, introduced by Pearson in 1901 and Hoteling in 1933, is a statistical tool designed to reduce the dimensionality of a dataset containing multiple interrelated variables while preserving as much variation as possible. This is achieved by transforming the original variables into a new set of uncorrelated variables known as principal components. These components are ordered, with the first retaining most of the variation present in the original variables [6].
PCA has proven to be a powerful tool for detecting faults in complex systems, especially in industrial processes and machinery. PCA is well-suited for identifying anomalies in high-dimensional datasets. By projecting new data onto the lower-dimensional space defined by the principal components, deviations from normal operation patterns can be readily identified. This approach allows for the timely detection of subtle changes in system behavior that may indicate the onset of faults. The ability of PCA to handle large datasets, reduce noise, and provide interpretable results has led to its increasing popularity for fault detection [see Fig. 1] across various industries, including manufacturing, chemical processing, and mechanical systems
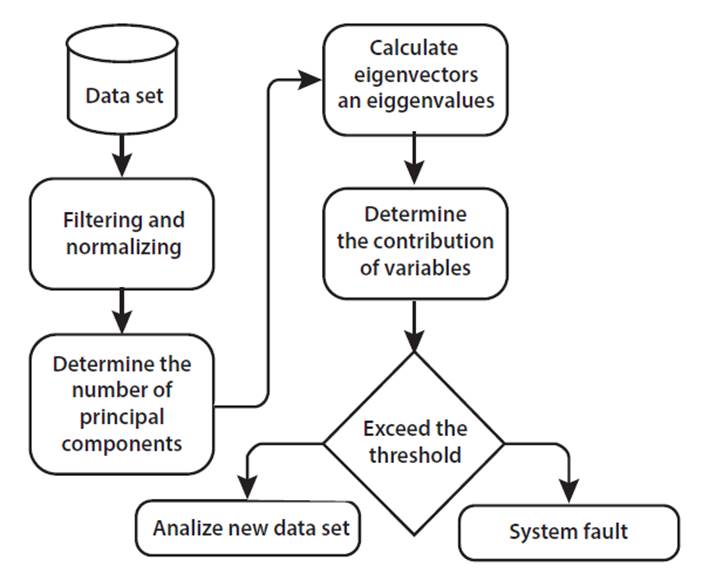
Fig. 1.
Typical diagnostic methodology by PCA.
The article [7] mentions that PCA applications in multivariate process failure diagnosis started in the 1990s, and to date, it is still implemented in conjunction with other techniques or methodologies. The idea is to use sensor data and/or variables that describe the operation of devices, processes, or systems and apply PCA to identify the main components that explain the most significant amount of variability in the data to identify patterns or relationships that may indicate the presence of a fault or erratic operation.
L. Siyuan et al., in [8] show a study on the application of PCA for fault detection in Hydraulic Pumps, and in [9] combines Rough Set (RS) and PCA to diagnose faults based on the energy characteristics of Vibration signals also in hydraulic pumps.
M. Atoui et al., in [10] apply Bayesian Networks (BN) and PCA, BN and 4381 for fault detection, validating both methodologies using the Tennessee Eastman Process, showing that both methods produce the same performance at the time of fault detection.
Villegas et al. in [11] describe the PCA application for fault detection and diagnosis in a real plant. The approach includes a PCA model for each system behavior, i.e., models under normal and fault conditions. It demonstrates that detecting and identifying level sensor failures and clogging in a two-communicating tank system is possible. The paper [29] presents a multimode process monitoring technique that integrates density peak clustering and kernel principal component analysis with a multi-strategy zebra optimization algorithm. The proposed method enhances mode identification accuracy and fault detection capabilities in dynamic industrial processes. Experimental validation demonstrates the method’s superiority over traditional techniques, achieving high fault detection rates and low false alarm rates across various scenarios, particularly in identifying transition modes.
The study presented in [12] introduces an innovative approach for diagnosing faults in grid-connected photovoltaic systems by combining feature extraction techniques like the Salp Swarm Algorithm with supervised machine learning classifiers. The model’s performance is compared against traditional methods such as PCA and Kernel PCA. The findings demonstrate that the model achieves a diagnostic accuracy of over 99 % and greatly enhances computational efficiency compared to PCA and KPCA. This improvement is particularly notable for fault classification in nonlinear systems where PCA and KPCA are less effective.
The research detailed in [13] is centered on creating a fault diagnosis and location system for nuclear plant equipment. It utilizes PCA to reduce the dimensionality of sensor data from 70 to 21 dimensions, resulting in improved classification accuracy during the training of a Residual Network, with a peak accuracy of 98.59 %. In a study referenced as [20], Diaz used PCA for detecting failures related to loss of volumetric efficiency and applied SVM to classify the severity of failure in an axial piston pump. The study yielded results close to 99 %.
Zhao et al. [14] propose a new fault diagnosis method based on PCA. First, they transform the vibration signal to the frequency domain. Then, they use the PCA method to reduce the dimension of the feature matrix. Finally, the reduced feature vector is fed into another model to diagnose faults in a rotating machinery bench.
Cárdenas et al. [15] developed a PCA-based approach to detect and categorize faults in a natural gas engine. Their algorithm analyzed alarm bursts to distinguish normal system behavior from failures. The results they obtained were quite promising and outperformed the existing methods used by operators.
III. METHODOLOGY
To develop this work, a test bench [see Fig. 2] equipped with a Siemens 40 [HP] 1200 rpm electric motor and an Eaton 54 series axial piston pump was used to induce the failure conditions [see Fig. 3]. The load was generated by means of a manifold consisting of two crossed relief valves, with which it was possible to maintain the same load conditions during the experiment [see Fig. 4].
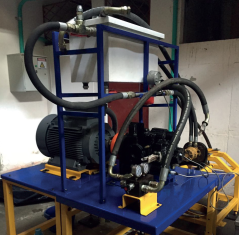
Fig. 2.
Test bench
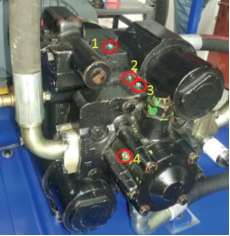
Fig. 3.
Positions taken for vibration measurement.
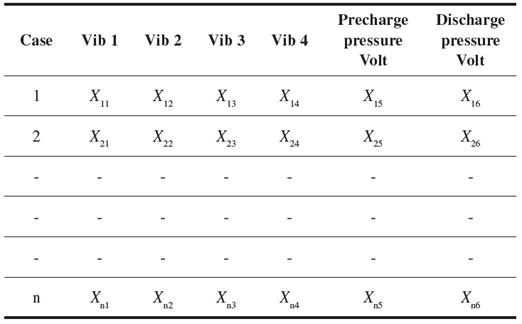
Two datasets were collected, one for normal and another for fault conditions test data are also separated to perform failure predictions under unknown conditions. At a pre-established load of 700 psi, maintaining the measurement variables such as operating regime, external noises, and hydraulic oil temperature in a constant range. To perform the proposed study, we proceeded to capture signals of preload pressure, discharge pressure, and mechanical vibrations in four points at the pump, in fault and non-fault conditions must be gathered [Table III].
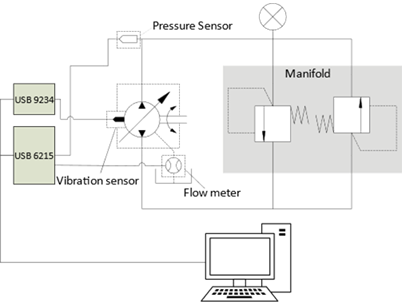
Fig. 4.
Experiment’s schematic.
-
WIKA pressure transducer model ECO-1 to measure discharge pressure.
-
Diagnostic systems for hydraulic systems based on signal analysis.
-
Diagnostic systems for hydraulic systems based on knowledge or so-called intelligent fault identification.
-
NI USB-6215 card
-
NI USB-9234 card
-
Laptop for data analysis.
The experiment uses the components mentioned above and LabVIEW software for signal acquisition. The sampling frequency was 100 kHz for pressure data and 50 kHz for vibration data. Intentionally wearing out the valve plate induces one kind of fault condition: loss of volumetric efficiency. The data set includes data obtained when the pump worked in both fault and normal conditions and comprises 216 observations from the six variables.
The Fast Fourier Transform (FFT) was applied to time series data to explore signals’ spectral characteristics. The FFT decomposes vibration signals into their frequency components, enabling visualization of how fault conditions alter the data’s spectral characteristics. The amplitude spectrum is calculated for each signal of each variable (sensor), highlighting frequency differences between normal and fault conditions.
In the Fig. 5. we can see the difference in the vibration spectrum in fault and not fault for the four accelerometer positions.
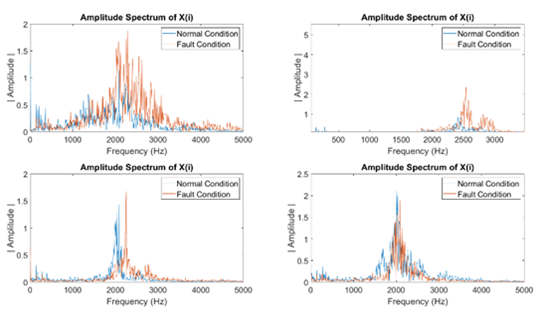
Fig. 5
Vibration Spectrum for normal and fault condition.
A. Principal Component Analysis (PCA)
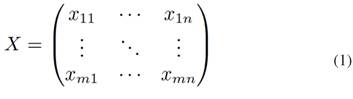
PCA reduces data dimensionality and extracts the primary characteristics describing data variations. The technique projects data into a lower-dimensional space while preserving maximum variance [24]. Given a set of observations associated either with control, monitoring or simply as indicators of the process, new variables called principal components are constructed such that considering a data matrix  [Eq. 1]:
 [Eq.1]
It is convenient to normalize the data for each variable so that all the variables have the same weight in the computation. Then from this matrix, the covariance matrix can be calculated as follows [Eq. 2]:
 [Eq.2]
Performing singular value decomposition (SVD) [Eq. 3]:
 [Eq.3]
Where  is a diagonal matrix with the eigenvalues of S sorted in descending order
  , the columns of the matrix V are the eigenvectors of S. The transformation matrix
  is generated by choosing the eigenvectors or columns
  corresponding to the eigenvalues. For each dataset (normal and fault), the number of principal components necessary to explain at least 90 % of the variance is selected by the percentage of variability explained criterion, where the number of principal components a is taken so that Pa is close to a user-specified value [25], and the new dataset of smaller dimensions than the original is given by [Eq. 4]:
 [Eq.4]
Now, the original dataset can be represented in terms of its eigenvectors, which define the direction of the principal components [Eq. 5]:
 [Eq.5]
The difference between the original dataset and the transformed dataset is the residue matrix [Eq. 6]:
 [Eq.6]
B. Statistics for monitoring with PCA
Hotelling ( ): This statistic is used to detect anomalies in new observations by comparing
  values to a determined threshold. Given an observation vector of the process, we can define this states statistic of the form [Eq. 7]:
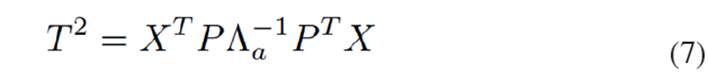 [Eq.7]
This threshold can be calculated from the sample data following [Eq. 8]:
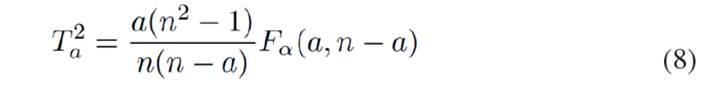 [Eq.8]
Where  is the number of samples taken for the calculation of the PCA and
  is the critical value of the Fisher-distribution) with
  and
and  degrees of freedom and
  level of significance, which specifies the degree of commitment to false alarms. Its most typical values are 0.01 and 0.05.
C. Cluster analysis
According to [25], K-means clustering is an unsupervised non-hierarchical clustering algorithm focusing on similarity. It was applied to group data into two clusters: one for normal conditions and another for fault conditions. Once PCA has reduced the data, we apply the K-means clustering algorithm to group the data points into clusters to identify normal and fault condition data clustering patterns [26]. Given a set of observations  and
and  is the sum of the distances from the objects to its centroid and minimizing it; is the mean (also called centroid) of points in cluster [Eq. 9].
 [Eq.9]
Finally, we used silhouette analysis to evaluate the quality of the clusters obtained. According to [5] Data i in the cluster  is the average intra-cluster distance and
  is the average inter-cluster distance. The number
  is obtained by combining
  and
and  following [Eq. 10]:
 [Eq.10]
The silhouette coefficient measures the coherence and separation of the points within the clusters. However, instead of calculating the silhouette coefficient in the original data space, we calculate it in the principal component space. This allows us to visualize and evaluate the quality of the clusters in a lower-dimensional space. These plots assess cluster cohesion and separation, indicating the effectiveness of segmentation. The silhouette score measures how well samples are clustered with similar samples to evaluate the quality of clusters produced by clustering algorithms like K-Means [4]. The silhouette score can range from -1 to 1, with higher values indicating well-clustered objects and lower values suggesting that an object might belong to the wrong cluster.
D. Parameter Selection
The number of clusters (k=2) was determined for K-means clustering based on our prior knowledge of the system states (normal and fault conditions). For the silhouette analysis, a minimum silhouette score threshold of 0.5 was established to ensure cluster quality. For both analyses, the distance metric employed was “correlation,” which is defined by the Matlab Help Center as “One minus the sample correlation between points (treated as sequences of values).” In this context, each centroid represents the component-wise mean of the points within that specific cluster, following the procedure of centering and normalizing these points to achieve a zero mean and unit standard deviation. This approach ensures that the clustering process effectively captures the underlying relationships between data points while accounting for variations in scale and distribution.
IV. RESULTS
A.Data Preprocessing and Principal Component Analysis
The results of the PCA analysis indicated significant dimensionality reduction. The initial dataset, which comprised six variables, was effectively condensed into a lower-dimensional space. This reduction was achieved using three principal components, which collectively accounted for at least 90 % of the total variance, [see Fig. 6]. This finding underscores the efficacy of PCA in simplifying complex datasets while retaining critical information.
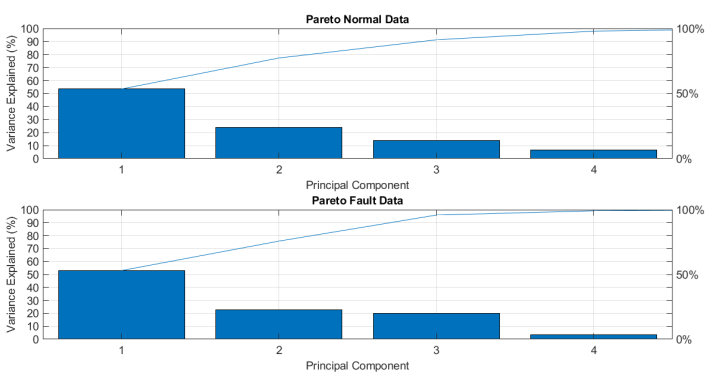
Fig. 6.
Pareto
B. Clustering Results
K-means clustering was applied to the data transformed through Principal Component Analysis (PCA), successfully generating two distinct clusters. One cluster represents normal operational conditions, while the other encapsulates fault conditions. This method effectively separates the data points corresponding to normal and fault conditions, thereby enhancing the understanding of the underlying patterns within the dataset. Such differentiation is crucial for monitoring and diagnosing system performance in various applications [see Fig. 7]. The Silhouette scores were computed within the principal component space, revealing strong indications of effective cluster separation and coherence. This analysis suggests that the clustering methodology employed is successful in distinguishing between the identified groups while maintaining internal consistency among observations within each cluster [see Fig. 8].
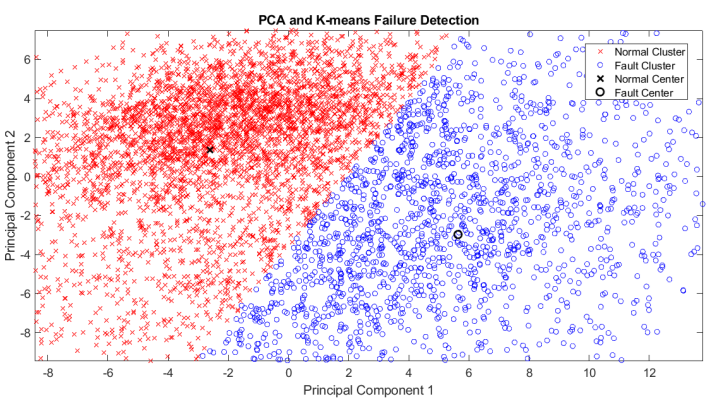
Fig. 7
Clusters from Normal and Fault data by K-means
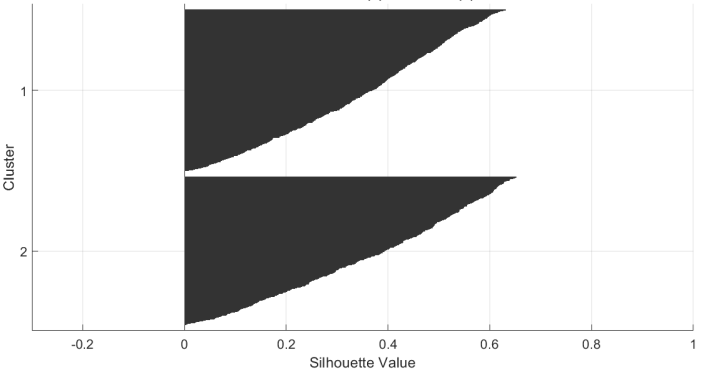
Fig. 8.
Clusters from Normal (1) and Fault (2) data
C. Anomaly Detection Statistics
The  statistic threshold was determined using the Fisher distribution [see Fig. 9]. Observations that exceed this threshold were identified as potential anomalies, with significance levels set at 0.05.[ Figure 10] depicts the monitoring of the
  and how is able to detect the failure at the instant of occurrence (1000).
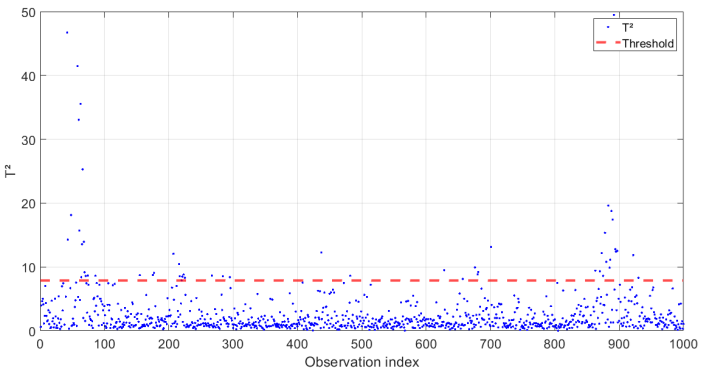
Fig. 9.
Threshold
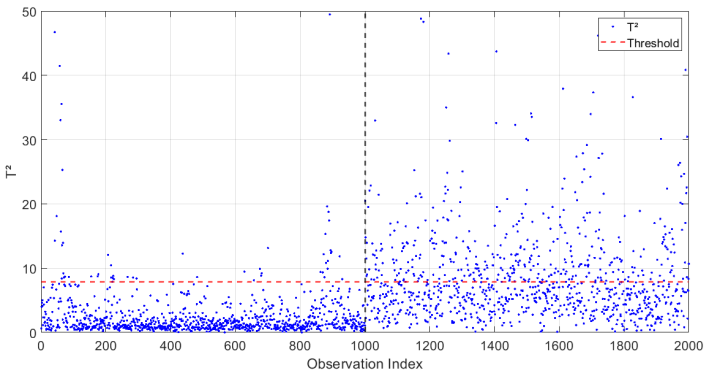
Fig. 10.
Fault Detection
V. DISCUSSION
While our methodology has demonstrated promising results in fault detection, certain limitations must be acknowledged. Primarily, the approach tends to assume steady-state operational conditions, which may restrict its applicability in more dynamic environments characterized by rapidly changing system states. Moreover, although Principal Component Analysis (PCA) is effective for dimensionality reduction, it may unintentionally overlook complex nonlinear relationships present within the data. Additionally, the current clustering methodology necessitates complete retraining when encountering new fault types, which could hinder its adaptability and scalability across various hydraulic system configurations.
To mitigate these limitations, we could consider the integration of deep learning techniques to enhance the management of complex nonlinear relationships. Developing adaptive clustering parameters would facilitate a more dynamic assessment of different operating conditions. Furthermore, extending the method to accommodate multi-fault classification scenarios would significantly enhance its versatility in hydraulic systems.
Performing a comparative analysis. The proposed method of PCA and silhouette analysis offers advantages in terms of computational efficiency, interpretability of results and ability to operate without labeled data. However, it is limited by its dependence on linear relationships and requires careful parameter tuning. In contrast, deep learning techniques excel at capturing complex patterns and handling nonlinear relationships, but require large data sets and considerable computational resources. Finally, model-based approaches offer a unique perspective due to their physics-based understanding and ability to operate with limited data; however, they face challenges related to complex model development processes and system-specific constraints. These methodologies present a unique balance between computational complexity, data requirements, and diagnostic accuracy, demonstrating the importance of selecting an approach that fits the specific characteristics of the hydraulic system and the objectives of each investigation.
VI. CONCLUSION
The findings illustrate the effectiveness of this methodology in revealing clearer clustering patterns and helping to identify potential anomalies or deviations from standard operational conditions.
The proposed methodology effectively reduces the dimensionality of the data while preserving crucial essential information for fault detection. Silhouette analysis within the principal component space emerges as a valuable tool to assess and visualize the quality of the cluster, which aids in the identification of anomalies. The method shows promise for early fault detection by identifying possible transient states or emerging fault conditions.
Despite the encouraging results, further research is needed to validate the reliability of the method across various operating conditions and fault types. Future studies should incorporate systematic comparisons with other fault detection methods, investigate alternative clustering techniques, and validate the findings using a more diverse and extensive dataset.
Looking ahead, future work will focus on further exploring and refining this methodology across different domains and datasets, as well as investigating other techniques and algorithmic combinations to achieve even more robust results. Fault detection is a continually evolving field, and the use of combined approaches can enhance the accuracy and efficiency of these processes.
Acknowledgments
This research was supported by Vicerrectoría de Investigación y Extensión (VIE) of the Universidad Industrial de Santander, UIS, Colombia. UIS - VIE 1366 Research Funding Project.
References
[1] S. Liu et al., A new test method for simulating wear failure of hydraulic pump slipper pair under high-speed and high-pressure conditions, Front. Energy Res., vol. 10, no. January, pp. 1-14, 2023, https://doi.org/10.3389/fenrg.2022.1096633
[2] M. T. Amin, F. Khan, S. Imtiaz and S. Ahmed, Robust Process Monitoring Methodology for Detection and Diagnosis of Unobservable Faults, Ind. Eng. Chem. Res., vol. 58, no. 41, pp. 19149-19165, 2019. https://doi.org/10.1021/acs.iecr.9b03406
[3] G. Patterson-hine, G. Aaseng, S. Biswas, S.Narasimhan and K. Pattipati, “A Review of Diagnostic Techniques for ISHM Applications”, NASA Ames Res. Cent. Honeywell Def. Sp. Electron. Syst., vol. 1, 2005.
[4] J. Watton, Modelling, Monitoring and Diagnostic Techniques for Fluid Power Systems. Wales: Springer, 2007.
[5] V. K. Kandula, Fault detection in process control plants using principal component analysis (LSU Master’s Theses). 2011.
[6] I. T. Jolliffe, “Principal Component Analysis, Second Edition”, Encycl. Stat. Behav. Sci., vol. 30, no. 3, pp. 487, 2002. https://doi.org/10.2307/1270093
[7] J. Mina and C. Verde, Detección de fallas usando análisis de componentes principales, pp. 431-436, 2004. Instituto de Ingeniería, UNAM.
[8] L. Siyuan et al., “Application of PCA for fault detection in Hydraulic Pumps,” Journal of Hydraulic Engineering, vol. 15, no. 4, pp. 234-245, 2010.
[9] L. Siyuan et al., “Rough Set and PCA for fault diagnosis in hydraulic systems”, International Journal of Fluid Power, vol. 10, no. 2, pp. 50-160, 2012.
[10] M. A. Atoui et al., “Bayesian Networks and PCA for fault detection in Tennessee Eastman Process,” AI in Manufacturing, vol. 5, no. 1, pp. 45-58, 2015.
[11] Villegas et al., “PCA application for fault detection in real plants”, IEEE Transactions on Industrial Applications, vol. 29, pp. 255-263, 2017.
[12] A. Hichri, M. Hajji, M. Mansouri, H. Nounou and K. Bouzrara, “Supervised machine learning-based salp swarm algorithm for fault diagnosis of photovoltaic systems”, J. Eng. Appl. Sci., vol. 71, no. 1, pp. 1-17, 2024, https://doi.org/10.1186/s44147-023-00344-z
[13] X. Ying Huang, H. Xia, W. zhe Yin and Y. kuo Liu, “Research on fault diagnosis and fault location of nuclear power plant equipment”, Ann. Nucl. Energy, vol. 205, no. April, p. 110556, 2024, https://doi.org/10.1016/j.anucene.2024.110556
[14] H. Zhao et al., “PCA and Salp Swarm Algorithm for fault detection in photovoltaic systems”, Renewable Energy, vol. 23, pp. 98-107, 2019.
[15] Y. Cardenas, G. Carrillo, A. Alviz, A. Alviz, I. Portnoy, J. Fajardo, E. Ocampo and E. Da-Costa, “Application of a Pca-Based Fault Detection and Diagnosis Method in a Power Generation System With a 2 Mw Natural Gas Engine”, EUREKA, Phys. Eng., vol. 2022, no. 6, pp. 84-98, 2022, https://doi.org/10.21303/2461-4262.2022.002701
[16] B. Xu, X. Huang, J. Zhang, W. Huang, F. Lyu and H. Xu, “A Fault Detection Method for a Practical Electro-Hydraulic Variable-Displacement Pump with Unknown Swashplate Moment”, IEEE Trans. Instrum. Meas., vol. 72, pp. 1-11, 2023, https://doi.org/10.1109/TIM.2023.3265090
[17] J. G. Maradey Lázaro and C. Borrás Pinilla, “A methodology for detection of wear in hydraulic axial piston pumps”, Int. J. Interact. Des. Manuf., vol. 14, no. 3, pp. 1103-1119, 2020, https://doi.org/10.1007/s12008-020-00681-w
[18] H. Yu, H. Li, and Y. Li, “Vibration signal fusion using improved empirical wavelet transform and variance contribution rate for weak fault detection of hydraulic pumps”, ISA Trans., vol. 107, pp. 385-401, 2020, https://doi.org/10.1016/j.isatra.2020.07.025
[19] A. Dabrowska, R. Stetter, H. Sasmito and S. Kleinmann, “Extended Kalman Filter algorithm for advanced diagnosis of positive displacement pumps”, IFAC Proceedings, vol. 45, no. 20, https://doi.org/10.3182/20120829-3-MX-2028.00068
[20] J. Konieczny and J. Stojek, “Use of the k-nearest neighbour classifier in wear condition classification of a positive displacement pump”, Sensors, vol. 21, no. 18, 2021, https://doi.org/10.3390/s21186247
[21] J. M. Liu, L. C. Gu, and B. L. Geng, “A practical signal processing approach for fault detection of axial piston pumps using instantaneous angular speed”, Proc. Inst. Mech. Eng. Part C J. Mech. Eng. Sci., vol. 234, no. 19, pp. 3935-3947, 2020, https://doi.org/10.1177/0954406220917704
[22] J. Konieczny, W. Łatas, and J. Stojek, “Classification of Wear State for a Positive Displacement Pump Using Deep Machine Learning †”, Energies, vol. 16, no. 3, pp. 1-19, 2023, https://doi.org/10.3390/en16031408
[23] R. A. Galo Fernandes, P. M. Silva Rocha Rizol, A. Nascimento, and J. A. Matelli, “A Fuzzy Inference System for Detection of Positive Displacement Motor (PDM) Stalls during Coiled Tubing Operations”, Appl. Sci., vol. 12, no. 19, 2022, https://doi.org/10.3390/app12199883
[24] C. Liu, J. Bai, and F. Wu, “Fault Diagnosis Using Dynamic Principal Component Analysis and GA Feature Selection Modeling for Industrial Processes”, Processes, vol. 10, no. 12, 2022, https://doi.org/10.3390/pr10122570
[25] Y. Huo, Y. Cao, Z. Wang, Y. Yan, Z. Ge, and Y. Yang, “Traffic anomaly detection method based on improved GRU and EFMS-Kmeans clustering”, Comput. Model. Eng. Sci., vol. 126, no. 3, pp. 1053-1091, 2021, https://doi.org/10.32604/cmes.2021.013045
[26] J. Wu, Advances in K-means Clustering a Data Mining Thinking. Springer-Verlag Berlin Heidelberg, 2012.
[27] C. Dong, J. Tao, H. Sun, Q. Wei, H. Tan, and C. Liu, “Innovative fault diagnosis for axial piston pumps: A physics-informed neural network framework predicting pump flow ripple”, Mech. Syst. Signal Process., vol. 225, no. January, p. 112274, 2025, https://doi.org/10.1016/j.ymssp.2024.112274
[28] Z. Dong, H. An, S. Liu, S. Ma, Y. G, H. Pan and Ch. Ai, “Domain adversarial transfer fault diagnosis method of an axial piston pump based on a multi-scale attention mechanism”, Meas. J. Int. Meas. Confed., vol. 239, no. July 2024, p. 115455, 2025, https://doi.org/10.1016/j.measurement.2024.115455
[29] D. Ling, T. Jiang, Y. Zheng and Y. Wang, “An adaptive mode identification and fault detection scheme for nonlinear multimode process monitoring using improved DPC-KPCA”, J. Taiwan Inst. Chem. Eng}., vol. 169, no. January, p. 105915, 2025, https://doi.org/10.1016/j.jtice.2024.105915
Información adicional
redalyc-journal-id: 5722