NOTAS Y COMENTARIOS
ECONOMIC AND HEALTH IMPACT OF THE COVID-19 PANDEMIC IN ARGENTINA AND THE WORLD^
Impacto económico y sanitario de la pandemia de Covid19 en Argentina y el mundo
ECONOMIC AND HEALTH IMPACT OF THE COVID-19 PANDEMIC IN ARGENTINA AND THE WORLD^
ESTUDIOS ECONÓMICOS, vol. XXXIX, núm. 78, pp. 223-242, 2022
Universidad Nacional del Sur

Esta obra está bajo una Licencia Creative Commons Atribución-NoComercial 4.0 Internacional.
Recepción: 23 Mayo 2021
Aprobación: 01 Junio 2021
Abstract:
The work conducted a comparative analysis on the economic and health impact of the COVID-19 pandemic in Argentina and the world. Regardless of the indicators used (GDP, confinement, deaths, and vaccinations), Argentina was in the worst quadrant along with Panama and Peru, being in the four indicators in the most unfavorable scenarios. Other countries, such as Iraq, The Bahamas, and Colombia were placed in two categories, while Spain, Chile, and the United Kingdom were placed in only one. Argentina has been one of the countries with the worst treatment of the coronavirus crisis in the world according to the variables used in this study. JEL Codes: HO, I18, I15.
Keywords: COVID-19, GDP, deaths, confinement.
Resumen:
El trabajo realiza un análisis comparativo sobre el impacto económico y sanitario de la pandemia de COVID-19 en Argentina y el mundo. Con independencia de los indicadores utilizados (PIB, confinamiento, muertes y vacunados), Argentina se ubicó en el peor cuadrante junto con Panamá y Perú, estando en los cuatro indicadores en los escenarios más desfavorables. Otros países, como Irak, Bahamas y Colombia se ubicaron en dos, mientras que España, Chile y Gran Bretaña se ubicaron solo en una categoría. Argentina ha sido uno de los países con peor tratamiento de la crisis de coronavirus en el mundo según las variables utilizadas. El trabajo realiza un análisis comparativo sobre el impacto económico y sanitario de la pandemia de COVID-19 en Argentina y el mundo. Con independencia de los indicadores utilizados (PIB, confinamiento, muertes y vacunados), Argentina se ubicó en el peor cuadrante junto con Panamá y Perú, estando en los cuatro indicadores en los escenarios más desfavorables. Otros países, como Irak, Bahamas y Colombia se ubicaron en dos, mientras que España, Chile y Gran Bretaña se ubicaron solo en una categoría. Argentina ha sido uno de los países con peor tratamiento de la crisis de coronavirus en el mundo según las variables utilizadas. Códigos JEL: HO, I18, I15.
Palabras clave: COVID-19, PIB, muertes, confinamiento.
I. INTRODUCTION
The COVID-19 pandemic, which began in China in late 2019 and spread to the rest of the world during 2020, has caused the largest recession since World War II (World Bank, 2021). Production in 2024 is expected to be still 3% lower than before the pandemic (IMF, 2021).
The closure of borders, the mandatory confinement, and the restriction of the mobility of factors, which affected the whole world, is an unprecedented event with an open end in terms of economic and health impact. For such an event, there are no models or theories to offer a conclusive solution or answer (McKibbin & Fernando, 2020).
The coronavirus pandemic has had a major impact on the world economy, reflecting the effects of the COVID-19 virus itself, the imposition of public health restrictions, and voluntary social distance to contain its spread (ONS, 2021).
The strong processes of compulsory and social confinement were aimed at minimizing the spread of the virus, given the ignorance of its biological behavior due to the absence of sanitary tools for its elimination (vaccines, drugs, therapies, etc.). The most widely used argument was that, in this way, restrictions on people’s mobility would reduce the future number of deaths.
On the eve of a second wave in Latin America due to the arrival of winter and with Europe entering a third wave, despite the vaccination operation, concern for the future becomes dramatic, especially in nations where the proportion of the population vaccinated is low and, consequently, new restrictions are implemented, as is the situation in Argentina today.
The objective of this work is to describe the health and economic impact of the COVID-19 pandemic in a sample of 123 countries during 2020 through a set of variables, such as the fall in GDP (economic), the severity of confinement (political), the number of deaths per million inhabitants (health), and the proportion of the population vaccinated (technological).
The work is organized as follows. Section II details the method of classifying countries in four quadrants. Section III offers descriptive statistics of the variables used in the work together with the information sources. Section IV describes the relations between a fall in GDP and a confinement severity index. Section V lists deaths per million inhabitants and the confinement rate. Section VI evaluates deaths per million inhabitants and the fall in GDP. Section VII analyzes the vaccinated population over the total. Section VIII provides an evaluation of the results obtained. Section IX presents the conclusions. An annex with complementary information is incorporated.
II. METHODOLOGY FOR CLASSIFYING COUNTRIES IN FOUR QUADRANTS
This section describes the method of classification of countries to explain how they establish the squads that divide the economies in four areas. These are not casual events and follow a statistical, economic, and sanitary logic.
With respect to GDP, a GDP decline rate of 9.09% was used as the cut-off, corresponding to the 85th percentile. That is, 85% of the countries had a lower decline and this is considered a demanding indicator of a decline in economic activity. Only 15% of the countries registered contractions above that rate.
Regarding the cut-off of deaths per million inhabitants, the 85th percentile was established as a limit again (to establish a criteria), which corresponds to a value of 830.34 deaths per million inhabitants. It is the most sensitive variable (an economy can recover from a crisis, but death is irreversible), which is why it is considered that this cut is also demanding of the severity of deaths.
For the confinement index, the cut was established at the 85th percentile, which corresponds to a value of 79.61. In this way, the same percentile was used to evaluate the three variables with the same strategy. The variable that describes the proportion of vaccinated population means the number of vaccinated people with respect to the total population. In the next section, a broad definition of the variables used along with the information sources will be offered.
For the construction of the ordinal indexes, the product of the variables under analysis was made as follows fall in GDP and deaths per million inhabitants, confinement index and fall in GDP, and deaths per million inhabitants and confinement. The objective was to build an index that analyzes (both) base by height as if it were a surface. A difference with respect to empirical studies on the same theme is the way of representing the variation in GDP. Most of the analysis describing this variable use negative rates (Financial Times, 2020; European Central Bank, 2020), but, in this analysis, the GDP variation rate module is applied to differentiate its behavior. In this way, a country that registers a strong contraction of activity and a very poor performance in the other variable (confinement or deaths) will be ubiquitous in the right side of the wall, which is the lowest position for any country, according to the methodology of this work.
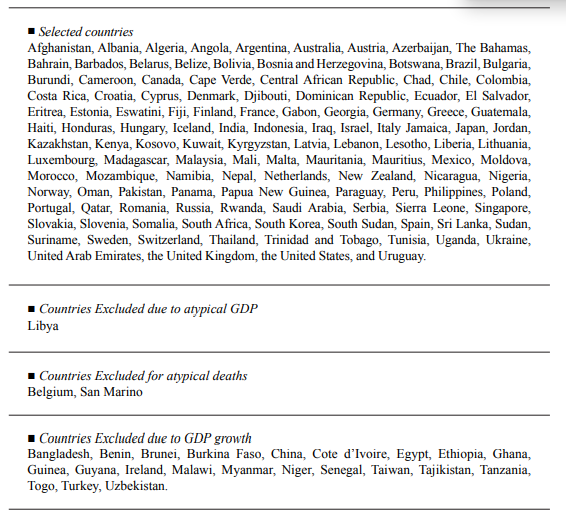
Another methodological decision applied did not include the countries that economically grew in 2020 in the study. The objective of the analysis is to describe the economic and health impact of the pandemic on the variables used: GDP, confinement, deaths, and vaccination. A country could have a significant health impact, but, at the same time, a considerable economic growth during the pandemic (for example, China, Ireland, and Taiwan, among others). In addition, as data shows, of the 148 countries in which data was obtained, the exception were 22, since they presented positive GDP variation accounts, including most African and Asian economies. Incorporating them into the graphics distorts the analysis that intends to carry out this work.
III. DATA
The variables used in the article were the GDP annual variation rate at constant prices in 2020 and an index of severity of confinement for the same period that was elaborated by the University of Oxford, denominated “Stringency Index” (based on a series of indicators such as prohibitions to travel, school, etc.). Also, a variable that describes the deaths per million inhabitants in 2020 and another one that analyzes the proportion of the vaccination over the total population of the country (it is a measure of relative frequency).
In the case of the confinement index, data on deaths per million inhabitants and the proportion of the population inoculated were obtained from the webpage https://ourworldindata.org/. On the other hand, GDP data were gathered from the World Economic Outlook Database of April 2021 from the IMF, https://www.imf.org/en/Home.
The sample comprises 148 countries for which data were available for the three variables (GDP, confinement, and deaths). However, 123 of those countries were used in this article considering the exclusion criteria detailed below. An atypical data feature was studied using the basic criterion of descriptive statistics: the arithmetic mean plus/minus three standard deviations: . As mentioned in the previous section, those countries that present economic growth in 2020 were excluded from the sample. (See the Annex for the complete list of selected and excluded countries and the reasons.)
Table 1 describes the main measures of central tendency, dispersion, and position for the three variables in the sample. Confinement is a skewed data distribution to the left (most data is located at the end). Therefore, the mode is higher than the mean In contrast, in deaths per million inhabitants, the mean is greater than the mode and the data distribution is markedly skewed to the right (the largest number of observations are concentrated at the beginning of the distribution). Finally, the fall in average GDP was 5.6, while the most frequent fall was 2.98, being the distribution asymmetric to the right (the opposite of what happened with confinement, but like deaths per million inhabitants).
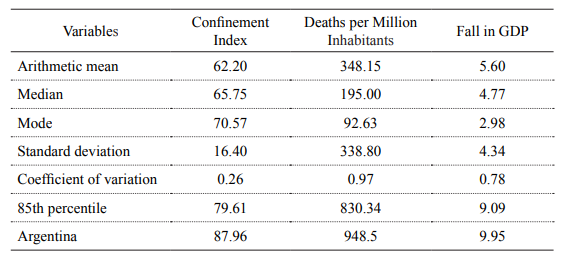
Source: Own elaboration based on https://ourworldindata.org/ and IMF (April 2021).
Observing the coefficient of variability, both deaths per million inhabitants and the fall in GDP have very high values, indicating high heterogeneity. In contrast, the confinement data are more homogeneous with respect to the other variables analyzed.
The 85th percentile is used for the three variables (confinement, deaths, and GDP) as a cut-off to establish the analysis quadrants. In the case of confinement, the value 79.61 separates 85% of the countries with the lowest values from the 15% of those with the highest values. The same procedure is used for deaths per million inhabitants, where the value is 830.34, while, for GDP, it is a fall of 9.09%. For further details, see the construction methodology in the Annex.
Figure 1 describes the asymmetry of the distribution for the three variables under analysis. It is observed that in two of these variables (deaths per million inhabitants and fall in GDP), the data are concentrated at the beginning, while, in the remainder (confinement), they are located at the end. As a conclusion, most countries registered low or moderate deaths per million inhabitants and a fall in GDP, while strong confinement processes were the norm. Conversely, the countries with significant numbers of deaths and falling GDP were the exception, while those that had mild confinement were also the least numerous cases.
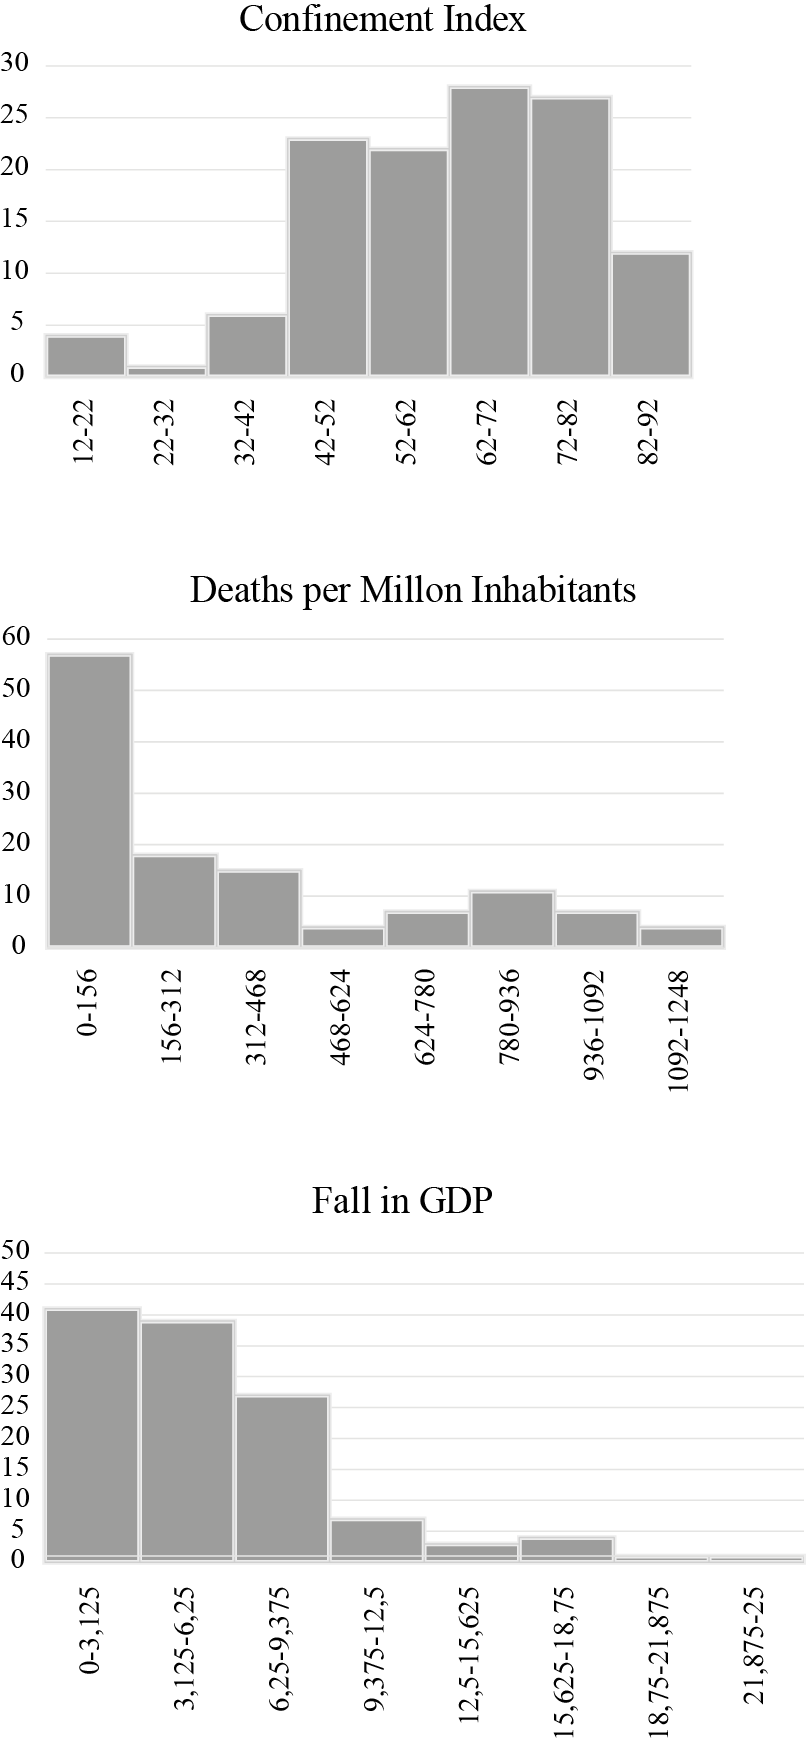
Figure 1.
Asymmetry of the Data Distribution
Source: Own elaboration.
IV. CONFINEMENT AND FALL IN GDP
This section analyzes the relationship between declines in GDP during 2020 (at constant prices) and a lockdown severity index (Stringency Index) developed by the University of Oxford1. This last indicator ranges from 0 to 100 and does not represent its unit of measurement in days, but it is an ordinal index in which the indicator approaches 100, the stronger the severity of the confinement. These were the cases of Argentina, Peru, Chile, Colombia, Iraq, and Panama, among others.
Figure 2 analyzes the relationships between the fall in GDP and the confinement index for a representative sample of countries as of December 2020, establishing four quadrants of analysis (see the Annex for a more detailed description).
On the abscissa axis (horizontal axis) the confinement index (Stringency Index) is located and on the ordinate axis (vertical axis) the contraction of economic activity, which despite being some negative data to favor graphic design, is considered in positive value.
The upper-left quadrant contains countries with a sharp fall in GDP (above 9.09%), but with low and moderate confinement rates (below 79.61). Few countries appear, highlighting the United Kingdom, Spain, Jamaica, Barbados, and Suriname, among others.
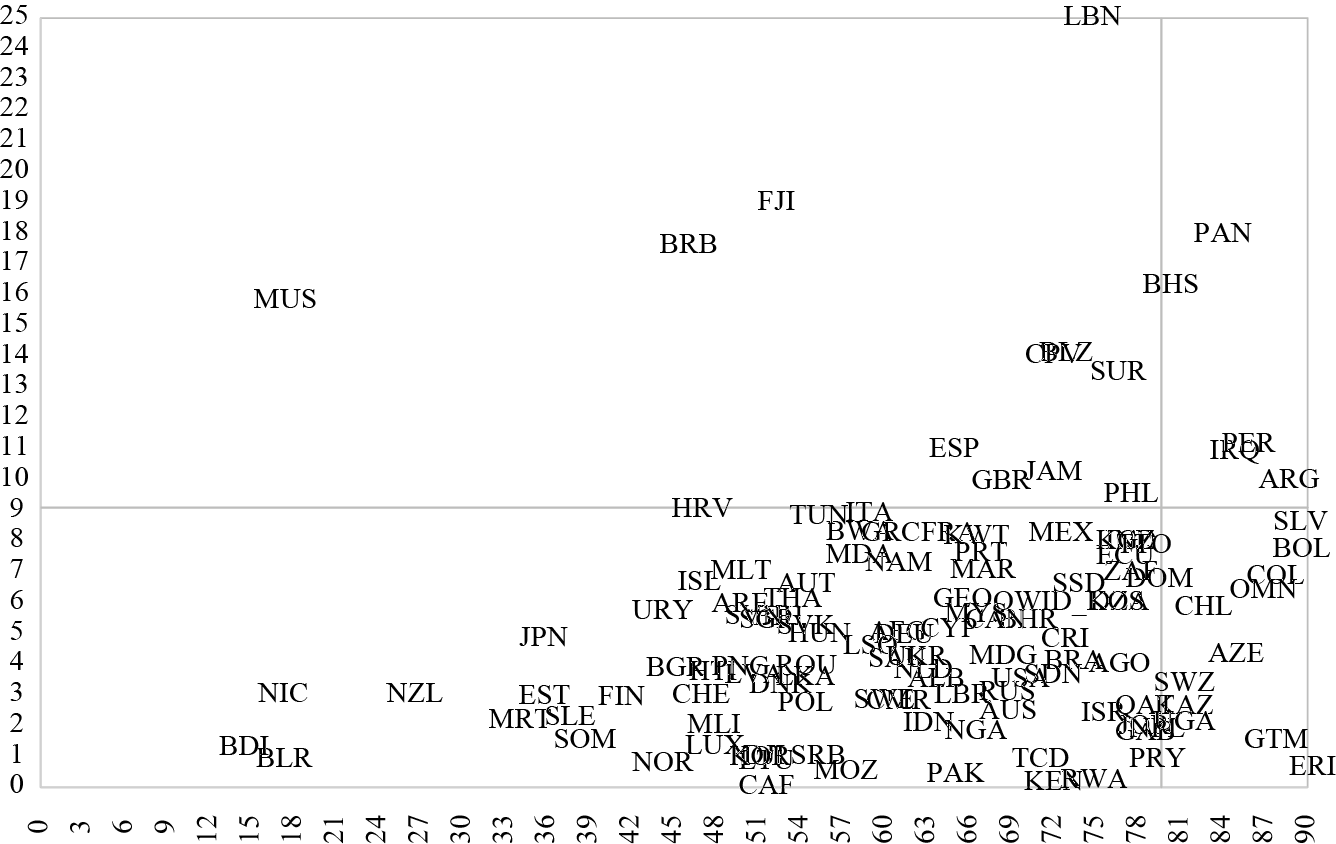
Figure 2.
Relationships between the Confinement Index (Horizontal Axis) and the Fall in GDP in 2020 (Vertical Axis)
Source: Own elaboration based on the University of Oxford and the IMF.
The lower-left quadrant includes countries with GDP falls below 9.09% and low or moderate confinement rates (below 79.61). This quadrant concentrates the largest number of countries such as Mexico, Italy, Brazil, France, Uruguay, Japan, the United States, and Russia, among others. This behavior was the norm, the standard. The lower-right quadrant presents countries with low or moderate falls in GDP (below 9.09%) and high rates of confinement (greater than 79.61). Here there are economies such as Chile, Bolivia, Colombia, Guatemala, and Switzerland, among others. Finally, the upper-right quadrant contains economies with the worst performance (falls in GDP above 9.09%) and a high index of confinement (above 79.61). It is the worst location to be placed and only five countries appear: Argentina, Peru, Iraq, The Bahamas, and Panama.
Figure 3 describes the same results as Figure 2, but establishing an ordinal index, which is obtained by multiplying the fall in GDP by the confinement index. The top ten places are for the following countries: Lebanon (1), Panama (2), The Bahamas (3), Belize (4), Suriname (5), Cape Verde (6), Spain (7), Fiji (8), the United Kingdom (9), and Argentina (10). Spain, the United Kingdom, and Argentina are highlighted in this group for their level of economic development.
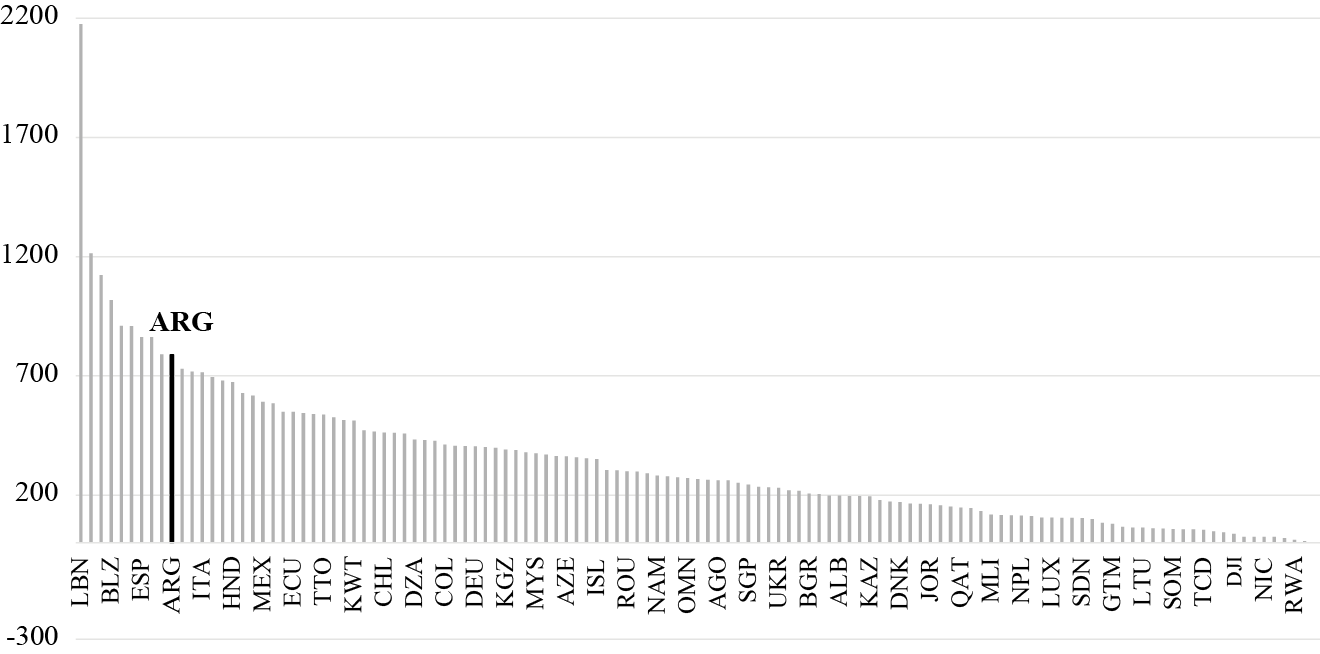
Figure 3.
COVID-19 Ordinal Index 1 (Dec. 2020)
Source: Own elaboration based on the University of Oxford and the IMF.
From this section, Argentina is in the worst location. Among the countries with a sharp fall in GDP (above 9.09%), there are nations with similar drops in economic activity, but with mild confinements, as is the case with the United Kingdom and Spain. That is, with less severe confinements they had similar falls. On the other hand, when analyzing the countries with high confinements rates/indexes (above 79.61), nations such as Chile, Colombia, and Bolivia are found, which registered minor falls in GDP.
V. CONFINEMENT AND DEATHS
Another aspect to evaluate is the relationship between deaths per million inhabitants and the Oxford University Confinement Severity Index. The variable “deaths per million inhabitants” is used to avoid the “scale effect” of countries with large numbers of inhabitants, such as Brazil and the United States, where deaths in absolute numbers are higher than countries with lower population levels, as is the case of Argentina. By normalizing per million inhabitants, this difficulty is corrected, and the economies are evaluated in a homogeneous way from the health point of view. The results, as will be shown later, are like those obtained previously: Argentina is in the most negative area of Figure 4.
The largest number of countries is in the lower-left quadrant, where there are low confinement rates (below 79.61) and moderate or low deaths per million inhabitants (below 830.34). These are most of the countries of the sample, such as Sweden, Poland, Ecuador, Canada, Russia, Paraguay, Greece, Japan, and Germany, among others.
In the upper-left quadrant, there are countries with moderate or low confinement rates (below 79.61) and a high number of deaths per million inhabitants (greater than 830.34). This quadrant presents nations such as the United States, Brazil, the United Kingdom, Italy, Spain, and France, among others.
The lower-right quadrant covers countries with low deaths per million inhabitants (below 830.34) and high rates of confinement (above 79.61). Few economies are highlighted here, such as Bolivia, Iraq, Uganda, Guatemala, and The Bahamas, among others.
The upper-right quadrant describes the countries with the worst possible performance: high confinement rates (greater than 79.61) and high deaths per million inhabitants (greater than 830.34). In this case, this group consists of Argentina, Peru, Panama, Chile, and Colombia.
The governments of Bolsonaro and Trump received great criticism for their health policy in the face of the pandemic. However, as data shows, deaths per million inhabitants do not differ much from those of countries that applied a different policy, such as Argentina, which had more deaths per million inhabitants than Brazil (948 compared to 901) and slightly less than the United States (948 with respect to 1030).
Based on Figure 4, countries with high numbers of deaths, such as the United States and Brazil, registered moderate or low confinement rates, while Hungary and Argentina, with the same number of deaths, had different confinements (in the first case, it was milder, while in the second one it was stronger). On the other hand, by analyzing the confinement, countries with the same severe confinement as Argentina registered fewer deaths (Bolivia, Guatemala, and Slovenia).
When examining the variables using the ordinal index (which was constructed analogously to the previous point), Figure 5 shows the ten countries with the worst performance: Peru (1), Argentina (2), Panama (3), Colombia (4), the United States (5), the United Kingdom (6), Chile (7), Italy (8), Bolivia (9), and Spain (10). Argentina and Peru are the main representatives of Latin America, while Italy, Spain, and the United Kingdom are the ones of Europe.
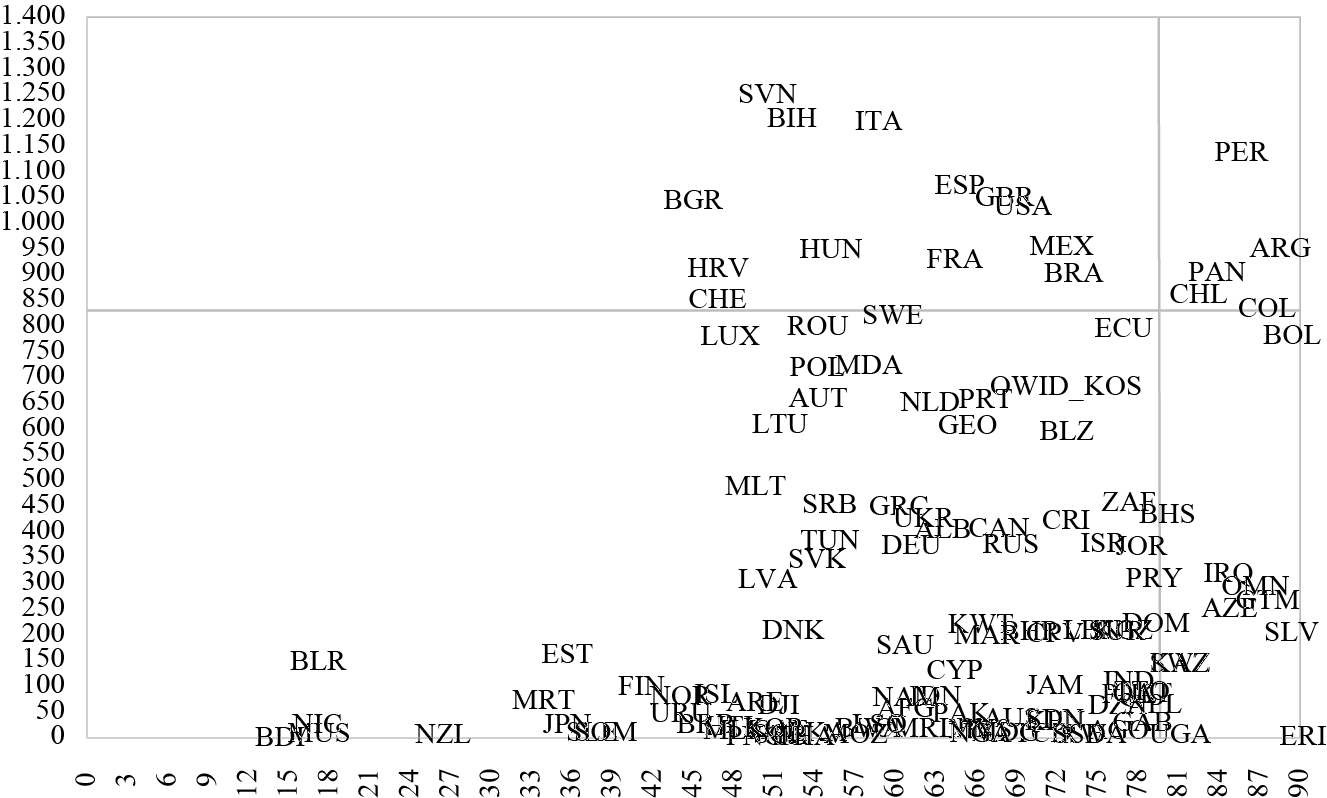
Figure 4.
Relationship between the Confinement Index (Horizontal Axis) and Deaths per Million Inhabitants, Dec. 2020 (Vertical Axis)
Source: Own elaboration based on the University of Oxford and www.ourworldindata.org
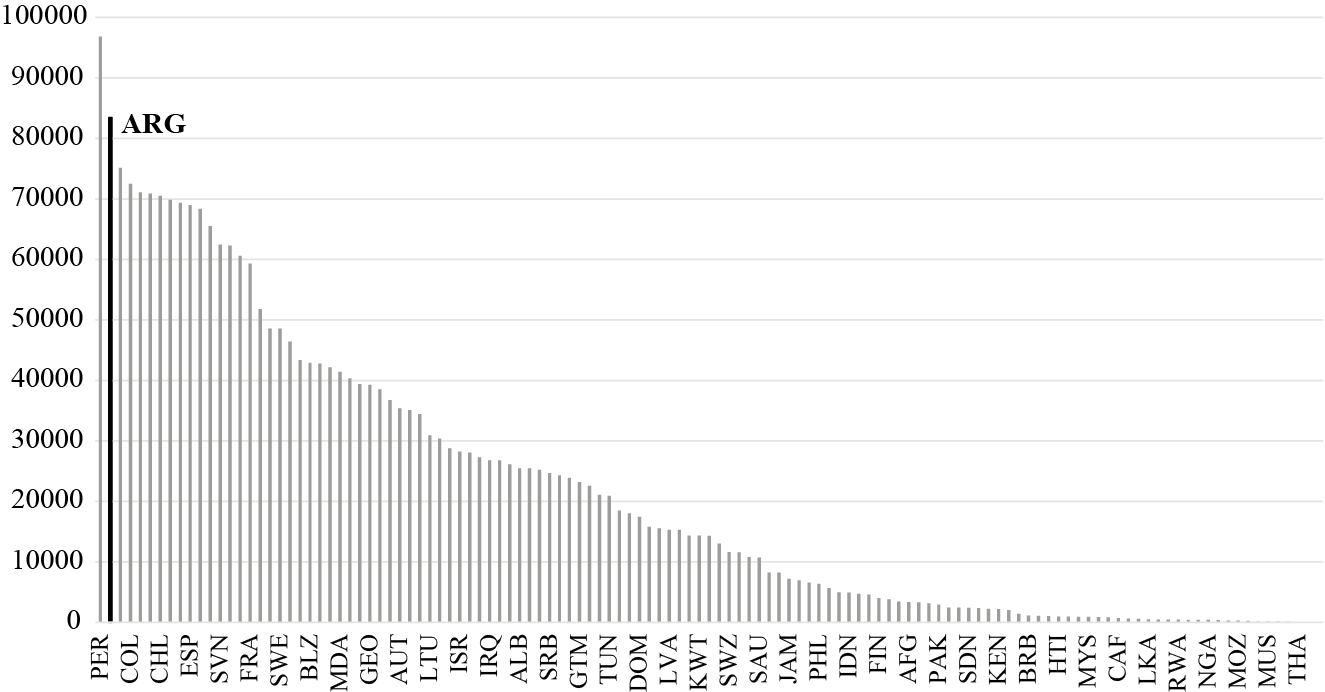
Figure 5.
COVID-19 Index 2 (Dec. 2020)
Source: Own elaboration based on the University of Oxford and www.ourworldindata.org
VI. DEATHS AND FALL IN GDP
Finally, this section closes the circle. Figure 6 describes the relationship between the fall in GDP and deaths per million inhabitants to analyze, in the same figure, the contraction of economic activity and deaths per million inhabitants. Deaths per million inhabitants are represented on the abscissa axis (horizontal axis), while the vertical axis shows the fall in GDP in absolute value.
The upper-left quadrant analyzes countries with a sharp fall in GDP (above 9.09%) and low and moderate deaths per million inhabitants (below 830.34). This group contains very few countries, such as Iraq, Belize, The Bahamas and Barbados, Jamaica, and Suriname, among others. It is not a representative area of what happened in the world.
The lower-left quadrant encompasses the largest number of countries, with moderate and low deaths (below 830.34) and low or moderate falls in GDP (below 9.09%). They were the most frequent cases or the norm. Here, there appear Latin American economies, such as Paraguay, Ecuador, and Bolivia, and developed countries, such as Greece, Russia, Poland, Canada, and Luxembourg, among others.
The lower-right quadrant with significant numbers of deaths (greater than 830.34), but low and moderate falls in GDP (below 9.09%). Here, health aspects were more dramatic than the economic ones. This group comprises countries such as Italy, Brazil, Mexico, France, Chile, Colombia, and the United States, among others.
The upper-right quadrant contains the group with the worst characteristics. This represents the countries that registered the greatest falls in GDP (above 9.09%) and the highest deaths per million inhabitants (above 830.34). They were the most affected by the pandemic, both in health and economic issues. As in the previous analyses, Argentina, the United Kingdom, Peru, Spain, and Panama are located there.
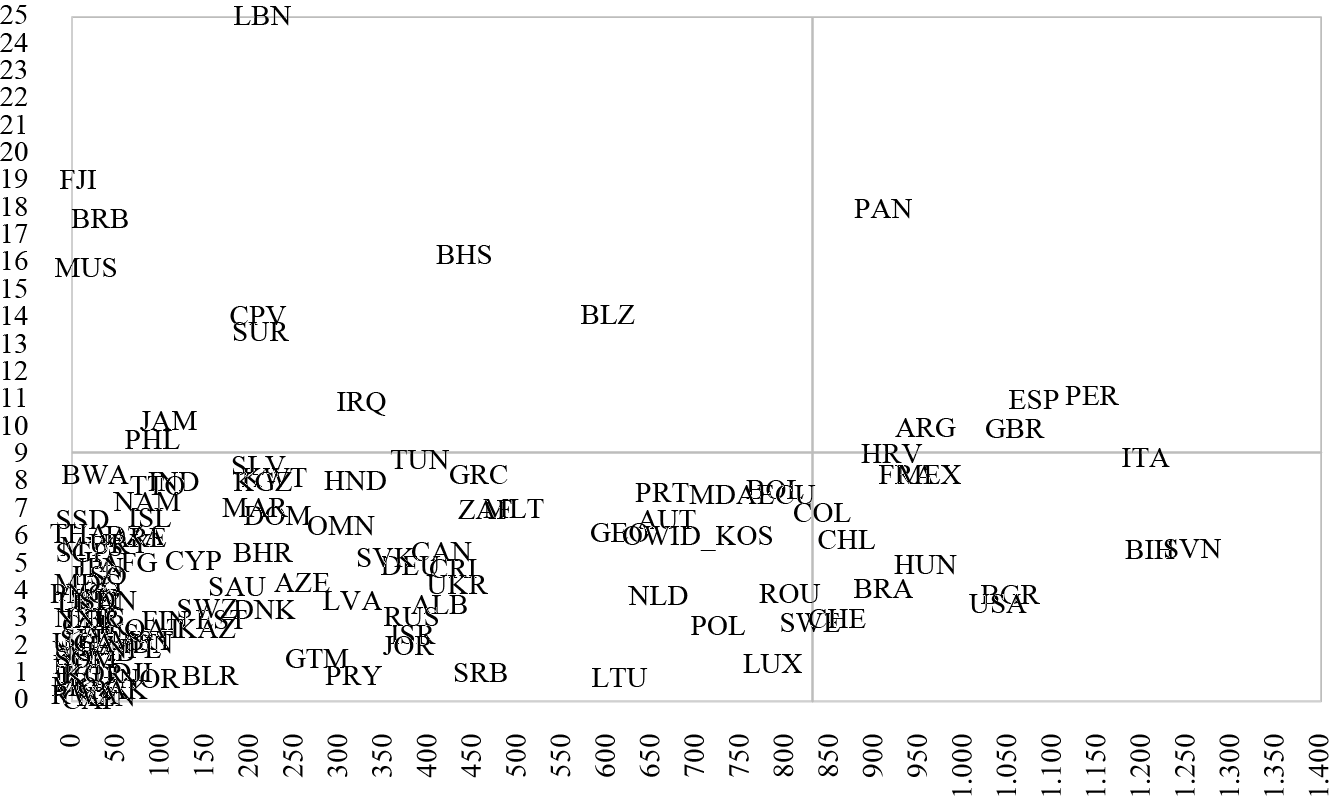
Figure 6.
Relationship between Deaths per Million Inhabitants (Horizontal Axis) and the Fall in GDP in 2020 (Vertical Axis)
Source: Own elaboration based on the University of Oxford and the IMF.
When analyzing countries with sharp falls in GDP, those with similar setbacks to Argentina, but with fewer deaths are found. On the other hand, in relation to deaths, several countries registered the same number of deaths, but with much lower GDP falls, as are the cases of Brazil and the United States.
As a closing of this section, the ordinal index for this analysis is presented in Figure 7. Countries with the worst ten positions are Panama (1), Peru (2), Spain (3), Italy (4), the United Kingdom (5), Argentina (6), Belize (7), Croatia (8), Mexico (9), and France (10). Again, Peru and Argentina are the main countries with the worst figures in Latin America, while Spain, the United Kingdom, and Italy are those in Europe.
VII. VACCINATED POPULATION AS A PERCENTAGE OF THE TOTAL POPULATION
This section analyzes the vaccination plan of each government through the percentage of vaccinated population, before the beginning of the third wave in Europe and the second wave in Latin America on March 22nd, 2021. As the IMF (2021) argues, multilateral cooperation on vaccines to ensure adequate production and timely universal distribution will be crucial to prevent shocks in developing countries.
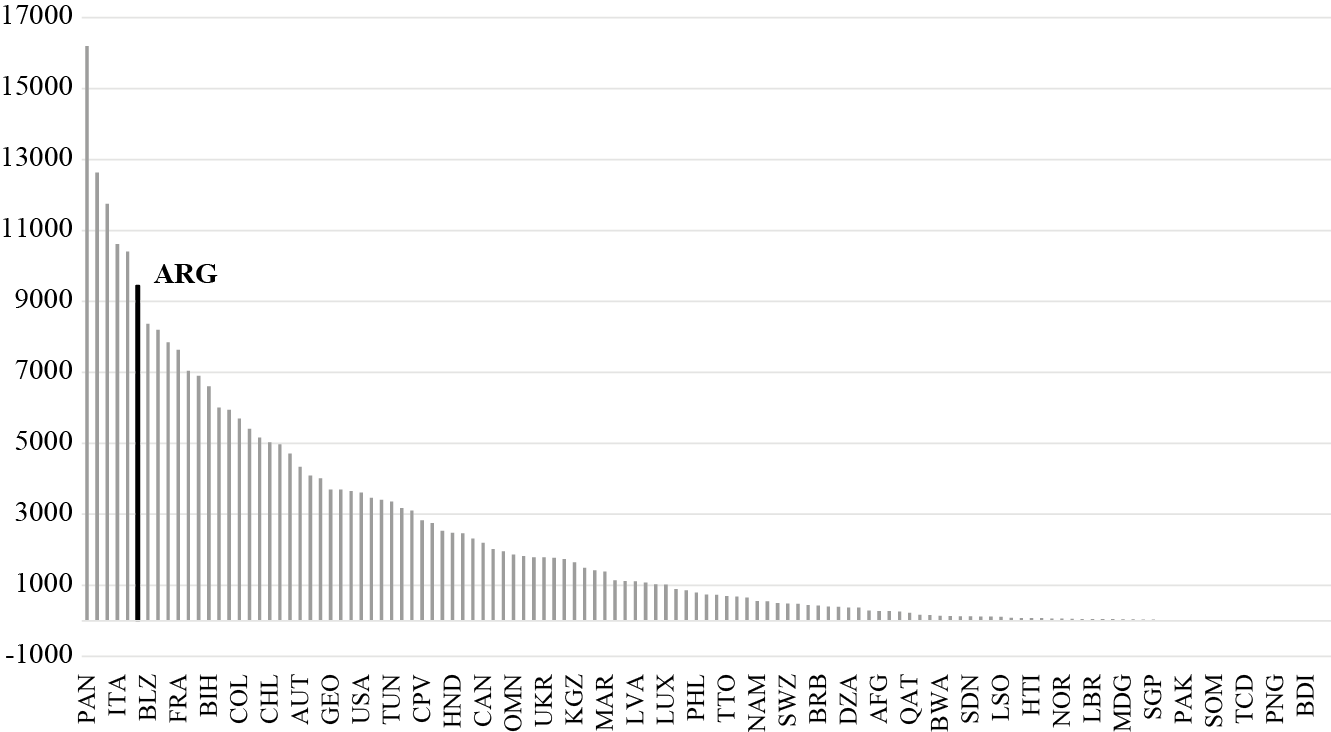
Figure 7.
COVID-19 Index 3 (Dec. 2020)
Source: Own elaboration based on the University of Oxford and the IMF.
Figure 8 describes the proportion of vaccinated people per country, from the highest to the lowest. It is observed that Israel inoculated 113.6% of its population and this is an extraordinary case. It is followed by the Seychelles (98.6%), the United Arab Emirates (72.9%), and the Maldives (61.8%), the only nations that are above 50%. Then, there are countries such as Chile (46.5%), Bahrain (45.6%), and the United Kingdom (44.5%), with values higher than 40% (but below 50%). Of our analysis group, Spain —like many European countries— is between 10% and 20% (its percentage was 12.9%). Practically all Latin American economies are below 10%: Uruguay (8.9%), Argentina (7%), Brazil (6.5%), Mexico (4.5%), Colombia (2.3%), and Peru (2%).
A striking aspect is that certain vaccine-producing countries, such as Russia and China, have vaccinated a small proportion of their population (5.7% and 5.1%, respectively).
An interesting aspect of Figure 8 is that, assuming a cut of 10%, Panama, Peru, and Argentina are located below this level and are among the countries with the lowest proportion of vaccinated population (in addition to being in a terrible position in the other indicators).
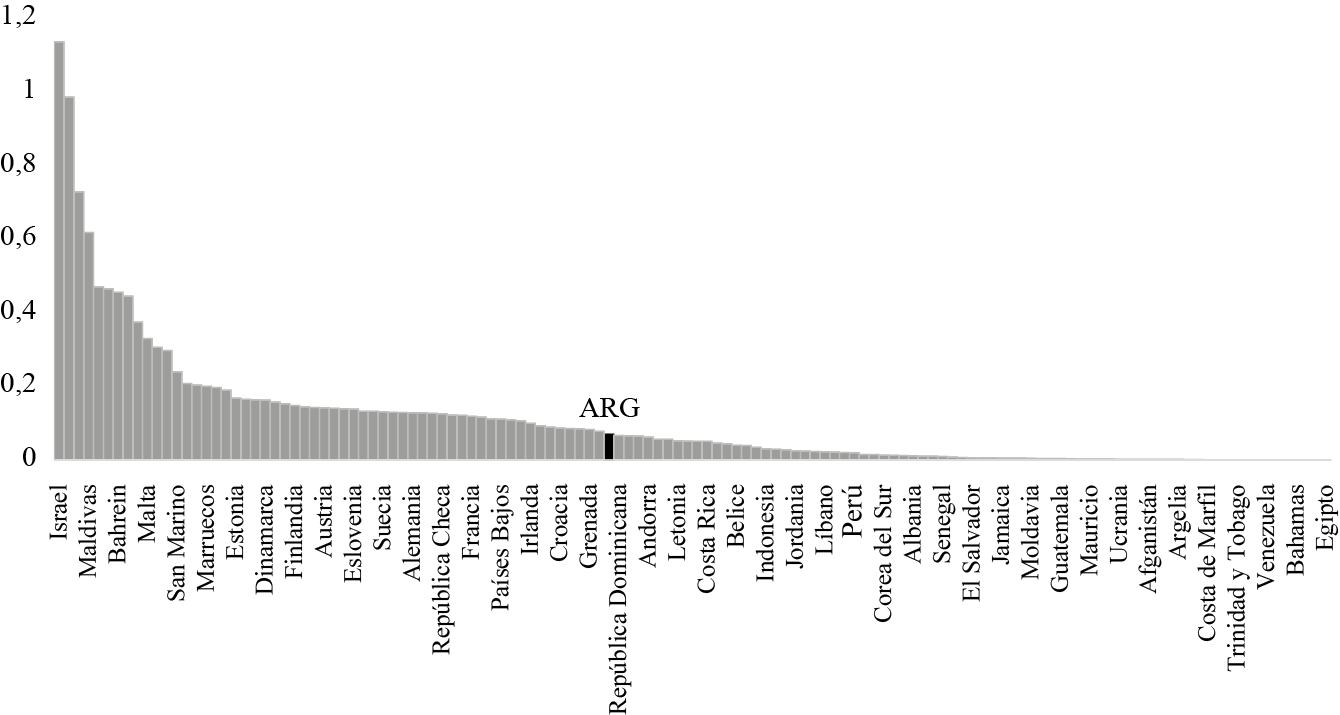
Figure 8.
Proportion (%) of Vaccinated Population
Source: Own elaboration based on https://ourworldindata.org
VIII. EVALUATION OF RESULTS IN ARGENTINA AND THE WORLD
From the previous sections, a common denominator appears2. Regardless of the indicators or variables that are correlated, Argentina is in the worst quadrant in all cases. Considering GDP and confinement, the place is shared with Peru, The Bahamas, Iraq, and Panama. Regarding deaths and confinement, Argentina shares the group with Peru, Chile, Colombia, and Panama. On the other hand, in relation to the fall in GDP and deaths, Argentina is also in the worst performing group along with the United Kingdom, Peru, Spain, and Panama. The severe confinement proved not to resolve the impact of the deaths in relative terms. Argentina had higher deaths per million inhabitants than Brazil and slightly less than the United States. Finally, as regards the proportion of vaccinated population, countries such as the United Kingdom, Chile, and Spain are not present in the critical group, but Argentina, Peru, Colombia, The Bahamas, Panama, and Iraq remain (see Table 2).
In this way, the pandemic has had a considerable impact on Argentina (along with Peru and Panama) compared to a wide sample of countries in the world, regardless of the indicators analyzed in this study: confinement, economic activity, deaths, and vaccination. Argentina, Peru, and Panama are in the four indicators analyzed; Iraq, Colombia, and The Bahamas are in two of those indicators; while Spain, Chile, and the United Kingdom fall into only one category. No country meets three categories, that is, there is no gray area.
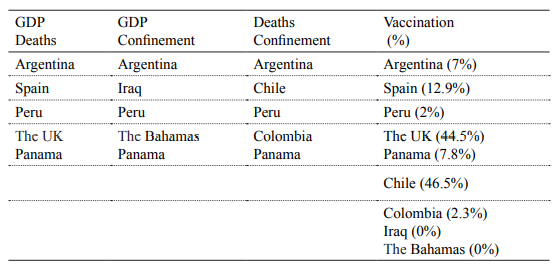
Source: Own elaboration.
In summary, regardless of the four indicators analyzed in this study, Argentina is ranked as one of the worst countries in the world when dealing with the COVID-19 pandemic. In 2020, its fall in GDP doubled the average contraction of the selected countries; deaths per million inhabitants tripled the average, and the confinement severity index was 40% above the average.
CONCLUSIONS
The COVID-19 pandemic has had a profound economic, political, health, and technological impact and has triggered the largest global crisis since the postwar period. Faced with an unknown virus and with laboratories working against the clock to produce an effective and efficient vaccine, governments have implemented different measures to minimize economic, health, and social damage to the population.
The most used measures were strongly aggressive confinement processes —restriction to the mobility of factors— since March 2020 to reduce infections, prepare the health system wait for the availability of vaccines in quality and quantity
The data published by different institutions and international organizations have shown heterogeneous results between countries and regions on the treatment of the pandemic by governments.
Four variables were used to describe the economic and health impact of the COVID-19 crisis: fall in GDP, confinement severity index, deaths per million inhabitants, and vaccinated people as a proportion of the total population. From the data and after drawing a representative sample of 123 countries in the world, Argentina proved to be in the four indicators in the worst places, forming a group with Peru and Panama. Iraq, Colombia, and The Bahamas follow, being in two of these categories, while the United Kingdom, Spain, and Chile only meet one category. Of the nine countries with the worst performance, six belong to Latin America, two to Europe and one to Asia.
In the case of Argentina, the severe confinement did not reduce deaths; they were even higher compared to countries with different strategies (such as Brazil) and slightly lower compared to the United States. If the goal was to minimize the losses of life, this was not achieved. Argentina is in the group of countries with the highest number of deaths, once it is normalized by the size of the population.
At the beginning of the second wave of COVID-19, in Latin America, in general, and in Argentina in particular, the proportion of the vaccinated population is very low compared to other countries, such as the United Kingdom, Spain, Israel, or the United States, which have done better planning and negotiation of vaccines with the laboratories.
In summary, Argentina is located as one of the worst countries in the world when dealing with the COVID-19 pandemic. In 2020, its GDP fall doubled the average contraction of the 123 countries; deaths per million inhabitants tripled the mean, and the confinement severity index was nearly 50% above the average.
REFERENCES
European Central Bank (2020). Unequal scars – distributional consequences of the pandemic. 18 September Speech. Retrieved from https://www.ecb.europa.eu/press/key/date/2020/html/ecb.sp200918~8aaf49cd79.en.html
International Monetary Fund [IMF]. (2021). After-Effects of the COVID-19 Pandemic: Prospects for Medium-Term Economic Damage. In World Economic Outlook: Managing Divergent Recoveries. (Chapter 2). Retrieved from https://www.elibrary.imf.org/view/books/081/29821-9781513575025-en/ch02.xml
Financial Times (2021). Covid-19: The global crisis in data. Retrieved from https://ig.ft.com/coronavirus-global-data/
McKibbin, W., & Fernando, R. (2020). The Global Macroeconomic Impacts of COVID-19: Seven Scenarios. (CAMA, Working Paper No. 19).
Office for National Statistics [ONS]. (2021). International comparisons of GDP during the coronavirus (COVID-19) pandemic. Retrieved from https://www.ons.gov.uk/economy/grossdomesticproductgdp/articles/internationalcomparisonsofgdpduringthecoronaviruscovid19pandemic/2021-02-01
World Bank (2021). Global Economic Prospects. A World Bank Group Flagship Report. doi: 10.1596/978-1-4648-1665-9
ANNEX: COUNTRIES
Notes