Research articles
A STUDY TO DETERMINE THE PERCEPTION LEVELS OF EVENTS ORGANISED SPECIFICALLY FOR TOURIST DESTINATIONS
ESTUDIO PARA DETERMINAR LOS NIVELES DE PERCEPCIÓN DE LOS EVENTOS ORGANIZADOS ESPECÍFICAMENTE PARA DESTINOS TURÍSTICOS
A STUDY TO DETERMINE THE PERCEPTION LEVELS OF EVENTS ORGANISED SPECIFICALLY FOR TOURIST DESTINATIONS
Turismo y Sociedad, vol. 38, pp. 133-164, 2026
Universidad Externado de Colombia
Received: 25 September 2025
Revised document received: 31 May 2025
Accepted: 14 August 2025
Abstract: The promotion and organization of leisure-related events attract potential tourists, interested in such activities, to the regions where these events are held, thus ensuring the development of tourism. In the context of contemporary tourism, cultural, artistic, and sporting events are considered effective strategies for creating an image of the destination where they take place. The aim of this study is to examine the participants’ experiences at a specific event, the 3rd Eşme Quince Festival, in order to identify differences in their participation and their perception of it, using the participants’ sociodemographic characteristics and specific dimensions (affective, physical, cognitive, and innovation) as study variables. To this end, 392 festival attendees were surveyed, and their experience was analyzed from various dimensions: affective, physical, cognitive, and innovative. The results show that certain sociodemographic variables of the participants, such as age, gender, education level, and experience, influenced both their participation in the event and their perception of it; in contrast, their income level did not significantly affect these aspects.
Keywords: Destination, event, festival, Eşme (Kocaeli / Türkiye).
Resumen: La promoción y la organización de eventos relacionados con el ocio atraen a turistas potenciales interesados en ese tipo de actividades a las regiones donde se celebran, lo que garantiza el desarrollo del turismo. En el marco del turismo contemporáneo, los eventos culturales, artísticos y deportivos se consideran estrategias eficaces para crear una imagen del destino donde se llevan a cabo. Este estudio tiene como objetivo examinar la experiencia de los participantes en un evento específico, el III Festival Eşme Ayva, para identificar diferencias en su participación y en su percepción del festival, tomando como variables de estudio las características sociodemográficas de los asistentes y determinadas dimensiones: afectiva, física, cognitiva y de innovación. Con este propósito, se encuestó a 392 asistentes al festival, cuya experiencia se analizó desde diversas dimensiones: afectiva, física, cognitiva e innovadora. Los resultados evidencian que ciertas variables sociodemográficas de los participantes, como la edad, el género, el nivel educativo y su experiencia, influyeron tanto en su participación en el evento como en su percepción de este; por el contrario, su nivel de ingresos no afectó estos aspectos significativamente.
Palabras clave: Destino, evento, festival, Eşme (Kocaeli / Turquía).
1. Introduction
From the perspective of the tourism industry, the relationship between events and destinations is of great importance. In addition to the natural and cultural wealth that destination offers to draw tourists, organised events are seen as an effective way of attracting them. Events have become an essential reason for many tourists’ travel plans. For example, world-renowned festivals held around the world encourage tourists to plan their trips at certain times of the year, thus making those destinations more preferred by tourists. Due to the increasing importance of niche markets in the tourism industry, destination planners have focused more closely on revising traditional marketing approaches and directly analysing consumers.
The image created of a destination through the organization of events is valuable to the target audience and provides a competitive advantage for the destination, making it preferred over its competitors. A review of the literature suggests that the elements that make up the destination image are generally affective and cognitive factors, and that the overall image perception is formed by the individual’s interpretation of these factors. The aim of this study is to examine the participants’ experiences at a specific event, the 3rd Eşme Quince Festival, in order to identify differences in their participation and their perception of it, using the participants’ sociodemographic characteristics and specific dimensions (affective, physical, cognitive, and innovation) as study variables.
Looking at studies on destination image, it is clear that the industry has a wide range of assessment tools at its disposal and that various scientific tests have been attempted; however, the differences perceived by tourists in terms of socio-demographic characteristics have yet to be adequately addressed. As a result of developments in education, the economy and social rights, individuals have increased their opportunities for self-improvement and differentiation in terms of socio-demographic characteristics. At a time when the tourism industry is becoming increasingly important in terms of diversity and competition, tourists’ perceptual changes in destination images are being closely monitored.
The first part of the study provided information on the subjects of the study. In the section where the importance of events as an important niche in the tourism industry is assessed in terms of the relationship between events and destinations, information is provided on the source of motivation for the study. The second part of the study includes information on tourism, destination, and image, elements that create destination image; and literature studies on event concepts. In the third part, based on the information obtained from the participants of the 3rd Eşme Quince Festival and the above-mentioned studies, perceptual differences in destination image and event experience were identified among the participants in terms of socio-demographic characteristics. The hypotheses proposed in this study were compared and analysed with the research results. In the research discussion, conclusions, and recommendations section, the information obtained on whether there are differences in the event experience and image perception of participants according to their socio-demographic characteristics was discussed in similar and different aspects to the literature. In addition, various recommendations were made to institutions, organisations, and researchers for future studies on this topic.
2. Literature Review
Following a literature review, it was found that detailed studies have been carried out on the concept of destinations, characteristics of destinations, destination image, components of destination image, sources of information about destinations, elements of destination attraction, the concept of events, the role of events in destinations, types of events, the relationship between events and tourism, the concept of festivals, the relationship between festivals and tourism, the impact of festivals on the image of tourist destinations, and the experiences of event participants according to their socio-demographic characteristics. These studies are briefly summarised below.
Buhalis (2000) evaluated destinations as areas of societal and individual importance, while Özdemir (2007) identified them as places that can appeal to tourists with different interests. Türkay (2014) defined destinations as areas where people travel for various reasons because of the attractions they possess. Artuğer and Çetinsöz (2014) explained the influence of image perception in directing preferences and choices. Akyurt and Akay (2009) evaluated the image of the offered goods and services as an essential factor affecting consumers’ purchase intentions and satisfaction. Tolongüç (1992) defined image as the perceptions formed by the experiences, value judgments, and possibilities of individuals. Yamaç (2014) described destination image formation as the visual and symbolic manifestation of any object, sequence of events, or thought, and noted that the image structure consists of both perceptual and affective evaluations.
From a different perspective, Güçlü (2017) found that tourists create preferences for destinations, products, and services based on the sources of information they acquire and the quality of information. Beerli and Martin (2004) explained the influence of primary and secondary information sources, as well as personal factors on image formation. Yaraşlı (2007) and Öztürk (2017) investigated how different information sources and travel motivations vary according to tourists’ previous experiences. Billge Doğanlı (2006) described the need for destinations to position themselves advantageously against competitors, identify the consumer market well, and guide it positively, while Gunn (1972) suggested that a gradual image formation model with organic images, stimulated images, and modified image steps could be valid for destination image formation.
Baloğlu and McCleary (1999) stated that the destination image is created from three components: cognitive, general, and affective. Oran (2014) provided information on how individuals psychologically and socially evaluate the destination image after traveling, while Murphy (2000) explained the effect of tourist behaviour on destination image formation, detailing the behaviour and attitudes of tourists before traveling. Şengül et al. (2018) systematically described the values offered to tourists, including attraction elements as image elements, while Ritchie and Crouch (2003) explained the importance of natural resources and attractions hosted by tourism destinations in terms of marketing and attraction. Komilova et al. (2021) emphasised the importance of physical geography in terms of attraction, while Morrison (2018) and Latypova (2011) assessed the significance of historical, cultural, and natural beauty of the region for the destination. Tırnakçı et al. (2018) described the captivating experience of tourists visiting natural landscapes, while Grigarova and Arabska (2014) elaborated on the details of natural landscapes.
Toy and Türkeş (2022), while explaining the impact of climate on visits, emphasised the attractiveness of plant and animal diversity, according to Arslan (2005). Soykan (1999) assessed the impact of sports and outdoor activities on the image and attractiveness of destinations. Cronin and O’Connor (2003) explained tourists’ desire to explore different cultures and historical sites, while Lennon (2017) emphasised historical sites. Hernández-Mogollón et al. (2014) emphasize as determinants of the image and attractiveness of tourist destinations cultural values, and activities; Sarikaya and Er (2012), traditional handicrafts; Demir et al. (2019), gastronomy; Ekenyazıcı (2005), architecture; and Kurnaz (2013), local beliefs and rituals. İçellioğlu (2014) emphasised the need for destinations to have sufficient infrastructure in terms of attractiveness. In this context, Gutiérrez and Miravet (2016) studied transportation options; Lickorish and Jenkins (1997), accommodation facilities; Erdem and Akyürek (2017), food and beverage options; Özgören Şen and Öztek (2017) and Görgün (2011), entertainment businesses; Aydın (2012), health services; and Ayaş (2007), communication systems. Şengül et al. (2018) examined the details of infrastructure facilities of destinations. In this regard, Emekli (2006) examined cultural and historical values; Rozycki and Dryglas (2014), natural environment elements; and Kılınç (2014), Karasu (1990), Aymankuy (1997), and Demirkapı (2017), activities such as trade fairs and business centres that have an impact.
In addition to the geographical and cultural history, and natural and man-made elements of attractiveness mentioned in the literature, the factors that make destinations effective and competitive are the activities associated with them. Eskin et al. (2017) studied activities in the natural environment (fishing, canoeing, surfing, diving, paragliding, hiking, and rock climbing, etc.); Güngör and Arslan (2004) and Morice and Violier (2009), historical and cultural activities (museums, art galleries, local festivals, etc.); Tuna (2018), and Dridea and Strutzen (2008), amusement parks (theme parks, cinemas, zoos, theatres, water parks, etc.); Salici and Özdaşlı (2016) and Papanikos (2015), sports activities (golf, tennis, soccer, swimming, basketball, etc.); Günal (2005), and Kargiglioğlu and Kabacık (2017), dining options (cafes, restaurants, local markets, food festivals, etc.); Atak et al. (2017), music festivals (rock, pop, jazz, blues, classical music, etc.); Boğan and Sarıışık (2016), shopping options and opportunities.
Ercan (2020) analysed the attractiveness elements of destinations in online travel guides through the example of “Türkiye Home”, and concluded that the historical structures and natural beauty of cities are the most prominent attractiveness elements in promotional information. Aybarç et al. (2019) concluded that, within the framework of public incentive policies for tourism in Turkey, regions that invest in tourism and are more active provide benefits to themselves and their surroundings in terms of tourism. Karaküçük (1997) defined activities as those that individuals engage in during their leisure time to achieve satisfaction, while Getz (2008) defined activities as pre-planned, themed, and regularly invited. Ekin (2011) investigated making participants feel special during an activity. Huang (2017) investigated the motivational effects of activities and their importance in competition and for tourism stakeholders. Van der Wagen (2005) emphasised that activities providing unforgettable experiences require long and careful strategies, involve the joint work of many teams, and entail high risks, and thus can be considered activities. Kömürcü (2013) examined the processing of sports activities with religious motifs into heroic stories.
Apaydın (2011) examined sports events to enhance the reputation of destinations, increase marketing power, and create employment opportunities. Ginsburgh and Noury (2008) explained in their study that arts and entertainment events bring significant benefits to destinations. Eryılmaz (2011) investigated the impact of business-oriented scientific events, which bring professionals together, offer business opportunities, and facilitate knowledge exchange between destinations. Ekin (2011) studied the changes and impacts in destinations where political and cultural events were held. In a study on festivals and their connection to tourism, Picard and Robinson (2006) analyzed the influence of festivals on destinations. Çoban and Süer (2018) argued that such events are organized to attract tourists to a region, thus contributing to its overall appeal.
Raj (2004) explained the effectiveness of festivals and events in helping tourists to better understand and experience the world. Saçlı and Ersöz (2019) examined the contribution of festivals to the destination image. Özgürel et al. (2015) investigated the relationship between local cultures and festivals. Aktaş and Kızılcalıoğlu (2020) found that tourists have a positive perception of destinations through events. Kahraman (2020) analyzed the impact of festivals on the number of tourists. Eryılmaz and Yücetürk (2018) explored the relationship between events and media information. Dimanche (2002) discussed the blending of memories by tourists who experience different cultures during events. Ercan and Civelek (2020) examined the contribution of events to the local economy. Social events that bring people together for a specific reason, with entertainment as a central theme, contribute significantly to the cultural continuity of society. While events aim to make the destinations where they are organised attractive, they also contribute to the planning and marketing of regional tourism (Getz, 1997).
Festivals allow strangers to come together for everyday purposes and get to know each other (Özgürel et al., 2015). The cultural, social, and destination image perceptions observed among festival visitors can measure the satisfaction of participants. Therefore, attitudes towards festivals and events are indirectly important in revealing the behavioural intentions that individuals may have towards the destination (Saçılık & Çevik, 2017). Knowing the sociodemographic characteristics of festival attendees may be necessary to make relevant events sustainable (Carvache-Franco et al., 2020). Sociodemographic characteristics
-such as age, gender, educational status, and income status- are factors that individuals acquire from birth or throughout their lives. Based on the literature review, attempts have been made to observe the positive or negative role of socio-demographic characteristics in individuals’ decisions.
Monteiro and Borges (2015) investigated the impact of sociodemographic characteristics and customer loyalty on the tourism sector and the effect of seven sociodemographic characteristics (age, gender, marital status, education, occupation, income status and nationality) on tourism preferences. They found that six socio-demographic characteristics directly influenced tourism preferences. As the gender of the participants did not have a significant effect on tourism preferences, the research hypotheses were partially accepted. In the study by Almeida (2020), which aimed to identify the attractions that the city had chosen for tourists, it was found that participants belonging to the middle-low-income and middle-low education groups in Porto were positively differentiated from other participants, and their participation in the event was more intense. In the study by Bekar and Kılıç (2014), which investigated the participation of domestic tourists in gastronomic events in Hatay province based on income status, it was concluded that this variable is essential for event participation and decision-making motivation for tourist activities, with individuals with higher income preferring “local and select” restaurants compared to others, and showing more interest in significant local products.
When tourism events result in satisfactory outcomes, they provide opportunities for residents and visitors to express positive opinions about their lives (Lee et al., 2015). Guillet et al. (2011), in their study of Hong Kong residents, claimed that different age groups varied in travel expenditure decisions, destination selection, and length of stay during tourism activities undertaken by Hong Kong tourists between 2005 and 2010. In a study by Dryglas and Salamaga (2017), the participation behaviour of Polish citizens in thermal tourism was investigated; participants travelled with three different motivations: for health, cultural, and social purposes. When the reasons for participation were examined in terms of socio-demographic characteristics, it was found that participants’ age, gender, and income level directly influenced the participation process.
In their study of 806 tourists arriving at the Antalya Airport International Terminal, Karakaş et al. (2022) attempted to reveal the differences in destination image perception of different age groups. According to the research, significant differences emerged between age and gender in the perception of destination images. Kusdibyo’s (2022) study of 404 participants in thermal tourism activities found that perceived destination image alone does not activate travel motivation, but does influence destination loyalty. In addition, the study on destination loyalty distinguished participants by gender. In a research by Hammadou et al. (2008) on destination choice and image perceptions of people living in Antwerp (Netherlands), it was found that there were significant differences in decision-making processes in terms of education and marital status when socio-demographic characteristics were examined. In a study by Rodríguez-Rangel et al. (2016), which evaluated events based on tourists’ sociodemographic characteristics, it was observed that, when individuals participated in the same event multiple times, they approached minor problems related to the event (communication breakdowns and transport problems) more positively than first-time participants. Consequently, when tourist groups with similar event experiences do not disrupt comfort and planning flow, the enjoyment of the event is positively different from that of first-time participants.
3. Research Methodology and Empirical Findings
3.1 Data Set, Model and Methodology
After reviewing the literature, we determined that changes in socio-demographic characteristics lead to differences in sensory perception. Therefore, the following hypotheses were formulated:
H1a: Affective involvement attitudes towards an activity will show a significant gender difference.
H1b: Cognitive participation attitudes towards an activity will show a significant gender difference.
H1c: Physical participation behaviour in an activity will show a significant gender difference.
H1d: Experience of innovation in an activity shows a significant gender difference.
H2a: Affective participation attitudes towards the activity show a significant difference among different age groups.
H2b: Cognitive participation attitudes toward the activity show a significant difference between different age groups.
H2c: Attitudes towards physical participation show a significant difference between the different age groups.
H2d: Experience of innovation in an activity shows a significant difference between different age groups.
H3a: Affective attitudes to participation in activities show significant differences between different income groups.
H3b: Cognitive attitudes to participation in activities show significant differences between different income groups.
H3c: Physical participation behaviors in activities shows significant differences between different income groups.
H3d: Experience of innovation in the activity shows a significant difference among between income groups.
H4a: Affective participation attitudes towards activities show significant differences between educational groups.
H4b: Cognitive participation attitudes towards activities show a significant difference between different education groups.
H4c: Attitudes towards physical participation show a significant difference between different educational groups.
H4d: Experience of innovation in an activity shows a significant difference among between educational groups.
H5a: The affective participation attitudes of people who have previously participated in the activity before are significantly different from those of people who are participating for the first time.
H5b: The cognitive participation attitudes of people who have previously participated in the activity before are significantly different from those of people who are participating for the first time.
H5c: The attitudes to physical participation of people who have previously participated in an activity will be very different from those of people who are participating for the first time.
H5d: The innovation experience of people who have previously participated in an activity will be very different from that of people who are participating for the first time.
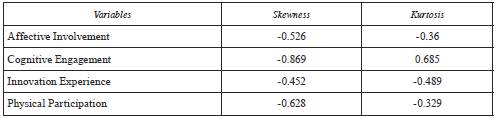
Before analysing the data, it was determined whether they were suitable for normal distribution and whether they met the parametric conditions. Several methods can be used to determine whether data are normally distributed. One method involves calculating the skewness and kurtosis values of the data (Coşkun et al., 2017, p. 159). Table 1 shows the skewness and kurtosis values of the variables used in this study.
Note. Own construction.
The skewness value is expected to be within the range of ±1 (George & Mallery, 2010) and the kurtosis value is expected to be less than ±3 (Sposito et al., 1983) to meet the assumption of a normal distribution (Ercik & Çoban, 2024). It was assumed that the skewness and kurtosis values of the variables in the study were within specified ranges, indicating that the data met the assumption of a normal distribution. Therefore, the data used in this study met the necessary assumptions for multivariate analysis.
The aim of this study is to examine the participants’ experiences at a specific event, the 3rd Eşme Quince Festival, in order to identify differences in their participation and their perception of it, using the participants’ sociodemographic characteristics and specific dimensions (affective, physical, cognitive, and innovation) as study variables. The technique used was a questionnaire. The research population consisted of tourists from Kocaeli and Sakarya provinces who participated in the cited event. Although the study was conducted in the region where the festival was held, the sample was determined by convenience sampling from all individuals who participated directly or indirectly. Convenience sampling consists of the views of individuals selected by the researcher’s observations within the main population (Haşıloğlu et al., 2015). In this study, 401 surveys were conducted face-to-face with the participants, and 9 of the surveys were not evaluated. Data obtained from 392 surveys were analysed.
The reason for choosing the convenience sampling method in the study was the impossibility of reaching the entire population and the long time it would take to reach the participants after random selection. In determining the scope of the research in terms of application, convenience sampling method, which is an non-probability sampling technique, was used due to constraints such as time, cost and accessibility (Altunışık et al., 2012, p. 141). The research scale consists of statements that have been tested for validity, reliability and usability by the team of the Association for Tourism and Leisure Education and Research (ATLAS), founded in 1991 in the Netherlands for education, personnel training, and research in tourism and leisure.
After the final control, the participants who attended the events organised within the framework of the 3rd Eşme Quince Festival were interviewed by an expert team of five academics (three from the Department of Tourism Management, one from the Department of Tourist Guiding, and one from the Department of Recreation Management). The data were collected by means of a survey-the conceptual analysis of the collected data aimed to adequality explain the participants’ views. The data obtained from the research was analysed using SPSS. A five-point Likert scale was used in the survey statements, except for the demographic variables, with responses to the relevant statements ranging from Strongly Disagree (1) to Strongly Agree (5). An arithmetic mean close to five indicates agreement with the statement, and an average close to one indicates disagreement with the statement.
4. Findings
This section first presents the demographic information obtained from the participants and then analyses the results obtained using SPSS.
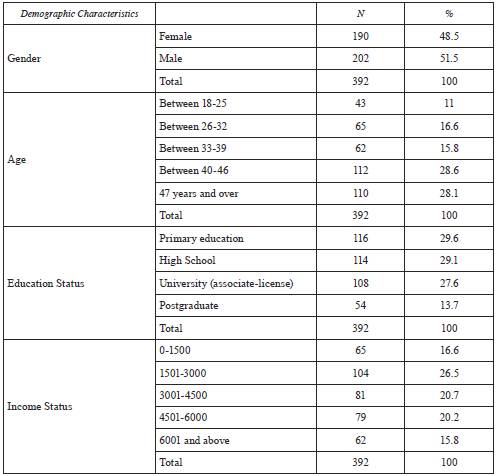
Gender, age, level of education, and average monthly income were used as the demographic variables. The frequency distribution of the demographic variables in the questionnaire is shown in Table 2. Accordingly, 51.5% of the respondents were male, 48.5% were female, 28.6% were in the age group of 40-46 years, 29.6% were primary school graduates, 29.1% were high school graduates, 16.6% had an income between 0-1500₺, and 26.5% had an income between 1501-3000₺.
Note. Own construction.
4.1 Reliability Analysis of the Event Experience Scale
According to Ergin (1995), reliability is expressed as the consistency of the initial results of the measuring instrument determined in relation to similar objects or people, independent of time and people, and at the same time, it is the achievement of the same results when the measuring instrument is retested on different people.
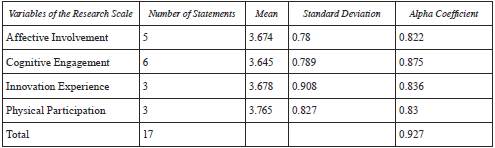
There are several ways to determine the level of reliability of measuring instruments. Among these options, especially in the social sciences, the Cronbach’s Alpha coefficient method is the most commonly used. In this method, the variances of as many expressions as there are in the scale are summed and determined by the ratio of the resulting number to the total variance (Kılıç, 2016). When the Cronbach’s Alpha coefficients belonging to each of the variables listed in Table 3 were examined separately, it was found that the alpha coefficients of the mentioned variables were in the range of at least 0.822-0.875. The fact that these coefficient values are above the reliability threshold of 0.700 (Karakoç & Dönmez, 2014) indicates that each variable is reliable. Furthermore, when the reliability analysis was conducted as a whole scale rather than as a variable, the overall reliability coefficient of the scale was 0.927. Therefore, the internal consistency level of the research scale as a whole was above the threshold, which provides evidence of reliability.
Note. Own construction.
4.2 Structure Validation
The data sets obtained during the research are examined and explained using different methods of analysis in order to determine the construct validity of the results and to explain what these results are related to (Akyüz, 2018). According to the literature reviews on the construct validity and testability of the scale, it is observed that Exploratory Factor Analysis (EFA) is predominantly used among the methods employed. In its simplest terms, EFA aims to achieve a minimum number of variances while maintaining the integrity of understanding multiple items containing abstract characteristics. As a result, a clear and understandable representation of abstract characteristics emerges and through analytical methods such as EFA, researchers can complete their analyses with minimal data loss (Karakoç & Dönmez, 2014).
4.3 EFA Results for the Variables Used in the Study
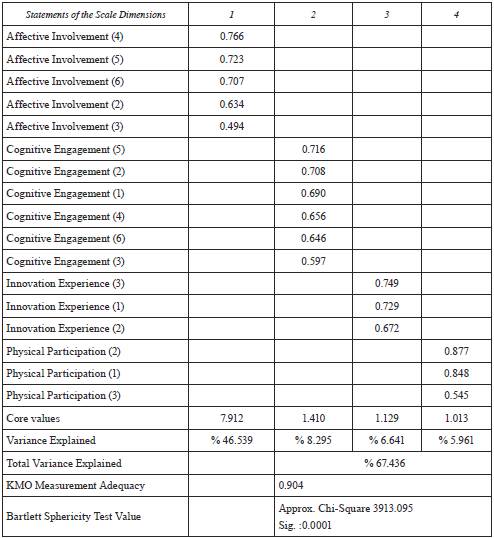
In Table 4, which presents the results of the EFA, the first criteria to be considered are the statistical significance of the Bartlett Sphericity Test (testing the correlation matrix generated from the responses against the unit matrix) and the level of the Kaiser-Meyer-Olkin Measure of Sampling Adequacy (KMO coefficient, which provides an indication of the adequacy of the sample). In this study, the p-value of the Bartlett test was found to be significant at the 0.0001 level, and the KMO coefficient was 0.904. A KMO coefficient of 0.8 or above indicates that the data obtained from the research sample are suitable for factor analysis. Factor loading values of at least 0.300 may indicate that an expression adequately represents a characteristic or variable (Büyüköztürk, 2002).
Note. Own construction.
In this study, the threshold was raised to 0.400. It was found that the terms in the research scale gave sufficient weight to the variables to which they belonged (in the range of 0.494-0.877). However, it was noted that the expression called physical participation (4) remained below this threshold and was excluded from the scope of the analysis. Similarly, the expression affective participation (1) was eliminated because it disrupted the factor structure. Another output examined specifically for AFA is the eigenvalues, which help to obtain fewer variables from many of the expressions on the research scale. Accordingly, the most appropriate number of variables for testing the research hypotheses was determined by considering variables with eigenvalues greater than 1 (Yaşlıoğlu, 2017). Based on this information, four variables with eigenvalues greater than 1 were accessed, and these variables were able to explain 67.436% of the total variance. These variables were ranked according to their contribution to the total variance of the scale as follows: affective participation (explaining 46.539% of the total variance), cognitive participation (8.295%), innovation experience (6.641%), and physical participation (5.961%). In addition, the factor loadings, which indicate the strength of the relationship between the statements in the scale and the variables to which they belong, were also examined.
4.4 Testing the Research Hypothesis
In this study, hypotheses H1 and H5 were tested using an independent samples t-test to understand how much of the differences between these two groups were accidental and significant. Hypotheses H2, H3, and H4 were tested using ANOVA analysis to measure the differences between these groups.
4.4.1 Results of the Analysis for Hypothesis H1
In the field of humanities, the independent sample t-test is used, which is a type of parametric analysis that is beneficial when comparing behaviours such as beliefs, thoughts, and perceptions of two different participant groups that are not related to each other in the same direction or about the study (Ross & Willson, 2017). The results of the independent samples t-test regarding the H1 hypothesis of the study are also presented in Table 5 for gender groups, independent samples t-test, and Levene homogeneity results.
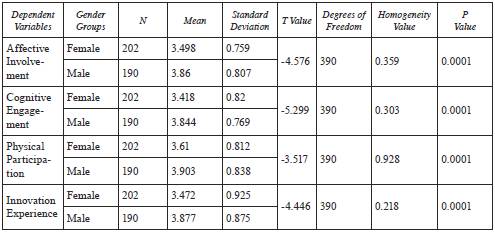
Note. p < 0.050 is significant at the level. Own construction.
Another assumption of parametric analyses, such as the independent samples t-test and ANOVA, is that the variances between the analysis groups are homogeneously distributed. In such studies, it is necessary to test whether there is a significant difference between the variances of the groups of two or more participants. Similar analyses are required to determine whether the group of participants has a homogeneous distribution (the difference in variance between participants can be explained by chance) (Fırat, 1995). Levene’s test can be used for this purpose. If the p-value obtained from Levene’s test is more significant than 0.05, it can be said that the group variances are homogeneous. In this case, it was observed that the variances belonging to the female and male groups were homogeneously distributed for each variable of the activity experience (affective involvement: p = 0.359, p > 0.050; cognitive involvement: p = 0.303, p > 0.050; physical participation: p = 0.928, p > 0.050; innovation experience: p = 0.218, p > 0.050).
As shown in Table 5, respondents’ perceptions of all dimensions of the event experience differed significantly by gender. This difference between the mean scores of female and male participants favoured female participants for each variable. Accordingly, female participants showed more interest in participating in a collective activity affectively, cognitively, and physically than male participants. Similarly, female participants perceived their post-event experience as more extraordinary and unique than male participants. Therefore, hypotheses H1a, H1b, H1c, and H1d were accepted.
4.4.2 Results of the Analysis for Hypothesis H2
The purpose of the ANOVA test is to test whether the differences reflected in the values resulting from the distribution within the groups of respondents, as in the t-test, are a meaningful set of expressions. In this context, while the t-test measures the significance of the average result within two groups of respondents, ANOVA measures the significance of the differences resulting from the probabilities between more than two groups of respondents. It is important to note that although ANOVA can show a statistically significant difference between groups, it does not indicate which groups should be significantly different.
In this regard, any of the multiple comparison techniques appropriate to the study can be used to identify statistically significant mean differences between groups (Kayri, 2009). To explain the different comparison techniques, it can be described as each group included in the ANOVA model is compared one by one with other groups in a specific order and a comparison matrix is created. However, Scheffe’s analysis, which has advantages such as comparing all combinations of groups and controlling the error rate in studies with many groups, is the most commonly used multiple comparison technique in research. Two different methods have been developed to deal with the possibility that the variance values between groups are not equally distributed. In the first method, the assumption of homogeneity of variances is accepted if the variance value between groups is not more than four times that of another group and the sample sizes between groups are equal or very close to each other (Çakay, 2020).
If the variance was not evenly distributed across the groups, the Games-Howell multiple comparison technique was used (Kayri, 2009). After examining the necessary information for ANOVA, the results for hypothesis H2 are presented in Table 6. As observed in Table 6, it was concluded that the dimensions of experiencing innovation were statistically significant according to the age groups of the participants. However, the assumption of homogeneity of variances in the data sets of these groups could not be guaranteed. There-fore, the Games-Howell analysis, a post hoc technique, was used to investigate between which groups the mean difference statistically occurred. When the sub-hypotheses of H2 were tested using ANOVA, according to Table 6, it was concluded that there was a significant difference in the dimensions of experiencing innovation for participants in different age groups.
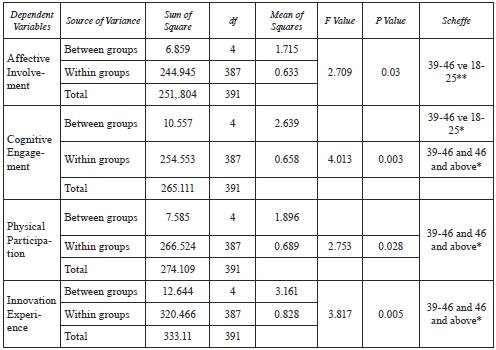
Note. *p < 0.05 level is considered significant-Independent categorical variable: Age group of participants. Own construction.
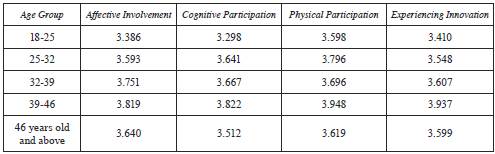
When examining affective involvement, Scheffe analysis, a post-hoc technique, was used to obtain the results regarding the groups from which the significant differences originated, where the age groups with differences were participants aged 18-25 (mean = 3.386) and participants aged 39-46 (mean = 3.819). This finding can be interpreted as follows: relatively middle-aged participants experience more positive feelings, such as excitement and enjoyment in the activities they participate in, compared to younger participants. At the same time, middle-aged people are more enthusiastic than young people about meeting new people and building new social networks during activities, thus fulfilling socio-psychological needs.
In terms of cognitive participation, there was a statistically significant difference between participants aged 39-46 (mean = 3.822) and those aged 18-25 (mean = 3.298) and those aged 46 over (mean = 3.512). Given these results, it is clear that the three age groups have a better cognitive understanding of efficacy than the others. In addition, participants aged 39-46 scored higher on the cognitive participation instruments than the 18-25 and 47 age groups, suggesting that the demographic characteristics of participants aged 39-46 provide significant advantages in terms of social activities within this collective activity.
When examining the results regarding physical participation, it was found that there was a statistically significant difference between the participants in the age group 39-46 (mean = 3.948) and those in the age group 47 and older (mean = 3.619). The results showed that participants in the 39-46 age group were more successful in appealing to the senses of taste, smell, hearing, and touch, as well as physical participation, than those in the 47+ age group. In addition, considering that both age groups belong to the middle-aged category and that they have more difficulties in socialising and communicating in their daily lives compared to younger people, it is observed that they are more enthusiastic and participatory in these types of festivals compared to younger age groups.
Regarding the experience of novelty, it was observed that there was a statistically significant difference between the age group 39-46 (mean = 3.937), the age group 25-32 (mean = 3.548) and the age group 47 and older (mean = 3.599). It can be observed that participants aged 39-46 are more successful in experiencing innovation than other age groups. Given that the age group 47 and older is the closest to the age group 39-46, and especially considering that these participants belong to the middle aged group and are more experienced in their personal social life (work, family, etc.) compared to other age groups, it was observed that they use their limited time and energy more effectively when faced with opportunities to experience innovation compared to participants aged 25-32. Based on this information and Table 7, hypotheses H2a, H2b, H2c, and H2d were supported.
Note. Own construction.
4.4.3 Results of the Analysis for Hypothesis H3
When examining the ANOVA results for H3, no statistically significant difference was found in any of the dimensions of the event attendee experience according to their income group, which was a positive result in terms of reliability (Table 8).
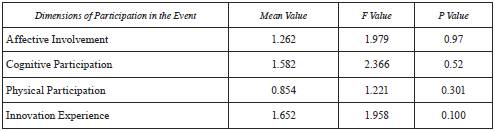
Note. Own construction.
Therefore, H3 is rejected in its entirety (affective involvement: p = 0.097, p > 0.050; cognitive involvement: p = 0.052, p > 0.050; physical participation: p = 0.301, p > 0.050; experiencing innovation: p = 0.100, p > 0.050).
4.4.4 Results of the Analysis for Hypothesis H4
As shown in Table 9, when the hypotheses of H4 were tested using ANOVA, it was concluded that each dimension of the event experience differed significantly for participants in different education groups.
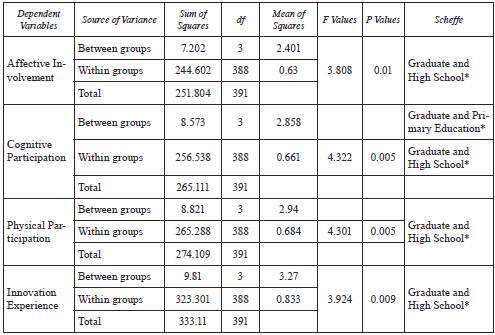
Note. *p < 0.05 level is considered significant. Independent categorical variable: Groups of participants according to their level of education. Own construction.
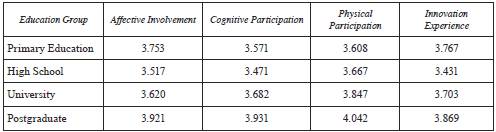
When analysing affective involvement, it was found that there was a significant difference between respondents with high school education (mean = 3.517) and those with postgraduate education (mean = 3.921). Based on these data, it was found that participants with a relatively higher level of education perceived the affective pleasure and satisfaction gained from each activity more intensely. It was also observed that individuals with postgraduate education (mean = 3.931) had more positive cognitive perceptions of the activity than those with primary school education (mean = 3.571) and high school education (mean = 3.471).
The findings and comments on the cognitive engagement dimension also apply to the physical participation dimension. Accordingly, individuals who have completed or are completing postgraduate education (mean = 4.042) have a greater motivation to directly experience each activity than those who have completed primary education (mean = 3.608) and those who have completed high school (mean = 3.667). As in the other dimensions, it was observed that participants with a higher level of education in experiencing innovation (mean = 3.869) had a greater tendency to break routines and go beyond the ordinary compared to participants with a relatively lower level of education (mean = 3.431). In light of this information and Table 10, hypotheses H4a, H4b, H4c, and H4d were supported.
Note. Own construction.
4.4.5 Results of the Analysis for Hypothesis H5
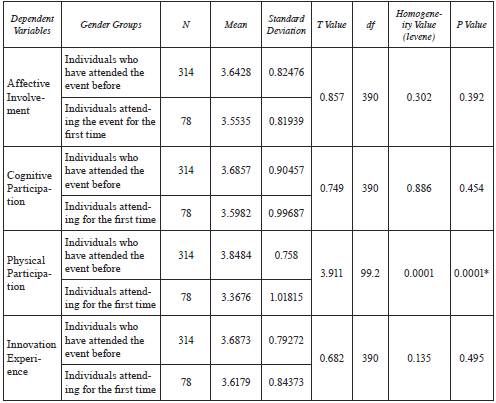
The results of the independent samples t-test for H5 are shown in Table 11. It was observed that there was a significant difference between the ratings of people who had participated in the activity before and those who had participated in the activity for the first time only in terms of the physical participation dimension. Before reporting the results, the assumption of homogeneity of variances was tested using Levene’s test. The p-value obtained from Levene’s test was < 0.05. Accordingly, it was found that the variances of individuals who had previously participated in the activity and those who participated for the first time were not homogeneously distributed in terms of the physical participation dimension (physical participation: p = 0.0001, p > 0.050). When interpreting the results of the independent samples t-test, the p-value to be considered in cases where the assumption of homogeneity of variance is not met was examined.
Note. *p < 0.05 level is considered significant. Own construction.
Since this value is equal to p = 0.0001 and since this value is less than p < 0.050 in the 95% confidence interval, hypothesis H5c is accepted. Hypotheses H5a, H5b, and H5d were rejected because their values were more significant than p < 0.050 (p = 0.302, p = 0.886, and p = 0.135, respectively). Therefore, it can be said that only hypothesis H5c is accepted, so that overall hypothesis H5 is partially supported. Based on the values in Table 11, it can be concluded that individuals who have previously participated in the activity and gained experience in this regard (mean = 3.848) are more willing and eager to physically participate in every moment of the activity compared to individuals who are experiencing the activity for the first time (mean = 3.367).
5. Discussion
A review of the studies in the literature shows that the decision-making process for tourists’ choice of destination is primarily related to their socio-demographic characteristics. However, the results of the studies differ when looking at the subcategories that make up the demographic characteristics. In the studies conducted by Bekar and Kılıç (2014) and Almeida (2020), positive differences were observed in terms of the income group of the participants experiencing the activity. However, in this study, it was found that there was no positive difference in terms of the income status of the participants experiencing the activity. The wine tasting event in Porto carried out in the study by Almeida (2020) and the local flavours and tasting events organised in the framework of the 3rd Eşme Quince Festival offer similar experiences to participants in terms of the type of activity, but produce different results. Considering these results, it is assumed that in addition to socio-demographic characteristics, the variety and price of the products offered at the event also influence the outcome in the process of experiencing the activity.
From the participant’s point of view, the value attributed to the service or product they own is different when everyone has easy access to a product or when participants have to pay a high price to acquire it or prioritise among their preferences. This situation is thought to be the reason for the different results in two similar studies. When looking at individuals in terms of their socio-demographic characteristics, some average results are found to be identical in almost all studies. For example, except in exceptional cases, education level moves in parallel with income level on average in all studies, but these socio-demographic characteristics of the participants involve different labour, time and costs for each individual. In this respect, even if the participants have similar characteristics, the level of participation in the activity may yield different results due to the different ways in which they reach these levels, even if they are at the same class level. Therefore, as similar studies of activity experience become more widespread, the average accuracy is expected to be equally high.
6. Conclusion and Recommendations
The objective of this research is to analyze how the socio-demographic characteristics of individuals influence their thoughts and experiences, and create differences when compared to others.
In t-test analyses of participation dimensions based on the gender characteristics of event participants, perceptions of individuals’ experiences in all event dimensions show significant differences based on gender. When analysing event participants by gender, some differences between male and female participants are noticeable, including communication (Kurtyılmaz, 2005), areas of interest and networking (Kıran et al., 2019). In general, women and men have different communication styles and addresses. Women tend to use more affective and empathetic language, while men may use more concrete and analytical language. These differences in communication styles can lead to different speaking and expression styles during events, which are crucial for individuals’ ability to express themselves and understand the other party.
When looking at participants by age group, there are significant differences between each age group in how they experience the event. When event attendees are evaluated by age group, several differences are evident. These include “experience level” (Akpirinç & Mancı, 2019), “expectations” (Güleri, 1998) and “interaction” (Varışlı & Gültekin, 2020). Experience level can be explained as the ability to anticipate the future by assimilating past experiences. Young participants may generally have less experience, while middle-aged or older participants may have more life experience and expertise. This situation may affect the choice of content for presentations, performances, or entertainment programmes at the event, but experience level alone is not sufficient to participate in an event.
In the study, it is observed that the most successful age group in terms of participation and experiencing the effectiveness of the activity is the 39-46 age group. Therefore, despite being in a higher age group, their more successful participation and experience of the activity may be due to their ability to prioritise based on their experience, being healthier in terms of physical and psychological strength compared to the 47+ age group. In this context, the level of experience and expertise may not be important on its own, but it may be important in combination with other factors. Differences between age groups may lead to different expectations of activities. Young participants may generally want a more interactive and fun activity, whereas middle-aged or older participants may focus more on gathering information.
Interaction and connection styles may also vary across age groups. Younger individuals tend to connect more quickly through social media or digital platforms, while those in the 39-46 age range prefer more face-to-face interaction. No significant differences in activity participation were found when evaluating attendees by income group. However, when considering education level, differences emerge between the groups, including in content comprehension (Öztürk, 2005), implementation, and applicability (Köybaşı et al., 2017). Those with different educational backgrounds may show varying levels of understanding and processing of the activity’s content. Individuals with higher levels of education tend to grasp complex topics more quickly, while those with lower educational attainment may require more support and clarification. Among those who attended, the postgraduate group stands out as the most successful in terms of participation and experience. This can be attributed to their ability to formulate more specialized and analytical questions, or to find answers more effectively as education level increases. Additionally, individuals with postgraduate education are likely to offer more active and complex ideas, in contrast to those with lower education levels, who may use more reserved and simpler expressions. As a result, differences in their participation and experience of the activity become evident.
There are different approaches to applying the knowledge gained from the event. Participants with higher levels of education are likely to grasp and apply the concepts learned more quickly, while those with lower levels of education may require more practice and guidance. Looking specifically at attendance at the event, meaningful differences were found only in ratings related to physical attendance. The difference between those who have attended the event several times and those who have never attended reflects a deeper understanding (Gümüş, 2022). Repeated attendance at an event may lead to a deeper understanding when combined with previous knowledge and experience. As a result of the second attendance, more connections can be made based on previous knowledge, topics can be better understood, and more attention can be paid to details.
Based on the interpretation of the research results, the following suggestions for organisers and researchers on this topic have been developed:
6.1 Recommendations for Event Organisers
To avoid traffic, parking problems, and wasted time, encourage participants to use public transport instead of relying on private cars to achieve the goal of broad participation.
Allow participants to experience locally grown products for free or at a reasonable cost throughout the event. Providing participants with sufficient information about the purpose, content, and planning of the event can be effective in achieving the desired participation and experience.
Public administrations, NGOs, and tourism stakeholders organising the festival can develop marketing strategies based on individual attitudes and behaviours of participants to increase participation and festival revenues.
Facilitate interaction and dialogue between different age groups attending the event.
The presentation of content during activities can be tailored to appeal to all educational levels of participants.
Provide opportunities for practical application of knowledge gained during the event.
Facilities can be provided for participants to easily communicate their suggestions and complaints to the organisers.
Strengthen dialogue and communication with participants to address shortcomings and make positive adjustments during the event organisation phase.
6.2 Recommendations for Researchers
The aim of this study is to examine the participants’ experiences at a specific event, the 3rd Eşme Quince Festival, in order to identify differences in their participation and their perception of it, using the participants’ sociodemographic characteristics and specific dimensions (affective, physical, cognitive, and innovation) as study variables. There-fore, researchers wishing to contribute to the limited literature on this topic may need to collaborate with the organisations hosting the activity and engage in both pre-event planning and communication throughout the event to create a conducive environment.
The study examines the “Attendance to the Event Scale” (AES) in 4 different dimensions, allowing potential researchers to adopt different dimensional approaches in future studies, depending on the size of the event. Collaborative teamwork during data collection is particularly beneficial to mitigate time constraints in subsequent studies.
The research was conducted with a limited sample at the 3rd Eşme Quince Festival in the Kartepe district, Kocaeli province. The restricted area allocated due to the special event initiative may be a limitation for the structured study with participants. Exploring larger and different samples in future studies related to this or similar festivals will allow comparisons with the current study and contribute to relevant literature and field research.
References
Akpirinç, E., & Mancı, A. R. (2019). Yerel halkın kültürel miras farkındalığı ve deneyimi: Şanlıurfa örneği [Cultural heritage awareness and experience of residents: An example of Şanlıurfa]. International Journal of Contemporary Tourism Research, 3(2), 245-260. https://doi.org/10.30625/ ijctr.647631
Aktaş, U. A., & Kızılcalıoğlu, G. (2020). Festival algısı ve memnuniyet üzerine bir araştırma: Adana ve Antalya Film Festivali örneği [An investigation on festival perception and satisfaction: The case of Adana and Antalya Film Festival]. Türk Turizm Araştırmaları Dergisi, 4(4), 3855-3872. https://doi.org/10.26677/TR1010.2020.595
Akyurt, H., & Akay, L. (2009). Destinasyonda imaj oluşturma süreci [The process of creating an image in a destination]. Aksaray Üniversitesi İktisadi ve İdari Bilimler Fakültesi Dergisi, 1(1), 1-14. https://aksarayiibd.aksaray.edu.tr/tr/pub/issue/22558/241035
Akyüz, H. E. (2018). Yapı geçerliliği için doğrulayıcı faktör analizi: uygulamalı bir çalışma [Confirmatory factor analysis for construct validity: An applied study]. Bitlis Eren Üniversitesi Fen Bilimleri Dergisi, 7(2), 186-198. https://doi.org/10.17798/bitlisfen.414490
Almeida, F. (2020). Exploring the impact of socio-demographic dimensions in choosing a city touristic destination. Journal of Tourism and Heritage Research, 3(4), 120-142. https://www.jthr.es/index.php/journal/article/view/219
Altunışık, R., Coşkun, R., Bayraktaroğlu, S., & Yıldırım, E. (2012). Sosyal bilimlerde araştırma yöntemleri SPSS uygulamaları [Research methods in social sciences by SPSS] (7th ed.). Sakarya Yayıncılık.
Apaydın, F. (2011). Şehir pazarlaması [City marketing]. Nobel Yayın Dağıtım.
Arslan, Y. (2005). Erdek ve çevresinin ekoturizm açisindan değerlendirilmesi [A study of ecotorism in Erdek region]. Balıkesir Üniversitesi Sosyal Bilimler Enstitüsü Dergisi, 8(13), 29-53. https://dergipark.org.tr/tr/pub/baunsobed/issue/50339/651845
Artuğer, S., & Çetinsöz, B. C. (2014). Destinasyon imajı ile destinasyon kişiliği arasındaki ilişkiyi belirlemeye yönelik bir araştırma [A research for determining the relationship between destination image and destination personality]. Journal of Business Research-Türk, 6(1), 366-384. https://www.isarder.org/index.php/isarder/article/view/173
Atak, O., Tatar, S., & Tunaseli, A. (2017). Kültürel miras oluşumunda festivallerin yeri ve önemi: Fethiye Müzik Köyü üzerine bir değerlendirme [Place and importance of festivals in the formation of cultural heritage: An evaluation on Fethiye Music Village]. The Journal of International Social Research, 10(52), 15-36. https://dx.doi.org/10.17719/jisr.2017.1989
Ayaş, N. (2007). Çevresel sürdürülebilir turizm gelişmesi [Environmentally sustainable tourism development]. Gazi Üniversitesi iktisadi ve İdari Bilimler Fakültesi Dergisi, 9(1), 59-69. https://dergipark.org.tr/en/download/article-file/287522
Aybarç, S., Selim, S., & Ayvaz Kızılgöl, Ö. (2019). Türkiye’de turizme yönelik kamu teşvik politikaları çerçevesinde illerin etkinlik analizi [Efficiency analysis of the provinces on the basis of public incentive policies for tourism in Turkey]. Eskişehir Osmangazi University Journal of Economics and Administrative Sciences, 14(1), 129-148. https://doi.org/10.17153/oguiibf.452647
Aydın, O. (2012). Türkiye’de alternatif bir turizm; sağlık turizmi [An alternative tourism in Turkey; health tourism]. Karamanoğlu Mehmetbey University Journal of Social and Economic Research, 12(2), 91-96. https://dergipark.org.tr/en/pub/kmusekad/issue/10213
Aymankuy, Y. (1997). Türkiye’ de geliştirilebilir turizm şekli olarak kongre turizmi ve İzmir il merkezi örnek uygulaması [Congress (convention) tourism as a progressiv in Turkey, and its sample application in İzmir] [Doctoral thesis, Balıkesir University]. Institutional Repository of Balıkesir University. https://acortar.link/UN3jep
Baloğlu, Ş., & McCleary, K. W. (1999). A model of destination image formation. Annals of Tourism Research, 26(4), 868-897. https://dx.doi.org/10.1016/S0160-7383(99)00030-4
Beerli, A., & Martin, J. D. (2004). Tourists’ characteristics and the perceived image of tourist destinations: A quantitative analysis-A case study of Lanzarote, Spain. Tourism Management, 25(5), 623-636. https://doi.org/10.1016/j.tourman.2003.06.004
Bekar, A., & Kılıç, B. (2014). Turistlerin gelir düzeylerine göre destinasyondaki gastronomi turizmi etkinliklerine katılımları [Tourist participation in gastronomy tourism activities at destination according to their level of income]. International Journal of Social and Economic Sciences, 4(1), 19-26. https://www.ijses.org/index.php/ijses/article/view/124
Bilge Doğanlı, B. (2006). Turizmde destinasyon markalaşması ve Antalya örneği [Destination branding in tourism: Antalya case] [Doctoral thesis, Süleyman Demirel University]. Institutional Repository of Süleyman Demirel University. https://acortar.link/SjAIre
Boğan, E., & Sarıışık, M. (2016). Yerel halkin turizm faaliyetine yönelik görüş ve algilamalarinin belirlenmesi üzerine Alanya’da bir araştirma [An investigation to determine opinions and perceptions of local community toward tourism activities in Alanya]. Kastamonu Üniversitesi İktisadi ve İdari Bilimler Fakültesi Dergisi, 12(2), 325-342. https://dergipark.org.tr/tr/pub/iibfdkastamonu/issue/29623/318110
Buhalis, D. (2000). Marketing the competitive destination of the future. Tourism Management , 21(1), 97-116. https://doi.org/10.1016/S0261-5177(99)00095-3
Büyüköztürk, Ş. (2002). Faktör analizi: Temel kavramlar ve ölçek geliştirmede kullanımı [Factor analysis: Basic concepts and using to development scale]. Kuram ve Uygulamada Eğitim Yönetimi, 32(32), 470-483. https://dergipark.org.tr/tr/pub/kuey/issue/10365/126871
Çakay, E. A. (2020). Bağımsız örneklem testiyle patent kalite kriterleri değerlendirmesi: Beyaz eşya sektöründe bir uygulama [Evaluation of patent quality criteria wıth independent sample test: An application in the white goods sector] [Master’s thesis, Istanbul Technical University]. Institutional Repository of Istanbul Technical University. https://acortar.link/erhEh2
Carvache-Franco, M., Carvache-Franco, O., Carvache-Franco, W., & Villagómez-Buele, C. (2020). Relationship between sociodemographic aspects, satisfaction and loyalty in gastronomic festivals. GeoJournal of Tourism and Geosites, 32(4), 1324-1329. https://doi.org/10.30892/gtg.32420-576
Çoban, M., & Süer, S. (2018). Destinasyon markalaşmasinda festival turizminin rolü: Alaçati ot Festivali Üzerine bir çalişma [The role of the festival tourism in the destination branding: A study on Alacatı Herb Festival]. International Journal of Contemporary Tourism Research , 1, 58-67. https://dergipark.org.tr/tr/download/article-file/496138
Coşkun, R., Altunışık, R., & Yıldırım, E. (2017). Sosyal bilimlerde araştırma yöntemleri-SPSS applied [Research methods in social sciences-SPSS applied]. Sakarya Yayıncılık.
Cronin, M., & O’Connor, B. (2003). Irish tourism, image, culture and identity. Cromwell Press.
Demir, Ö., Avcıkurt, C., & Güleç, E. (2019). Eminönü’nde (İstanbul) balik ekmek yeme deneyimleri [Eating fish & bread experiences at Eminönü (İstanbul)]. Yüzüncü Yıl Üniversitesi Sosyal Bilimler Enstitüsü Dergisi, 3(Special Issue), 201-218. https://dergipark.org.tr/tr/pub/yyusbed/issue/51801/673551
Demirkapı, K. (2017). Bir pazarlama aracı olarak uluslararası. turizm fuarları: konaklama işletmeleri için önemi [International tourism fairs as a marketing tool: The importance for accommodation businesses] [Master’s thesis]. Kırklareli University.
Dimanche, F. (2002). The contribution of special events to destination brand equity-European cities tourism’s. In K. W. Wöber (Ed.), City Tourism 2002: Proceedings of European Cities Tourism’s International Conference in Vienna, Austria (pp. 73-80). Springer.
Dridea, C. R., & Strutzen, G. (2008). Theme park, the main concept of tourism industry development. Annals of the University of Oradea, Economic Science Series, 17(2), 635-640. https://anale.steconomiceuoradea.ro/volume/2008/v2-economy-and-business-administration/113.pdf
Dryglas, D., & Salamaga, M. (2017). Applying destination attribute segmentation to health tourists: A case study of polish SPA resorts. Journal of Travel & Tourism Marketing, 34(4), 503-514. https://doi.org/10.1080/10548408.2016.1193102
Ekenyazıcı, E. (2005). İkon yapıların turizm olaylarına etkileri [The effects of icons of architecture to tourism] [Master’s thesis]. Yıldız Technical University.
Ekin, Y. (2011). Etkinlik turizmi kapsamında festivaller ve Antalya Altın Portakal Film Festivali’nin yerel halk üzerindeki sosyal etkileri konulu bir araştırma [Festivals within the context of event tourism and a research about social impacts of Antalya Altın Portakal Film Festival on residents] [Doctoral thesis]. Akdeniz University.
Emekli, G. (2006). Coğrafya, kültür ve turizm: Kültürel turizm [Geography, culture and tourism: Cultural tourism]. Ege Coğrafya Dergisi, 15(1-2), 51-59. https://dergipark.org.tr/tr/pub/ecd/issue/4877/66925
Ercan, F. (2020). Çevrimiçi seyahat rehberlerinde destinasyon çekicilik unsurlarının analizi: “Turkey Home” örneği [Analysis of destination attractiveness factors in online travel guides: The case of “Home Turkey”]. Eskişehir Osmangazi Üniversitesi İktisadi ve İdari Bilimler Dergisi, 15(2), 543-564. https://doi.org/10.17153/oguiibf.535736
Ercan, F., & Civelek, M. (2020). Rekreasyon faaliyetleri kapsamında etkinlik ve festivallerin destinasyon imajına etkisi [Effects of events and festivals on tourism potential in recreation activities]. Türk Turizm Araştırmaları Dergisi , 4(1), 653-664. https://www.tutad.org/index.php/tutad/article/view/199
Ercik, C., & Çoban, Ö. (2024 ). The effect of taste perception of locally processed foods on consumer attitudes. Journal of Multidisciplinary Academic Tourism, 9(3), 301-315. https://doi.org/10.31822/jomat.2024-9-3-301
Erdem, B., & Akyürek, S. (2017). Yeni bir mutfak akımı: yaşayan mutfaklar [A new cuisine trend: Living cuisines]. Journal of Tourism and Gastronomy Studies, 5(2), 103-126.
Ergin, Y. D. (1995). Ölçeklerde geçerlik ve güvenirlik [Validity and reliability in scales]. Marmara University Atatürk Faculty of Education Journal of Educational Sciences, 7(7), 125-148. https://dergipark.org.tr/tr/download/article-file/1697
Eryılmaz, B. (2011). Alternatif Turizm Çeşidi Olarak Samsun’ da Kongre Turizmi Olanaklarinin Değerlendirilmesi [Evaluation of Congress Tourism Opportunities in Samsun as an alternative tourism type]. Samsun Symposium, 13-16 October.
Eryılmaz, B., & Yücetürk, C. (2018). Türkiye’nin sosyal medya tanıtım aracı: Turkeyhome [Turkey’s social media promotion tool: Turkeyhome]. Current Academic Studies in Social Sciences, 1(1), 207-214. https://acortar.link/BoFUkI
Eskin, B., Tuncer, M., & Demirçivi, B. M. (2017). A ecological tourism as an alternative tourism: The case of Mount Hasan. Journal of Aksaray University Faculty of Economics and Administrative Sciences, 9(3), 15-26.
Fırat, S. O. Ü. (1995). Tek yönlü gruplandirilmiş veriler için varyanslarin homojenliğinin testi [Test of homogeneity of variances for one-way grouped data]. Istanbul University Journal of the School of Business, 24(1), 141-148. https://acortar.link/PNkjbz
George, D., & Mallery, M. (2010). SPSS for windows step by step: A simple guide and reference, 17.0 update. Allyn & Bacon.
Getz, D. (1997). Event management and event tourism. Cognizant Communication Corporation.
Getz, D. (2008). Event tourism: Definition, evolution, and research. Tourism Management , 29(3), 403-428. https://doi.org/10.1016/j.tourman.2007.07.017
Ginsburgh, V. A., & Noury, A. (2008). The Eurovision Song Contest. Is voting political or cultural? European Journal of Political Economy, 24 (1), 41-52. https://doi.org/10.1016/j.ejpoleco.2007.05.004
Görgün, E. (2011). Geleceğin turizm konseptinde kruvaziyer turizmi uygulamaları [Cruise tourism applications in the tourism concept of the future] [Master’s thesis]. Trakya University Institute of Social Sciences.
Grigarova, Z., & Arabska, E. (2014 ). Evaluation of resources for sustainable tourism development in the Region of Teteven Mountains through the example of Ribaritsa Resort in Bulgaria. BJSS: Balkan Journal of Social Sciences, 3(6), 24-39. https://dergipark.org.tr/en/download/article-file/668402
Güçlü, C. (2017). Bilgi kaynaklarinin seyahat motivasyonlari üzerindeki etkisi: Alanya örneği [The effect of information sources on travel motivations: Case of Alanya]. Alanya Academic Review Journal, 1(3), 61-79. https://doi.org/10.29023/alanyaakademik.327779
Guillet, B. D, Lee, A., Law, R., & Leung, R. (2011). Factors affecting outbound tourists’ destination choice: The case of Hong Kong. Journal of Travel & Tourism Marketing , 2(28), 556-566. https://doi.org/10.1080/10548408.2011.588120
Güleri, M. (1998). Üniversiteli ve işçi gençliğin gelecek beklentileri ve kötümserlik-iyimserlik düzeyleri [Future expectations and levels of pessimism-optimism of university and working youth]. Kriz Dergisi, 6(1), 55-65. https://doi.org/10.1501/Kriz_0000000036
Gümüş, S. E. (2022). The effect of flow status on perceived value and desire to experience again in balloon tour experiences [Doctoral thesis]. Nevşehir Hacı Bektaş Veli University .
Günal, V. (2005). Mardin ili’nde kültürel turizm potansiyeli [The cultural tourism potential of Mardin province]. Marmara Coğrafya Dergisi, 11, 91-122.
Güngör, S., & Arslan, M. (2004 ). SWOT analysis, visual quality assessment, preferences of tourism facilities and tourism facilities’ conditional analysis for tourism and recreational strategies: Case study for Beysehir province. Selçuk Journal of Agricultural Faculty, 18(33), 68-72.
Gunn, C. (1972). Vacationscape: Designing tourist regions. Bureau of Business Research, University of Texas.
Gutiérrez, A., & Miravet, D. (2016). The determinants of tourist use of public transport at the destination. Sustainability, 8(9), 908. https://doi.org/10.3390/su8090908
Hammadou, H., Thomas, I., Verhetsel, A., & Witlox, F. (2008). How to incorporate the spatial dimension in destination choice models: The case of Antwerp. Transportation Planning and Technology, 31(2), 153-181. https://doi.org/10.1080/03081060801948126
Haşıloğlu, S. B., Baran, T., & Aydın, O. (2015). Pazarlama araştırmalarındaki potansiyel problemlere yönelik bir araştırma: Kolayda örnekleme ve sıklık ifadeli ölçek maddeleri [A study on the potential problems in marketing research: Convenience sampling and scale items with adverbs of frequency]. Pamukkale Journal of Business and Information Management, 2(1), 19-28. https://dergipark.org.tr/en/pub/pibyd/issue/35465/394010
Hernández-Mogollón, J. M., Folgado-Fernández, J. A., & Duarte, P. A. O. (2014 ). Event tourism analysis and state of the art. European Journal of Tourism, Hospitality and Recreation, 5(2), 83-102.
Huang, C.-Y. (2017). Etkinlik turizminin destinasyon pazarlamasındaki yeri ve önemi: Tayvan örneği [The role and importance of event tourism in destination marketing: The case of Taiwan] [Master’s thesis, İstanbul University]. Institutional Repository of İstanbul University. https://acortar.link/SXctts
İçellioğlu, C. Ş. (2014 ). Urban tourism and brand cities: Istanbul’s SWOT analysis in terms of tourism potential. Journal of Business Administration and Social Studies, 1(1), 37-55. https://j-ba-socstud.org/index.php/pub/article/view/126
Kahraman, C. Ö. (2020). Determination of motivation, satisfaction and tendency to revisit of festival participants: Example of International Fethiye Ölüdeniz Air Games Festival [Master’s thesis]. İskenderun Technical University Institute of Social Sciences.
Karakaş, H., Çizel, B., Onur Selçuk, O., Öksüz, F., & Ceylan, D. (2022). Country and destination image perception of mass tourists: Generation comparison. Anatolia. An International Journal of Tourism and Hospitality Research, 33(1), 104-115. https://doi.org/10.1080/13032917.2021.1909087
Karakoç, F. Y., Dönmez, L. (2014 ). Ölçek geliştirme çalışmalarında temel ilkeler [Basic principles in scale development]. Tıp Eğitimi Dünyası, 13(40), 39-49. https://doi.org/10.25282/ted.228738
Karaküçük, S. (1997). Rekreasyon boş zamanlı değerlendirme kavram kapsam ve bir araştırma [Recreation, leisure time evaluation concept, scope, and a research]. Seren Ofset.
Karasu, T. (1990). Kongre turizmi üzerinde düşünceler [Thoughts on conference tourism]. Anatolia: Turizm Araştırmaları Dergisi, 1(5), 32-34. https://dergipark.org.tr/tr/pub/atad/issue/53026/701851
Kargiglioğlu, Ş., & Kabacık, M. (2017). The standpoints of tourist visiting Urla Artichoke Festival within the scope of gastronomy tourism. Journal of Tourism & Gastronomy Studies, 5(3), 409-421. https://doi.org/10.21325/jotags.2017.102
Kayri, M. (2009). Araştırmalarda gruplar arası farkın belirlenmesine yönelik çoklu karşılaştırma ( post-hoc) teknikleri [The multiple comparison ( post-hoc) techniques to determine the difference between groups in researches]. Fırat University Journal of Social Science, 19(1), 51-64. https://dergipark.org.tr/en/download/article-file/72000
Kılıç, S. (2016). Cronbach’ın Alfa güvenirlik katsayısı [Cronbach’s alpha reliability coefficient]. Journal of Mood Disorders, 6(1), 47-48. https://doi.org/10.5455/jmood.20160307122823
Kılınç, E. (2014 ). Antalya’da yaşayan yabancı uyruklu aile çocuklarının karşılaştığı eğitim sorunları [The problems faced by the foreign national children living in Antalya] [Master’s thesis]. Akdeniz University.
Kıran, S., Yılmaz, C., & Emre, İ. (2019). Instagram’daki influencer’larin takipçiler üzerindeki etkisi [The effect of influencers on Instagram on followers]. International Journal of Management Information Systems and Computer Science, 3(2), 100-111. https://doi.org/10.33461/uybisbbd.637155
Komilova, N., Usmanov, M., Safarova, N., Matchanova, A., & Murtazaeva, G. (2021). Tourist destination as an object of research of social and economic geography. Psychology and Education Journal, 58(1), 2058-2067. https://doi.org/10.17762/PAE.V58I1.1082
Kömürcü, G. B. (2013). Etkinlik turizmi çeşidi olarak festivaller: Bozcaada Yerel Tatlar Festivali örneği [Festivals as a type of event tourism: The case of Bozcaada Local Flavors Festival] [Master’s thesis]. Çanakkale Onsekiz Mart University.
Köybaşı, F., Uğurlu, C. T., & Demir, D. (2017). Çağdaş eğitim denetimi modeli olarak okullarda farklılaştırılmış denetim uygulamalarına ilişkin bir araştırma [A study on differentiated supervision practices in schools as a contemporary education supervision model]. Türk Eğitim Bilimleri Dergisi, 15(1), 43-57. https://dergipark.org.tr/en/download/article-file/314860
Kurnaz, H. B. (2013). İnanç turizmi kapsamında Hac ve Umre organizasyonu yapan seyahat acentalarının pazarlama faaliyetlerinin incelenmesi: A grubu acentalara yönelik bir uygulama [The examination of the marketing activities of the travel agencies undertaking Haj and Umrah organisations within the context of faith tourism: An implementation for group a agencies] [Master’s thesis, Balıkesir University]. Institutional Repository of Bahçeşehir University. https://acortar.link/UgOVAG
Kurtyılmaz, Y. (2005). Öğretmen adaylarının saldırganlık düzeyleri ile akademik başarıları iletişim ve problem çözme becerileri arasındaki ilişkiler Anadolu Üniversitesi ve Osmangazi Üniversitesi öğrencileri üzerinde bir araştırma [Relationships between teacher trainees’ aggression levels and academic achievement, communication skills, problem solving skills: An investigation on the students of Anadolu and Osmangazi University] [Master’s thesis]. Anadolu University.
Kusdibyo, L. (2022). Tourist loyalty to hot springs destination: The role of tourist motivation, destination image, and tourist satisfaction. Leisure/Loisir, 46(3), 381-408. https://doi.org/10.1080/14927713.2021.1986420
Latypova, E. N. (2011). Life cycle of tourist destinations and their competitiveness [Master’s thesis]. Moscow State Unıversity.
Lee, S., Manthiou, A., Jeong, M., Tang, L., & Chiang, L. (2015). Does consumers’ feeling affect their quality of life? Roles of consumption emotion and its consequences. International Journal of Tourism Research, 17(4), 409-416. https://doi.org/10.1002/jtr.1988
Lennon, J. (2017, March 29). Dark tourism. In Oxford Research Encyclopedia of Criminology and Criminal Justice. https://doi.org/10.1093/acrefore/9780190264079.013.212
Lickorish, L. J., & Jenkins, C. L. (1997). An introduction to tourism. Butterworth-Heinemann.
Monteiro, A. P., & Borges, A. P. (2015). Impact of socio-demographic characteristics and loyalty on the visitors’ satisfaction. European Journal of Applied Business Management, 1(1), 224-239. https://nidisag.isag.pt/index.php/IJAM/article/view/39
Morice, J.-R., & Violier, P. (2009). De l’événementiel culturel à la destination touristique : les cas de Lille et Nantes [From special cultural event management to tourist destinations: Lille and Nantes as case studies]. Bulletin de l’Association de Géographes Français, 86(3), 377-387. https://www.persee.fr/doc/bagf_0004-5322_2009_num_86_3_2682
Morrison, A. (2018). Marketing and managing tourism destinations (2nd ed.). Routledge.
Murphy, L. (2000). Australia’s image as a holiday destination perceptions of backpacker visitors. Journal of Travel and Tourism Marketing, 8(3), 21-45. https://doi.org/10.1300/J073v08n03_02
Oran, İ. (2014 ). Destinasyon imajı: İstanbul›un destinasyon imajı ve destinasyon iletişim stratejileri üzerine bir araştırma [Destination image: Destination image of İstanbul and a research on destination communication strategies] [Master’s thesis, Bahçeşehir University]. Institutional Repository of Bahçeşehir University. https://acortar.link/OhxNaI
Özdemir, G. (2007). Destinasyon yönetimi ve pazarlama temelleri İzmir için bir destinasyon model önerisi [Destination management and marketing fundamentals: A model proposal for the destination İzmir] [Doctoral thesis, Dokuz Eylül]. Dokuz Eylül University Academic Data Management System. https://acortar.link/5YkIP5
Özgören Şen, F., & Öztek, M. Y. (2017). Boş zaman pazarlamasi kapsamindaki faaliyetlere genel bir bakiş [An overview of activities in the context of leisure marketing]. Üniversitesi İktisadi Ve İdari Bilimler Fakültesi Dergisi, 6(3), 58-71. https://dergipark.org.tr/en/pub/klujfeas/issue/32028/358212
Özgürel, G., Alan, R., & Bingöl, Z. (2015). Yerel kalkınmada bir araç olarak festivaller: Munzur Kültür ve Doğa Festivali [Festivals as a tool for local development: Munzur Culture and Nature Festival]. International Journal of Social and Economic Sciences , 5(2), 113-121. https://ijses.org/index.php/ijses/article/view/156
Öztürk, N. (2005). İktisadi Kalkınmada Eğitimin Rolü [The role of education in economic development]. Sosyoekonomi, 1(1), 27-44. https://dergipark.org.tr/en/pub/sosyoekonomi/issue/21061/226776
Öztürk, Y. (2017). Rekreasyonel faaliyetlerin algılanan kalitesinin destinasyon imajına etkisi: Ilgaz Dağı Milli Parkı örneği [The impact of perceived quality of recreational activities on the destination image: Sample of Ilgaz Mountain National Parkı] [Doctoral thesis, Gazi University]. Institutional Repository of Gazi University. https://acortar.link/0n7bVw
Papanikos, G. (2015). The economic effects of a marathon as a sport tourism event. Athens Journal of Sports, 2(4), 225-240. https://doi.org/10.30958/ajspo.2-4-3
Picard, D., & Robinson, M. (2006). Festivals, tourism and social change remaking world. Channel View Publications.
Raj, R. (2004 ). The impact of cultural festivals on tourism. Tourism Today, 4, 66-77. https://tourismtodayjournal.com/journals/tourism-today-volume-2004/
Ritchie, J. R. B., & Crouch, G. I. (2003). The competitive destination: A sustainable tourism perspective. CABI Publishing.
Rodríguez-Rangel, C., Sánchez-Rivero, M., & Sánchez-Martín, J. M. (2016). Análisis de los factores sociodemográficos que determinan la valoración de eventos turísticos culturales: una aplicación al Festival de Teatro Clásico de Mérida [Analysis of the sociodemographic factors that determine the evaluation of cultural tourism events: An application to the Classical Theater Festival of Mérida]. International Journal of Scientific Managment Tourism, 2(2), 415-437. https://ojs.scientificman-agementjournal.com/ojs/index.php/smj/article/view/175/173
Ross, A., & Willson, V. L. (2017). Basic and advanced statistical tests writing results sections and creating tables and figures. Sense Publishers.
Rozycki, P., & Dryglas, D. (2014 ). Trekking as a phenomenon of tourism in the modern world. Acta Geoturistica, 5(1), 24-40.
Saçılık, M. Y., & Çevik, S. (2017). Etkinlik turizminin sağladiği faydalar açisindan “Erdek Zamani Festivali” katilimcilarinin memnuniyet düzeylerinin belirlenmesi [Determination of the satisfaction levels of “Erdek Time Festival” participants in terms of benefits provided by event tourism]. Route Educational & Social Science Journal, (19), 240-257.
Saçlı, Ç., & Ersöz, B. (2019). Festival katılımcılarının destinasyon imajı algılarını oluşturan faktörlerin belirlenmesi: Adana Şalgam ve Kebap Festivali örneği [Determining the factors that form perceptions of the destination image of festival participants: The case of Adana Şalgam and Kebap Festival]. Journal of Tourism and Gastronomy Studies , 7(1), 185-204. https://doi.org/10.21325/jotags.2019.359
Salici, O., & Özdaşlı, K. (2016). The place of table tennis in Turkey sports tourism. Journal of Mehmet Akif Ersoy University Economics and Administrative Sciences, 3(2), 36-46. https://dergipark.org.tr/en/pub/makuiibf/issue/26780/281785
Sarikaya, Z., & Er, B. (2012). Halk kültürünün tanıtılmasında el sanatlarının yeri ve önemi [Importance of hand craft presenting of folk culture]. Batman University Journal of Life Sciences, 1(1), 179-189. https://dergipark.org.tr/tr/download/article-file/313543
Şengül, S., Yılmaz, Ö., & Eryılmaz, B. (2018). Stratejik boyutuyla destinasyon pazarlaması [Destination marketing with its strategic dimension]. Değişim Yayınları.
Soykan, F. (1999). Doğal çevre ve kırsal kültürle bütünleşen bir turizm türü: kırsal turizm [A type of tourism that integrates natural environment and rural culture: Rural tourism]. Anatolia: Turizm Araştırmaları Dergisi , 10(1), 67-75. https://dergipark.org.tr/tr/pub/atad/issue/53224/706675
Sposito, V., Hand, M., & Skarpness, B. (1983). On the efficiency of using the sample kurtosis in selecting optimal lp estimators. Communications in Statistics - Simulation and Computation, 12(3), 265-272. https://doi.org/10.1080/03610918308812318
Tırnakçı, A., Özhancı, E., & Aklıbaşında, M. (2018). Agricultural landscape pattern and agricultural tourism potential of Nevsehir. Akademik Ziraat Dergisi, 7(2), 245-252. https://doi.org/10.29278/azd.4 76660
Tolongüç, A. (1992). Tanıtım ve imaj [Promotion and image]. Anatolia: Turizm Araştırmaları Dergisi , 3(2), 11-19. https://dergipark.org.tr/tr/download/article-file/1007011
Toy, S., & Türkeş, Ö. (2022). Evaluation of climatic characteristics of Erzurum for winter tourism. Journal of Environmental and Natural Studies, 4 (1), 1-14. https://dergipark.org.tr/tr/download/article-file/2179247
Tuna, M. (2018). Tema parkları ve çocuk dostu turizm [Theme parks and child friendly tourism]. Journal of Sivas Interdisciplinary Tourism Research, 1, 47-53. https://dergipark.org.tr/tr/download/article-file/554560
Türkay, O. (2014 ). Destinasyon yönetimi: yönetimbilim bakış açısıyla işlevler yaklaşımlar ve araçlar [Destination management: Functions, approaches and tools from a management science perspective]. Detay Yayıncılık.
Varışlı, B., & Gültekin, T. (2020). Yaşlı ayrımcılığının pandemi hali: COVID-19 sürecinde kuşaklararası Etkileşimin Dönüşümü [Pandemic state of ageism: Transformation of intergenerational interaction during COVID-19 process]. Turkish Studies, 15(4), 1227-1237. https://dx.doi.org/10.7827/TurkishStudies.44376
Wagen, L. (2005). Event management: For tourism, cultural, business and sporting events (2nd ed.). Pearson Prentice Hall.
Yamaç, Z. (2014 ). A research on students of Sakarya University towards image perception of Sakarya destination [Master’s thesis]. Sakarya University.
Yaraşlı, G. Y. (2007). Destinasyon imajı ve Trabzon yöresine dönük bir çalışma [Destination image and a study on Trabzon province] [Master’s thesis, Başkent University]. Institutional Repository of Başkent University. https://acortar.link/fmECMx
Yaşlıoğlu, M. M. (2017). Factor analysis and validity in social sciences: Application of exploratory and confirmatory factor analyses. Istanbul University Journal of the School of Business , 46(Special Issue), 7-85. https://acortar.link/iyIQia
Notes