Demographic and socioeconomic characterization of the Immediate Region of Teófilo Otoni, MG between 1991 and 2010
Caracterização demográfica e socioeconômica da Região Imediata de Teófilo Otoni-MG entre 1991 e 2010
Caracterización demográfica y socioeconómica de la Región Inmediata de Teófilo Otoni-MG entre 1991 y 2010
 Sérgio Lana Morais sergio.morais@ifnmg.edu.br
Geraldo Lopes Júnior jantoniodeus@uol.com.br
Duval Magalhães Fernandes duval@pucminas.br
Sérgio Lana Morais sergio.morais@ifnmg.edu.br
Geraldo Lopes Júnior jantoniodeus@uol.com.br
Duval Magalhães Fernandes duval@pucminas.br
Demographic and socioeconomic characterization of the Immediate Region of Teófilo Otoni, MG between 1991 and 2010
Revista Cerrados (Unimontes), vol. 21, núm. 02, pp. 56-84, 2023
Universidade Estadual de Montes Claros
Recepción: 16 Septiembre 2022
Aprobación: 23 Abril 2023
Publicación: 01 Agosto 2023
Abstract: The Immediate Geographical Region of Teófilo Otoni (RGIm Teófilo Otoni) is composed of 27 municipalities and reveals itself in different demographic and infrastructural conditions from the other regions of the State of Minas Gerais, Brazil. In this sense, the objective of this article is to describe and evaluate the main demographic indicators for the municipalities that make up RGIm Teófilo Otoni between 1991 and 2010 for the purposes of general characterization based on this new spatial arrangement. The database used was obtained from repositories of planning and research institutions, such as the Brazilian Institute of Geography and Statistics (IBGE), Ministry of Health (DATASUS), and the João Pinheiro Foundation (FJP), and allowed the measurement of the following variables: total urban and rural population; distribution of the total population by age group according to sex; degree of urbanization; total fertility rate; annual geometric population growth rate; life expectancy at birth; mortality rate, and Municipal Human Development Index between the years 1991 and 2010, in addition to the migratory dynamics for the year 2010. The characterization allowed us to identify that, although there have been improvements in the demographic and socioeconomic conditions of this portion of the territory of Minas Gerais, the values found remained lagged in comparison to other regions of Minas Gerais. The perspective is that the data presented may help to understand some socio-spatial dynamics for a portion of the state that still lacks research and/or technical-scientific information.
Keywords: Demographic indicators, Socioeconomic indicators, Immediate Region of Teófilo Otoni, Mucuri Valley, Indicadores demográficos, Indicadores socioeconômicos, Região Imediata de Teófilo Otoni, Vale do Mucuri.
Resumo: A Região Geográfica Imediata de Teófilo Otoni (RGIm Teófilo Otoni) é composta por 27 municípios e se revela em condições econômicas, demográficas e infraestruturais discrepantes das demais regiões do estado de Minas Gerais. Neste sentido, o objetivo deste artigo é descrever e avaliar os principais indicadores demográficos para os municípios constituintes da RGIm Teófilo Otoni entre os anos de entre 1991 e 2010, para fins de caracterização geral a partir deste novo arranjo espacial. A base de dados utilizada foi obtida em repositórios de instituições de planejamento e pesquisa, tais como: Instituto Brasileiro de Geografia e Estatística (IBGE), Ministério da Saúde (DATASUS) e Fundação João Pinheiro (FJP), permitindo mensurar as seguintes variáveis: população total, urbana e rural; distribuição da população total por faixa etária segundo o sexo; grau de urbanização; taxa de fecundidade total; taxa de crescimento geométrico anual da população; esperança de vida ao nascer; taxa bruta de mortalidade e Índice de Desenvolvimento Humano Municipal entre os anos de 1991 e 2010, além da dinâmica migratória para o ano de 2010. A caracterização realizada permitiu identificar que, embora tenha havido melhorias nas condições demográficas e socioeconômicas desta porção do território mineiro, os valores encontrados se mantiveram defasados em comparação a outras regiões de Minas Gerais. A perspectiva é que os dados apresentados possam auxiliar na compreensão de algumas dinâmicas socioespaciais para uma parcela do estado que ainda carece de pesquisas e/ou de informações técnico-científicas.
Resumen: La Región Geográfica Inmediata de Teófilo Otoni (RGIm Teófilo Otoni) está compuesta por 27 municipios y se presenta en condiciones económicas, demográficas y de infraestructurales discrepantes de las demás regiones del Estado de Minas Gerais. En ese sentido, el objetivo de este artículo es describir y evaluar los principales indicadores demográficos de los municipios que integran el RGIm Teófilo Otoni entre 1991 y 2010 para efectos de una caracterización general a partir de esta nueva ordenación espacial. La base de datos utilizada fue obtenida de repositorios de instituciones de planificación e investigación, tales como: Instituto Brasileño de Geografía y Estadística (IBGE), Ministerio de Salud (DATASUS) y Fundación João Pinheiro (FJP) y permitió la medición de las siguientes variables: población total, urbana y rural; distribución de la población total por grupos de edad según sexo; grado de urbanización; tasa de fertilidad total; tasa de crecimiento geométrico anual de la población; La esperanza de vida al nacer; tasa bruta de mortalidad e Índice de Desarrollo Humano Municipal entre los años 1991 y 2010, además de la dinámica migratoria para el año 2010. La caracterización realizada permitió identificar que si bien hubo mejoras en las condiciones demográficas y socioeconómicas de esta porción del territorio de Minas Gerais, los valores encontrados permanecieron rezagados en comparación con otras regiones de Minas Gerais. La perspectiva es que los datos presentados puedan ayudar a comprender algunas dinámicas socioespaciales para una porción del estado que aún carece de investigación y/o información técnico-científica.
Palabras clave: Indicadores demográficos, Indicadores socioeconómicos, Región Inmediata de Teófilo Otoni, Valle de Mucuri.
Introduction
Regardless of epistemological orientation, the Region comprises one of the most polysemic categories of analysis in Geography. The socio-spatial transformations, fragmentation and articulation of territories have led to the proposal of regionalization processes according to certain criteria and interests that will serve certain purposes (GOMES, 2003). Therefore, it is assumed that a primary function of regionalization is to instrumentalize and assist in the process of understanding the geographic space. Therefore, it is unlikely that they will completely meet two or more objectives (DUQUE; RAMOS; SURIÑACH, 2007). Nevertheless, it should be emphasized that regionalization processes will not always have practical purposes, as sometimes they can be “as [an] intellectual exercise that only aims to contribute to a better understanding of the social and territorial reality” (CRUZ, 2020, p. 29).
Given that criteria and intentions change over time, regional studies have become of great importance to the Brazilian Institute of Geography and Statistics (Instituto Brasileiro de Geografia e Estatística – IBGE). The institution has contributed with different models of regional division, either to assist in the process of integration of the national territory or for the adoption of planning and management criteria (IBGE, 2017). Recently, replacing the previous version from the early 1990s, associated with geographic meso- and micro-regions, a new concept of spatial organization was published in 2017. Named Immediate Geographic Regions and Intermediate Geographic Regions, the delimitation was articulated alongside the state planning bodies and aims to contribute to the formulation of space-oriented policies for public and private initiatives, considering the relationships that develop between cities and their influence regions. In this regard,
the Immediate Geographic Regions have their main reference element in the urban network. These regions are structured from nearby urban centers to satisfy the immediate needs of the population, such as purchases of durable and non-durable consumer goods; job search; demand for health and education services; and provision of public services, such as service centers of the National Institute of Social Security (Instituto Nacional do Seguro Social – INSS), the Ministry of Labor, and legal services, among others. […] The Intermediate Geographic Regions organize the territory, articulating the Immediate Geographic Regions through a higher hierarchy hub differentiated from the private and public management flows and the existence of more complex urban functions (IBGE, 2017, p. 20).
In this new spatial arrangement, the municipalities of the state of Minas Gerais were divided into thirteen (13) RGInts and, in turn, into seventy (70) RGIms (IBGE, 2017). In the northeastern portion of the state, the extensive RGInt Teófilo Otoni articulates eighty-six (86) municipalities with an estimated population of 1,220,000 inhabitants (FJP, 2020a) disaggregated into seven (07) RGIms, namely: Águas Formosas, Almenara, Araçuaí, Capelinha, Diamantina, Pedra Azul, and Teófilo Otoni. In this scenario, the city of Teófilo Otoni, with the highest hierarchical level, has the function of commanding the rarefied and incomplete regional urban network.
As detailed in Figure 1, the Immediate Geographic Region of Teófilo Otoni (hereinafter referred to as RGIm Teófilo Otoni) is composed of 27 municipalities, which present different economic, demographic and infrastructural conditions, namely Ataléia, Campanário, Caraí, Carlos Chagas, Catuji, Franciscópolis, Frei Gaspar, Itaipé, Itambacuri, Itaobim, Ladainha, Malacacheta, Monte Formoso, Nanuque, Nova Módica, Novo Cruzeiro, Novo Oriente de Minas, Ouro Verde de Minas, Padre Paraíso, Pavão, Pescador, Ponto dos Volantes, Poté, São José do Divino, Serra dos Aimorés, Setubinha, and Teófilo Otoni.
It is important to note that the new regionalization of RGIm Teófilo Otoni has brought together municipalities that were once linked to the mesoregions of the Jequitinhonha Valley, such as Itaobim, Padre Paraíso, Pontos dos Volantes, Monte Formoso, and Novo Cruzeiro; as well as those from Vale Rio Doce, such as Campanário, Nova Módica, Pescador, and São José do Divino. In turn, the municipalities of Águas Formosas, Bertópolis, Crisólita, Fronteira dos Vales, Machacalis, Santa Helena de Minas and Umburatiba, which previously belonged to the microregion of Nanuque, in the mesoregion of Vale do Mucuri, now form their own arrangement linked to the RGIm Águas Formosas.
A number of authors consider that there is a strong similarity between the socioeconomic and demographic realities experienced by the municipalities of the Jequitinhonha Valley in relation to those located in RGIm Teófilo Otoni, such as economic stagnation, population evasion, and seasonal migration, among other adverse conditions (GARCIA; NUNES, 2008; MARTINS, 2018; FJP, 2020a). Due to the incipient economic/technological organization, along with the low levels of human development, the territories corresponding to Mucuri and Jequitinhonha have long been labeled with pejorative expressions referring to the precarious socioeconomic conditions experienced by the population. As a direct consequence, a considerable portion of the population in these regions is still “forcefully driven to emigrate” (FERREIRA, 2007, p. 262), considering the reduced job offer or even due to restrictive environmental conditions.
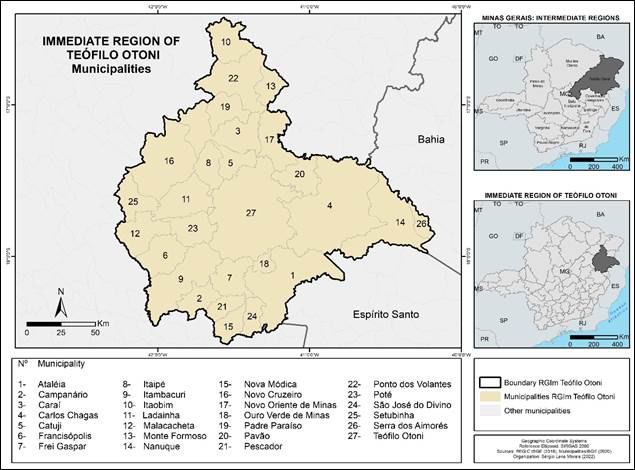
Figure 1
Location of RGIm Teófilo Otoni and the municipalities that constitute it
Authors’ own work based on data from IBGE (2018).
The objective of this article is to describe and evaluate the main geodemographic indicators for the municipalities of RGIm Teófilo Otoni, namely total population at the urban and rural level, distribution of the total population by age group and gender, degree of urbanization; annual geometric growth rate; total fertility rate; and Municipal Human Development Index, in the period between 1991 and 2010, in addition to migration balance, net migration rate, and the Migration Effectiveness Index for the year 2010. An important justification that supports the research concerns the need to better (re)understand the region from a new analytical scale that considers the notion of region of influence. Furthermore, the perspective is that the data presented may help in understanding the socio-spatial dynamics of a portion of the state of Minas Gerais that still lacks research and/or technical-scientific information. The manuscript is organized as follows: first, the data collection and analysis process is presented and, in sequence, the main results for each variable are discussed.
Methodological procedures
For the analysis of the main geodemographic aspects of RGIm Teófilo Otoni, we used secondary data from the following variables: total population, urban and rural; distribution of the total population by age group and gender; degree of urbanization; total fertility rate; annual geometric population growth rate; life expectancy at birth; gross mortality rate and Municipal Human Development Index between the years 1991 and 2010. The reference year for migration data was 2010, enabling the measurement of the migration balance, net migration rate, and Migration Effectiveness Index.
The total disaggregated population, according to household status, gender and age group, was obtained based on the Demographic Census database for the years 1991, 2000 and 2010, available on the IBGE website. The variation in population growth ( Importar imagen) was calculated (between 1991 and 2010 according to the household condition using the formula
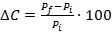
where Total population at the end of the period (Pf)
subtracted from Total population at the beginning of the period (Pi)
divided by Total population at the beginning of the period multiplied by 100. To find out the degree of urbanization for RGIm Teófilo Otoni, we apply the formula:

To calculate the annual geometric growth rate of the population (r), we used the expression
, which represents the number of years in the period. This indicator reveals the pattern and allows the analysis of certain geographic variations of population growth in the period considered (BRASIL, 2000).
The total fertility rate (TFR), which is the main indicator of demographic dynamics, referring to the average number of children a woman would have at the end of her reproductive period, was obtained by adding the specific fertility rates for each age of the resident women aged from 15 to 49 years old (BRASIL, 2000). One of the advantages of applying the TFR, according to Carvalho, Sawyer, and Rodrigues (1998), is that it allows the comparison of fertility levels in different populations, making it possible to evaluate and compare trends in demographic dynamics, as well as subsidizing planning and management processes.
The Municipal Human Development Index (MHDI) is a methodological adjustment of the Universal HDI adapted to the Brazilian reality, considering indicators obtained through the Demographic Census. Applied in Brazil since 1998, the MHDI is considered a synthetic measure that allows establishing a temporal and spatial comparison between municipalities, helping to formulate public policies that are linked to the improvement of people’s quality of life at the municipal level. Its calculation reference is the dimensions used to assess the level of human and social development, namely: longevity (life expectancy at birth calculated by an indirect method), education (education of the adult population and the school flow of the young population), and income (Gross National Income per capita). Its final index is the arithmetic mean of the three variables and ranges between 0.000 and 1.000, with five subclasses of human development, namely: 0.000 to 0.499 – very low; 0.500 to 0.599 – low; 0.600 to 0.699 – average; 0.700 to 0.799 – high; and 0.800 to 1.000 – very high. Thus, the closer to 0, the worse are the human development conditions in the municipality, and conversely, the closer to 1, the better are the living conditions of the population (PNUD, 2013).
Migration data applicable to the municipalities of RGIm Teófilo Otoni were obtained through the platform developed by the João Pinheiro Foundation (Fundação João Pinheiro – FJP), which gathers information at the municipal level on migratory movements, based on the 2010 Demographic Census (FJP, 2017). The totalized data used were the number of immigrants and emigrants who had some migratory experience up to the fixed date of 7/31/2005, i.e., five years before the Census was carried out. Based on this data, it was possible to calculate the migratory balance or the difference between emigration and immigration for each municipality, as well as the Migration Effectiveness Index (MEI), which refers to “the migratory potential of a given area in terms of population absorption or evasion (BAENINGER, 1999, p. 11).
The MEI is the quotient between the migratory balance and the total volume of migrants (immigrants plus emigrants), varying between -1 and 1. The closer to 1, the greater the population absorption capacity. In turn, when the indicator is close to -1, it means greater population evasion, and around zero there is an indication of migratory turnover, which points to a balance between immigrants and emigrants (IBGE, 2012). In the end, the result was compared with the classification by Oliveira and Oliveira (2011) to verify the migratory potential, according to the scores available in Chart 1. One of the advantages of applying the MEI, according to Tavares and Pereira Neto (2019, p. 119), is that this “index shows the relationship between entry and exit of the population, allowing a comparison between places, irrespective of the absolute volume of entry and exit.”
| Classes do IEM | Classification of the potential for migratory absorption |
| -0.51 to -1.00 | Area of strong migratory evasion |
| -0.30 to -0.50 | Area of average migratory evasion |
| -0.10 to -0.29 | Area of low migratory evasion |
| 0.09 to -0.09 | Area of migratory turnover |
| 0.10 to 0.29 | Area of low migratory absorption |
| 0.30 to 0.50 | Area of average migratory absorption |
| 0.51 to 1.00 | Area of strong migratory absorption |
| VARIABLE | INFORMATION | CALCULATION METHOD | SOURCE |
| Total population | Total number of people residing in a given geographic area, in the year considered. | Direct use of the database, expressing the results in absolute numbers and percentages. | IBGE: Demographic Census of 1991, 2000, and 2010. |
| Geometric mean annual growth rate of resident population | Percentage of average annual increase of the resident population, in a given geographic space, in the year considered between two demographic censuses. | Subtract 1 from the nth root of the final population, divided by the population at the beginning of the considered period, multiplying the result by 100. | IBGE: Demographic Census of 1991, 2000, and 2010. |
| Degree of urbanization | Percentage of population residing in urban areas, in a given geographic space, in the year considered. | Resident urban population divided by total resident population x 100. | IBGE: Demographic Census of 1991, 2000, and 2010. |
| Distribution of the population by sex, according to age groups | Illustrative form of graphical representation of the population structure by sex and age groups for a given geographic area. | Total number of people residing and their relative structure, according to sex and specific age groups, in a given geographic space, in the year considered. | IBGE: Demographic Census of 1991, 2000, and 2010. |
| Total fertility rate | Average number of children born alive, given by a woman at the end of her reproductive period, in a given geographic space. | It is obtained by summing the specific fertility rates for each age of resident women aged 15 to 49 years. | Ministry of Health: DATASUS (1991, 2000, and 2010). |
| Life expectancy at birth | Average number of years of life expected for a newborn, maintaining the existing mortality pattern, in a given geographic space, in the year considered. | It is the number corresponding to an initial generation of births (l0), determining the cumulative time lived by that same generation until the age limit (T0). Life expectancy at birth is the quotient of T0 divided by l0. | Ministry of Health: DATASUS (1991, 2000, and 2010). |
| Migration balance (MB) | Migratory balance is the result of the difference between emigration and immigration in a given period and in a given geographic area. | Result of subtracting immigration from emigration at the reference date. | Atlas of Migration by the João Pinheiro Foundation (2017) |
| Net Migration Rate (NMR) | It represents the migratory phenomenon and its impact in relation to the total population of the geographic unit in the period considered. | Quotient of exchanges between immigrants and emigrants and the total population at the end of the reference period. | Atlas of Migration by the João Pinheiro Foundation (2017) and 2010 Population Census |
| Migration Effectiveness Index (MEI) | It demonstrates the relationship between the entry and exit of the population, making it possible to compare the migratory phenomenon between different regions. | The IEM is the result of dividing the migratory balance by the number of emigrants added to the immigrants for a given geographic area. | Atlas of Migration by the João Pinheiro Foundation (2017) |
Results and discussions
The presentation and discussion of the results will be divided into two subsections. In the first, information, maps and analyses will be demonstrated, at the municipal level, regarding the dynamics and spatial distribution of the total resident population, as well as the variation in its growth for RGIm Teófilo Otoni between the years 1991 to 2010. The second subsection will assess other indicators of demographic dynamics, such as fertility, age distribution, and migration, in addition to information on human development for the study area.
Dynamics and spatial distribution of the population
Total population
The data suggest a clear differentiation in terms of the volume of populations in RGIm Teófilo Otoni, which reflects the demographic range for some municipalities, such as the cases of Teófilo Otoni and Campanário, which, throughout the period observed, comprised the municipalities located at both extremes of the population analysis – the former, with an absolute population almost always greater than 130,000 inhabitants, while the latter remained with a population of less than 4,000 inhabitants. Thus, the municipality with the largest demographic size in 2010 represented more than 37 times the size of the one with the smallest population.
Given the above, when considering only the demographic size of the municipalities, the primacy of the city of Teófilo Otoni is evident, as regional urbanization was marked by the strong orientation of the population and economic activities to this city specifically. Consequently, the urban network of Mucuri became developed in a rarefied manner, confirming the theses of Amorim Filho (1990) and Batella (2013) regarding the embryonic aspect of the regional urban network with few articulations in intra- and interregional spaces.
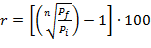
In Figure 2, we present the choropleth cartograms with the spatial distribution of the population of RGIm Teófilo Otoni. In the map of the total population for the year 1991 (Figure 2A), the municipality of Teófilo Otoni ranked as the largest population center in the region, which makes it possible to identify three peripheral areas with different groupings: the first with a population of over 23,000 inhabitants, consisting only of the municipalities of Nanuque (43,090 inhabitants) and Novo Cruzeiro (30,748 inhabitants); second, a large group of 18 municipalities with an intermediate population, ranging between 5,000 and 23,000 inhabitants; and finally, five municipalities in a peripheral position with an absolute population of less than 4,500 inhabitants, namely: Monte Formoso (4,471 inhabitants), Nova Módica (4,419 inhabitants), Pescador (4,349 inhabitants), São José do Divino (4,245 inhabitants), and Campanário (3,100 inhabitants).
The absolute population for the year 2000 was accounted for at 475,919 people. Despite the reduction in the total population, at that time, the highest concentrations were found in the same municipalities mentioned in the previous paragraph, namely: Teófilo Otoni (129,424 inhabitants), Nanuque (41,619 inhabitants), and Novo Cruzeiro (30,453 inhabitants). Similarly, the municipalities with an absolute population of less than 5,000 inhabitants continued to be: Monte Formoso (4,411 inhabitants), Nova Módica (4,100 inhabitants), Pescador (4,037 inhabitants), São José do Divino (3,863 inhabitants), and Campanário (3,419 inhabitants).
Figure 2:
Collection of maps with the spatial distribution of the population for RGIm Teófilo Otoni (1991 and 2010)
A) Immediate Region of Teófilo Otoni Total Population 1991 Inhabitants. B) Immediate Region of Teófilo Otoni Urban Population 1991 Percentage (%).C) Immediate Region of Teófilo Otoni Rural Population 1991Percentage (%). D) Immediate Region of Teófilo Otoni Total Population 2010 Inhabitants. E) Immediate Region of Teófilo Otoni Urban Population 2010 Percentage (%). F) Immediate Region of Teófilo Otoni Rural Population 2010 Percentage (%). G) Immediate Region of Teófilo Otoni Total Population Growth 1991-2010 Inhabitants. H) Immediate Region of Teófilo Otoni Urban Population Growth 1991-2010 Percentage (%). I) Immediate Region of Teófilo Otoni Rural Population Growth 1991-2010 Percentage (%).
Source: IBGE: 1991 and 2010 Demographic Censuses. Organized by the authors.Finally, RGIm Teófilo Otoni had, in 2010, 483,010 inhabitants, of which 134,745 (or 27.9% of the total) resided in the municipality of Teófilo Otoni (Figure 2D). In sequence, the municipalities with the largest population groups were: Nanuque (40,834 inhabitants, equivalent to 8.5%), Novo Cruzeiro (30,725 inhabitants or the equivalent of 6.4%), Itambacuri (22,809 inhabitants, equivalent to 4.7%), Caraí (22,343 inhabitants, equivalent to 4.6%) and Carlos Chagas (20,069 inhabitants, equivalent to 4.2%). All other municipalities in the study area had a total population of less than 20,000 inhabitants when the last Census was carried out, representing demographic dimensions that interfere in the structuring of the urban network and in the regional socioeconomics.
The variability shown by the difference in the total population reported between the years 1991 and 2010 is spatialized in Figure 2G. In this context of high population losses, the highlights were the municipalities of Pavão (-6,384 inhabitants), Ataléia (-3,435 inhabitants) and Carlos Chagas (-3,218 inhabitants). As for the municipalities of Serra dos Aimorés, Nanuque, Ouro Verde de Minas, Frei Gaspar, and Franciscópolis, the population loss in the period ranged from -3,217 to -1,128 inhabitants. The municipalities of Novo Cruzeiro, Catuji, Novo Oriente de Minas, Nova Módica, Pescador and São José do Divino also presented negative values, albeit closer to stability. Conversely, the municipalities that presented population gains were grouped into three classes, with the highest values being reported in Ponto dos Volantes (2,746 inhabitants), Itaipé (3,161 inhabitants), and Teófilo Otoni (4,728 inhabitants).
Urban population
A
According to the 1991 Demographic Census, the urban population residing in RGIm Teófilo Otoni was 263,774 inhabitants. The cities of Teófilo Otoni (101,111 inhabitants), Nanuque (38,586) and Itaobim (14,739) had the largest absolute population contingents. This triad of cities, in subsequent census periods, maintained the same positions in the rankings, with Teófilo Otoni (102,812 and 110,076, respectively), Nanuque (37,781 and 36,789, respectively), and Itaobim (16,076 and 15,779, in that order). In turn, the municipalities with the smallest populations in the urban space were, as of 1991, Setubinha (796), Monte Formoso (800), and Novo Oriente de Minas (855); in the year 2000, the smallest populations were recorded in Monte Formoso (1,379 inhabitants), Setubinha (1,432 inhabitants), and Catuji (1,574 inhabitants). In 2010, the minimum values were associated with the municipalities of Catuji (1,692 inhabitants), Monte Formoso (1,700 inhabitants) and Frei Gaspar (1,916 inhabitants). Consequently, the geometric annual growth rate of the urban population for the region between 1991 and 2000 was 0.8%.
The percentage of the urban population in 1991 is shown in Figure 2B. When considering relative values, the largest populations were found in Nanuque (89.5%), Serra dos Aimorés (79.0%), Teófilo Otoni (77.8%), and Itaobim (72.4%). This is followed by a group with an intermediate urban population of 44-65% consisting of Carlos Chagas, São José do Divino, Pescador, Campanário, Itambacuri and Padre Paraíso. In the other 17 municipalities, most of the population was concentrated in rural areas, especially in the Northwest region of the region. It should be noted that the very low percentage values in relation to the municipalities of Setubinha (8.3%) and Novo Oriente de Minas (7.9%) refer to a period in which they had not yet become incorporated.
In 1991, only 54.1% of the population lived in urban areas, a value that increased in subsequent Demographic Censuses, reaching 60.0% in 2000 and 62.8% in 2010. Despite that, the degree of urbanization of municipalities in the region by the end of the 2010s could be considered low. Nevertheless, when analyzing the evolution of the urbanization rate in the municipalities, we verify a large growth that is directly associated with the reduction of the rural population, although some municipalities still present a larger portion of this population.
In 2010, the highest proportions of the urban population were found in municipalities located on the eastern edge of the study area, such as Nanuque (90.1%), Teófilo Otoni (81.7%), Serra dos Aimorés (80.5%), Pescador (78.9%), and Itaobim (75.1%) (Figure 2E). In some cases, the growth of urbanization was extensive, as in Novo Oriente de Minas, whose share of the urban population went from 7.9% in 1991 to 42.8% in 2010, due to the process of political incorporation of two districts that until then belonged to the Teófilo-Otoni territory. Inversely, the municipalities with a majority of the population residing in rural areas were concentrated in the central-western portion of the region, bordering the Jequitinhonha Valley, the main ones being Novo Cruzeiro (34.2%), Caraí (32. 2%), Setubinha (25.7%), Ladainha (25.4%), and Catuji (25.2%). The geometric rate of annual growth of the urban population in the region between 2000 and 2010 was 0.6%, a value slightly lower than that observed in the previous decade.
The comparison of the variation in urban population growth between the years 1991 and 2010 is spatialized in Figure 2H. The biggest increases were reported in the municipalities of Novo Oriente de Minas (417.08%), Setubinha (252.0%), Monte Formoso (112.5%), Itaipé (94.1%), and Ponto dos Volantes (72.1%). Among the factors that contributed to influence these dynamics, we can relate the process of incorporation that occurred throughout the 1990s for the municipalities in question, except for the municipality of Itaipé, and the importance of rural-urban migration as a promoter of the process of regional urbanization. Conversely, the absolute negative change in the urban population was verified only in the municipalities that constitute the extreme east of the region, such as Serra dos Aimorés (-16.2%), Pavão (-6.5%), Carlos Chagas (-5.4%), and Nanuque (-4.7%). In this case, migration is also possibly the key to understanding, being however associated with the urban-urban movement targeting cities with a more dynamic economy in neighboring states due to geographical proximity, such as Teixeira de Freitas, Bahia (BA) and/or São Mateus, Espírito Santo (ES).
Rural population
The rural population of RGIm Teófilo Otoni in 1991 (Figure 2C) was accounted for at 224,156 inhabitants and the municipality with the largest contingent was Teófilo Otoni with 28,906 residents, whose total exceeded the absolute population of almost all other municipalities at that time, except for Nanuque and Novo Cruzeiro. In addition to Teófilo Otoni, Novo Cruzeiro (24,249 inhabitants) and Caraí (17,021 inhabitants) were the municipalities with the highest concentrations of people residing in rural areas. In relative terms, the municipalities of Novo Oriente de Minas and Setubinha had more than 90% of their population residing in rural areas, as they were still districts of the municipalities of Teófilo Otoni and Malacacheta, respectively. In turn, the municipalities with the lowest percentages found at the time were Nanuque (10.5%), Serra dos Aimorés (21.0%), and Teófilo Otoni (22.2%).
In the year 2000 Census, the rural population of RGIm Teófilo Otoni was reported to be at 190,331, corresponding to an absolute loss of more than 33,800 inhabitants compared to the previous decade. Taking the period 1991-2000 as a reference, there were losses in the rural population across all municipalities of RGIm Teófilo Otoni, except for Ponto dos Volantes, which experienced an increase of approximately 1,200 inhabitants in the period considered, and Itaipé, which had an additional 581 inhabitants. The municipality of Teófilo Otoni remained as the largest contingent with a rural population of over 26,600 inhabitants, while the smallest rural population was recorded in the municipality of Campanário (only 993 inhabitants). In relative terms, the municipality of Nanuque (9.2%), Serra dos Aimorés and Teófilo Otoni (both with 20.6%) had the lowest participation of the rural population. Between 1991 and 2000, the geometric rate of annual growth of the rural population was -1.6%, which summarizes well the condition of expropriation of this segment of the population in the region.
In 2010, the largest rural populations were found in the municipalities of Teófilo Otoni (24,669 inhabitants), Novo Cruzeiro (20,203 inhabitants), and Caraí (15,152 inhabitants). The municipalities of Campanário, Pescador and São José do Divino had the lowest populations in rural areas that year. The municipalities of Ladainha, Catuji and Setubinha had a larger number of rural population. Between the 1991 and 2010 Censuses, the rural population of RGIm Teófilo Otoni experienced a reduction of more than 44,200 inhabitants.
Data from the 2010 Census confirm the process of emptying the rural area, as relative losses of this population were recorded in almost all municipalities surveyed (Figure 2I). The greatest losses occurred in the municipalities of Pavão (-64.0%), Ouro Verde de Minas (-53.1%), and São José do Divino (-47.1%). Given the above, although the region has strong rural ties (FJP, 2020b), it is reasonable to consider that there was a process of deruralization in the municipalities of RGIm Teófilo Otoni. This flow has followed from east to west since the 1990s for most municipalities and is expected to continue in the coming years due to the stagnation of agricultural activity in the region and the occurrence of extreme weather events, which have devastated some municipalities in the region. recent years, such as severe droughts. Contradicting this dynamic, the growth of the rural population was observed only in the municipalities of Ponto dos Volantes (16.9%), Itaipé (12.5%) and Padre Paraíso (1.7%), even so in very low percentage values.
Life expectancy at birth and total fertility rate
Life expectancy at birth for RGIM Teófilo Otoni between 1991 and 2010 increased by 9.9 years. In 1991, the life expectancy of a person born in the region, if mortality patterns persisted, was 62.6 years. In 2000, it increased to 67.3 years, and in 2010, it reached 72.5 years. The mean values observed throughout time series, comparatively, are lower than those recorded for RGInt Teófilo Otoni itself (63.5 years in 1991; 67.9 years in 2000; and 73.2 years in 2010) and for the rest of the year. State of Minas Gerais (66.4 years in 1991; 70.6 years in 2000; and 75.3 years in 2010) (FJP, 2017). When broken down by municipality, the highlight was Nanuque, which remained with the longest longevity throughout the analyzed period (66.5 years in 1991; 70.4 years in 2000; and 76.2 years in 2010). Conversely, the municipality of Setubinha obtained the lowest values for this variable (58.8 years in 1991; 63.5 years in 2000; and 69.6 years in 2010).
Regarding the total fertility rate (TFR) component, the data show that there was a reduction across all analyzed municipalities, as well as in the average values for RGIm Teófilo Otoni (Figure 3). In 1991, the fertility observed in the region was 4.1 children per woman of reproductive age; in 2000, it reduced to 3.4 children; and finally, in 2010, it reached the rate of 2.3 children, a value considered slightly higher than necessary for ensure the natural replacement of the population, which is 2.1 children born alive per woman at the end of her reproductive period.
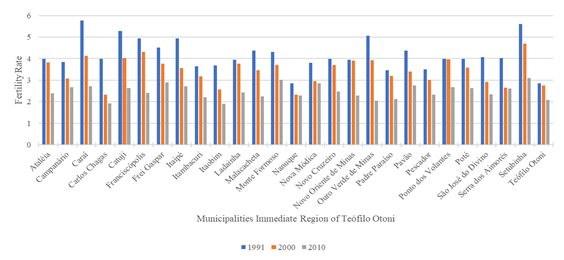
Figure 3:
Total fertility rate for the municipalities of RGIm Teófilo Otoni (1991, 2000, and 2010)
Source: Ministry of Health (DATASUS). Organized by the authors.
Although TFR values are falling in the region, compared to the rest of the state of Minas Gerais, the rates found remain high (state average of 1.6 children in 2010). When breaking down by municipality, we found that only Itaobim and Carlos Chagas – both with 1.9 children per woman – had values below the replacement rate in 2010. In turn, women of reproductive age residing in the municipalities of Setubinha and Monte Formoso had, on average, three children, a quantity that can be considered high for contemporary demographic standards. Horta (2016) notes that the regions of the state of Minas Gerais that have the highest fertility rates are also those with the worst socioeconomic conditions, such as RGInt Teófilo Otoni, which covers the former Jequitinhonha and Mucuri mesoregions.
Age distribution
Reductions in the main components of demographic dynamics in recent decades have resulted in changes in the age structure of the regional population. In Figure 4, we find the percentage distribution of the population by gender and according to age groups for RGIm Teófilo Otoni in the years 1991, 2000 and 2010 compared to the state of Minas Gerais. From what could be verified, to a large extent, the age composition presents a certain similarity with what was observed in Minas Gerais, where a strong tendency for the reduction of fertility was observed, justifying the shortening of the base of the graph, i.e., the young population. At the other extreme, with the increase in the number of older individuals, an enlargement can be seen at the top of the graph, altering the pyramidal shape that was peculiar in the graph of the region in the early 1990s. Despite the changes in the age structure of the young population, when comparing with state data, a larger population can be found in the region. Throughout the analyzed period, there was a certain balance between the male and female populations, with a slight predominance of women in the overall composition.
In 1991, the relative participation of young people in the total population of RGIm Teófilo Otoni was 39.3%, while in 2010, it fell to 26.7%, while in the state of Minas Gerais for the same period there was a reduction, starting at 33.9% and reaching 22.4%. As for the elderly population (over 65 years old), there was an increase in this age group, whose relative participation in 1991 corresponded to 5.2% of the total in the region to 9.4% in 2010. In Minas Gerais, this percentage also increased, going from 4.9% to 8.3%, highlighting a phenomenon that is closely correlated with the drop in fertility seen in the previous decade. As a consequence of the absolute reduction of the young population and expansion of the regional aging process, a short window of opportunity is expected due to the drop in the dependency ratio due to the decrease in the first group, i.e., there will be a lower inactive population depending on the population active in the region in the coming years (FJP, 2020a).
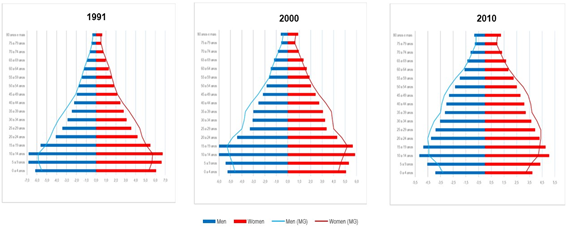
Figure 4:
Percent distribution of the population by sex, according to age groups, for RGIm Teófilo Otoni and Minas Gerais (1991, 2000, and 2010)
Source: IBGE – Demographic Census. Organized by the authors.
Migratory flows
Migratory movements have always been present in the regional historical scenario, whether with the arrival of European immigrants in the 19th century, transplanted by the Captaincy of Commerce and Navigation of Mucuri (ACHTSCHIN, 2018), or in the pioneering fronts of occupation, as occurred in the basin of the Pampã River (tributary of the Mucuri River) which reproduced historical and cultural aspects similar to those of the Middle Jequitinhonha (MARTINS, 2018). This phenomenon was also characterized by the intense rural-urban migration that, in recent decades, emptied the rural areas of most municipalities. Even today, however, multiple factors are present in the Jequitinhonha and Mucuri Valleys that lead the population to emigrate, a condition that has a greater influence on the regional demographic dynamics than the components associated with fertility and mortality (FJP, 2020a).
Figure 5 presents the total values obtained for emigration and immigration, as well as the Migration Balance, the Net Migration Rate and the Migration Effectiveness Index for the study area. Migratory movements, with reference to the fixed date of 7/31/2005, represented an arrival of 24,385 immigrants, while 44,063 residents left the region, resulting in a negative migratory balance of -19,678 people. Of the 27 municipalities selected, only Ponto do Volantes (200) and Setubinha (236) recorded positive values for net migration. In the other municipalities, negative results were identified, with the highest absolute losses being reported in Teófilo Otoni (-3,581 people), Malacacheta (-2,138 people), Nanuque (-1,962 people), Novo Cruzeiro (-1,671 people), and Carlos Chagas (-1633). Together, these municipalities accounted for more than 56% of the population loss in RGIm Teófilo Otoni. The value of the migratory balance for Teófilo Otoni suggests that the municipality may be used as an intermediate stage in the migratory process, i.e., in an initial phase, migrants leave the municipalities of the region for the city of Teófilo Otoni and, later, complete the movement towards other municipalities in Minas Gerais or other states.
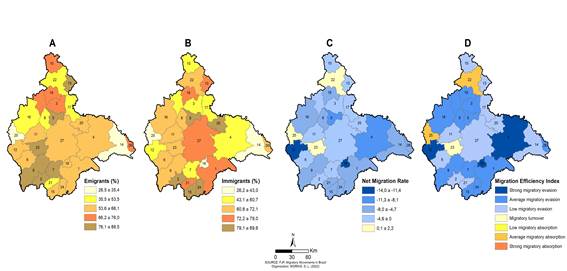
Figure 5:
Collection of maps with the migratory dynamics for the municipalities of RGIM Teófilo Otoni according to a fixed date of 7/31/2005
Source: João Pinheiro Foundation: migratory movements in Brazil. Organized by the authors.
The municipalities that produced the most emigrants, in relative terms, were Monte Formoso (88.5%), Poté (87.7%), Campanário (83.9%), Itambacuri (82.7%), and Catuji (82.1%). In general, it was found that 60.1% opted for intrastate migration, with only 23.3% moving to municipalities belonging to RGInt Teófilo Otoni. This percentage found confirms the thesis associated with low regional attractiveness, as most emigrants directed their migration project towards other regions of the state (36.8%) or the country (39.9%). The relative values for emigration are spatialized in Figure 5A.
As for the immigrants who arrived at RGIm Teófilo Otoni at the reference date, 64.9% were from municipalities located in the state of Minas Gerais, among whom 43.9% came from RGInt Teófilo Otoni itself and 21.0% came from other municipalities in Minas Gerais. In the latter case, it is interesting to note that the municipalities that obtained the highest percentages form a cluster in the southern portion of the study area, namely: Nova Módica (89.7%), São José do Divino (85.2%), Pescador (79.1%), and Itambacuri (77.2%) which appear to be closer to the migratory issue – as well as the economic issue – with other locations, such as Governador Valadares and Mantena, which may justify, in part, the results. For 35.1% of immigrants, the municipality of origin was located in other states. The relative values for immigration are spatialized in Figure 5B.
One of the factors that go hand in hand with the low migratory retention capacity in the region is associated with its socioeconomic profile. According to information from the FJP, RGIm Teófilo Otoni is essentially composed of municipalities whose main source of revenue are the primary sectors of the economy. Additionally, industrial participation in the composition of GDP is quite small, and consequently, a considerable part of the municipalities rely on the Public Administration, due to the absence of other sectors that drive economic growth (FJP, 2020b). Another aspect to be considered is that the economic dynamism happens in a way targeted at the most important municipalities in the region, which are in a very small number.
In response to economic reality, more recent migratory networks have been established between some cities in the region and other locations. Some flows are older and are more structured, while others appear to be more recent and need more detail in future research. In this sense, the work of Garcia et al. (2008) verified the migratory dynamics from some selected municipalities in the Minas Gerais portion of the Mucuri river basin, while Santos and Silva (2018) sought to identify the socioeconomic profile of emigrants from Poté who move to the footwear hub of Nova Serrana, in a context of targeted migration. In fieldwork conducted in the Mucuri region, it was possible to identify signs that may corroborate the abovementioned dynamic, such as the chartering of tourist vehicles and the sale of tickets departing from a number of municipalities, on a weekly basis, adopting the following itineraries: Malacacheta / Poté / Teófilo Otoni to Nova Serrana and from Ladainha / Teófilo Otoni to Ubatuba / North Coast of São Paulo.
The values for the municipal net migration rate are shown in Figure 5C and was -4.1% for RGIm Teófilo Otoni. Even though Teófilo Otoni is the municipality with the highest absolute migration balance (loss of 3,581 people), the observed net migration rate was only -2.7%, demonstrating that the impact in relative terms on its population was not as effective. Conversely, the municipalities of Ouro Verde de Minas (-14.0%) and Malacacheta (-11.4%) had much higher net rates, and considering their demographic size, emigration is capable of causing greater impacts on the population and in the municipal economy than in Teófilo Otoni. In other words, the municipalities that have higher (or negative) migratory balances will not always be the ones with the most difficulties regarding the impacts caused by migration.
The average MEI reported for RGIm Teófilo Otoni was -0.29 (Figure 5D), which in the classification by Oliveira and Oliveira (2011) points to an area of low migratory evasion. It is worth noting, however, as the average value obtained was at the upper limit for this score and just 0.01 from the average dropout range. When considering the MEI individually, the municipalities of Ouro Verde de Minas, Carlos Chagas and Malacacheta were classified as areas of strong migratory evasion. A total of 11 municipalities obtained a classification of average migratory evasion, namely: Ataléia, Caraí, Catuji, Frei Gaspar, Itambacuri, Itaipé, Nova Módica, Novo Cruzeiro, Padre Paraíso, São José do Divino, and Serra dos Aimorés. A third class of municipalities consisting of Campanário, Franciscópolis, Itaobim, Ladainha, Monte Formoso, Nanuque, Novo Oriente de Minas, Pavão, Pescador and Teófilo Otoni was classified as having low migratory evasion. Poté was defined as an area of migratory turnover, and finally, the municipalities of Ponto dos Volantes and Setubinha were rated as places of low migratory absorption. None of the municipalities fit the classifications of medium or strong migratory absorption, confirming the trend of population repulsion that is characteristic of the municipalities assessed and the incipient capacity to attract potential immigrants.
Municipal Human Development Index (MHDI)
For the purpose of analyzing the conditions of social development in the municipalities of RGIm Teófilo Otoni, we used data from the Municipal Human Development Index (MHDI) as a basic indicator. Thus,
Figure 6 shows the absolute values and variations of this indicator for the reference years 1991, 2000, and 2010.
In 1991, all municipalities surveyed had MHDI classified as Very Low and had the worst results in the education sub-index (PNUD, 2013). In that year, the minimum value observed was in the municipality of Monte Formoso, with a reference of only 0.174 – the lowest recorded in Minas Gerais – while the highest index was observed in the municipality of Nanuque, with 0.451. In the year 2000, the condition of precariousness was maintained for the vast majority of municipalities that remained classified as having Very Low or Low Human Development, especially in the northern and northwestern portions of the study area, which correspond to the municipalities that were inserted or that are geographically closer to the Jequitinhonha Valley. In other words, the MHDI values for the year 2000 show that, despite the positive variations presented by all the municipalities analyzed, improvements were not enough to position the region at another level of socioeconomic development. This happens because, in societies that are in more vulnerable conditions, any changes in the components that make up the index tend to promote substantial changes in the final reference value, to the point that in more developed societies, changes do not always reflect in an increase in the indicator.
Therefore, the positive variation in some municipalities in the period 1991-2000 is notorious, such as the percentages observed in Monte Formoso (109.8%), Franciscópolis (96.6%), Catuji (91.9%), and Ouro Verde de Minas (83.4%). Conversely, progress was made in the classification of the municipalities of Itaobim, Itambacuri, Campanário, Pescador, Nova Módica, São José do Divino, Teófilo Otoni, Carlos Chagas, Nanuque, and Serra dos Aimorés, which moved to the Medium Human Development level (0.600 to 0.699). In the period 2000-2010, the greatest positive variation occurred in Franciscópolis, with 51.1%, moving from a condition of very low to a condition of medium human development, an aspect that may be related to the extraction of dimension stones in the locality. The other municipalities that underwent significant changes were Monte Formoso (48.2%), Ponto dos Volantes (48%), Frei Gaspar (47.1%), and Novo Oriente de Minas (42.7%), which migrated from a condition from very low to low human development.
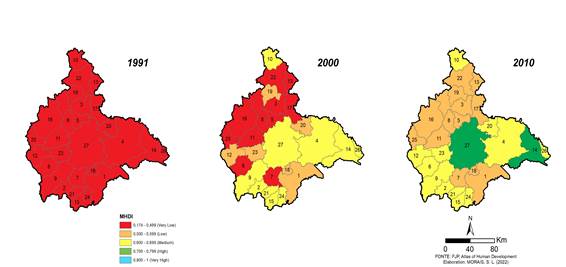
Figure 6:
Evolution of the Municipal Human Development Index of RGIm Teófilo Otoni (1991, 2000, and 2010)
Source: UNDP (2013). Organized by the authors.
In 2010, it is possible to infer that there was a slight improvement in the indicators of the municipalities, especially in those located in the northwestern section of the region, with variations always above 15% being identified for all municipal units. The changes, although incipient, allowed some of them to climb at least one step on the development scale. In turn, the municipalities of Itaobim, Itambacuri, Campanário, Nova Módica, Pescador, São José do Divino, Carlos Chagas and Serra dos Aimorés maintained a certain condition of stagnation, remaining in the same classification as the previous decade (Medium Human Development), a situation also identified for the municipalities of Padre Paraíso, Ouro Verde de Minas, and Ataléia, which maintained in the condition of Low Human Development. The municipalities in better conditions of development were Teófilo Otoni and Nanuque, both with 0.701, but still at a threshold very close to the previous class. The municipalities that reported the lowest values for the MHDI in 2010 were Ladainha (0.541), Monte Formoso (0.541), and Catuji (0.540).
When associating MHDI data with those related to population dynamics, we find that the municipalities that showed the highest levels of growth in their human development indicator were the same ones that reported the highest population growth rates, especially for the urban population, as is the specific case of Teófilo Otoni and Nanuque. The socioeconomic conditions experienced by the population contribute to the MHDI for the mapped municipalities, even today, being classified as medium human development (0.606), while, comparatively, in the state of Minas Gerais, the average is 0.731 reaching 0.727 in the rest of the Brazil, which represents a high MHDI.
Even with the socioeconomic increased observed at the beginning of this century and the greater degree of urbanization of the municipalities, precarious socioeconomic conditions are still found in RGIm Teófilo Otoni. Consequently, no municipality in the study area has an MHDI classified as very high and, of the fifteen (15) municipalities in Minas Gerais with the worst HDI in 2010, seven (7) continued to belong to RGIm Teófilo Otoni, namely: Catuji (0.540), Ladainha (0.541), Monte Formoso (0.541), Setubinha (0.542), Itaipé (0.552), Novo Oriente de Minas (0.555), and Caraí (0.558) (UNDP, 2013).
Final remarks
The definition of Intermediate and Immediate Geographical Regions adopted by the IBGE to replace the old forms of regionalization has made it possible to conduct interesting essays based on an unprecedented spatial organization format. RGIm Teófilo Otoni was included in this article, with an analysis of its main geodemographic characteristics. As we have seen, most municipalities in the region have a total population of less than 20,000 inhabitants when the 2010 Census was conducted, justifying very modest demographic dimensions that interfere in the urban network and in the regional socioeconomics. When analyzing the population, according to the condition of the domicile, we verified that there was an increase in the urban population due to the reduction in the rural population for virtually all analyzed municipalities, justifying a process of deruralization of the region that was more intense in the 1990s.
Regarding the total fertility rate component, the data show that there was a reduction across all municipalities analyzed, although it still remains high when compared to the state average, which was 1.6 children per woman in 2010. As regards factors associated with life expectancy, it was identified that the average values of the entire time series, comparatively, are lower than those recorded for RGInt Teófilo Otoni itself and for the rest of the State of Minas Gerais. Concerning MHDI rates were found in the surveyed area, which did not have any municipality classified as having very high human development, as well as the presence of seven municipalities ranking among the worst indicators in the State.
As for the migratory context, the uninviting profile of the region and the incipient capacity of the municipalities to attract potential immigrants was verified. In this sense, the development of affirmative policies, such as the recent internalization of Universities and Federal Institutes, in addition to the process of diversification of economic/productive activities, appear to be configured as key strategies to minimize population evasion.
Furthermore, the perspective is that the data presented may help in understanding the socio-spatial dynamics for a portion of the state of Minas Gerais that still lacks research and/or technical-scientific information. Finally, it is possible that other research proposals may be presented based on the points discussed in this article, such as the analysis of migration originating from RGIm Teófilo Otoni towards new potential flows, such as the North Coast of São Paulo or abroad.
Acknowledgments
The authors would like to thank the Coordinator’s Office for the Improvement of Higher Education Personnel (CAPES), for granting a scholarship to the first author and for enabling the development of this research.
References
ACHTSCHIN, M. A formação econômica, política, social e cultural do Vale do Mucuri. Teófilo Otoni: publicação do autor, 2018.
AMORIM FILHO, O. B. A rede urbana da Bacia do Mucuri. Revista Geografia e Ensino, Belo Horizonte, v. 3. n.1, p. 26-36, 1990.
BAENINGER, R. Região, Metrópole e Interior: Espaços Ganhadores e Espaços Perdedores nas Migrações Recentes - Brasil, 1980-1996. Texto Nepo, [S./l.], v. 35, 1999. Available at: <https://www.nepo.unicamp.br/publicacoes/textos_nepo/textos_nepo_35.pdf>. Retrieved: Jun 3, 2022.
BATELLA, W. B. Os limiares das cidades médias: reflexões a partir da cidade de Teófilo Otoni-MG. 2013. 228 f. Tese (Doutorado) - Universidade Estadual Paulista Júlio de Mesquita Filho, Faculdade de Ciências e Tecnologia, 2013. Available at: <http://hdl.handle.net/11449/105083>. Retrieved: May 25, 2022.
BRASIL. Ministério da Saúde. Indicadores Socioeconômicos. In: DATASUS. Indicadores e dados básicos para a saúde - Brasil. 2000. Available at: <http://tabnet.datasus.gov.br/cgi/idb2000/apresent.htm>. Retrieved: Aug 3, 2022.
CARVALHO, J. A. M.; SAWYER, D. O.; RODRIGUES, R. N. Introdução a alguns conceitos básicos e medidas em demografia. 2. ed. São Paulo: ABEP, 1998.
CRUZ, R. C. A. Ensaio sobre a relação entre desenvolvimento geográfico desigual e regionalização do espaço brasileiro. GEOUSP Espaço e Tempo (Online), [S./l.], v. 24, n. 1, p. 27-50, 2020. Available at: <https://www.revistas.usp.br/geousp/article/view/155571/160430>. Retrieved: Aug 3, 2022.
DUQUE, J. C.; RAMOS, R.; SURIÑACH, J. Supervised regionalization methods: A survey. International Regional Science Review, [S./l.], v. 30, n. 3, p. 195-220, 2007.
FERREIRA, V. O. Paisagem, recursos hídricos e desenvolvimento econômico na Bacia do Rio Jequitinhonha, em Minas Gerais. 2007. 313 f. Tese (Doutorado em Geografia), Departamento de Geografia da Universidade Federal de Minas Gerais, Universidade Federal de Minas Gerais, Belo Horizonte, 2007.
FUNDAÇÃO JOÃO PINHEIRO (FJP). Plataforma dos Movimentos Migratórios no Brasil. Belo Horizonte, 2017. Available at: <http://migracao.fjp.mg.gov.br/>. Retrieved: Jul 30, 2022.
FUNDAÇÃO JOÃO PINHEIRO (FJP). Informativo FJP: Aspectos Demográficos da Região Geográfica Intermediária de Teófilo Otoni. Belo Horizonte, nº 03, 2020a. Available at: <http://fjp.mg.gov.br/regiao-geografica-intermediaria-de-teofilo-otoni/>. Retrieved: May 20, 2022.
FUNDAÇÃO JOÃO PINHEIRO (FJP). Informativo FJP: Contas Regionais – PIB da Região Geográfica Intermediária de Teófilo Otoni. Belo Horizonte, nº 02, 2020b.
GARCIA, R. A.; NUNES, M. A.; OLIVEIRA, A. S. de. A espacialidade dos fluxos migratórios dos municípios da bacia do Rio Mucuri em Minas Gerais. Cadernos do Leste, [S. l.], v. 8, n. 8, p. 464-501, 2008. Available at: https://periodicos.ufmg.br/index.php/caderleste/article/view/13095?articlesBySameAuthorPage=3. Retrieved: Jun 3, 2022.
GOMES, Paulo Cesar da Costa. O conceito de região e sua discussão. In: CASTRO, Iná Elias de; GOMES, Paulo Cesar da Costa; CORREA, Roberto Lobato (orgs). Geografia: conceitos e temas. 6. ed. Rio de Janeiro: Bertrand Brasil, 2003, p. 49-75.
HORTA, C. J. G. Nível recente da fecundidade em Minas Gerais e Regiões de Planejamento. Anais do 17º Seminário sobre a Economia Mineira. Belo Horizonte, MG: Universidade Federal de Minas Gerais, 2016. Available at: https://diamantina.cedeplar.ufmg.br/portal/download/diamantina-2014/nivel-recente-da-fecundidade-em-minas-gerais-e-regioes-de-planejamento.pdf. Retrieved: Jun 3, 2022.
INSTITUTO BRASILEIRO DE GEOGRAFIA E ESTATÍSTICA (IBGE). Censo Demográfico 2010. Resultados Gerais da Amostra, 2012. Available at: https://biblioteca.ibge.gov.br/visualizacao/periodicos/99/cd_2010_resultados_gerais_amostra.pdf. Retrieved: Jul 30, 2022.
INSTITUTO BRASILEIRO DE GEOGRAFIA E ESTATÍSTICA (IBGE). Divisão regional do Brasil em regiões geográficas imediatas e regiões geográficas intermediárias. Coordenação de Geografia. Rio de Janeiro: IBGE, 2017.
MARTINS, Marcos Lobato. A formação regional do Mucuri: o homem, o rio e a mata no nordeste de Minas Gerais. São Paulo: Annablume, 2018.
OLIVEIRA, L. A. P.; OLIVEIRA, A. T. R. (Orgs.) Reflexões sobre os deslocamentos populacionais no Brasil. Série Estudos e Análises: Informação demográfica e socioeconômica. n.1. Rio de Janeiro: IBGE, 2011.
PROGRAMA DAS NAÇÕES UNIDAS PARA O DESENVOLVIMENTO (PNUD). Atlas de desenvolvimento humano e econômico. Brasília: PNUD/IPEA/FJP, 2013.
SANTOS, M. A.; SILVA, C. A. S. De Poté para Nova Serrana: a migração intraestadual em Minas Gerais. Anais da Associação Brasileira de Estudos Populacionais, 2019, p. 1-18. Available at: http://www.abep.org.br/publicacoes/index.php/anais/article/view/3306/0. Retrieved: Jun 3, 2022.
TAVARES, J. M. S.; PEREIRA NETO, C. P. Migrações no Brasil: uso de indicadores para identificação de diferenças regionais. Caminhos de Geografia, Uberlândia, v. 20, n. 70, p. 113-135, 2019. Available at: https://seer.ufu.br/index.php/caminhosdegeografia/article/view/42413. Retrieved: 8 jul. 2022.
Notes
Address: Rua Mocambi, 295, Bairro Viriato, Teófilo Otoni, MG, Brazil, CEP: 39.800-430.
Address: Rua Mocambi, 295, Bairro Viriato, Teófilo Otoni, MG, Brazil, CEP: 39.800-430.
Address: Av. Itaú, 505 – Prédio Emaús – Dom Cabral – Belo Horizonte, Brazil, CEP: 30.535-012