Original Research Papers
Molecular characterization of ginger genotypes using RAPD and SSR markers
Molecular characterization of ginger genotypes using RAPD and SSR markers
Journal of Horticultural Sciences, vol. 17, núm. 1, pp. 95-102, 2022
Society for Promotion of Horticulture

Esta obra está bajo una Licencia Creative Commons Atribución-NoComercial-CompartirIgual 4.0 Internacional.
Recepción: 31 Julio 2021
Revisado: 20 Enero 2022
Aprobación: 02 Marzo 2022
Abstract: Genetic diversity among ginger genotypes collected from different parts of the country was studied using molecular markers (30 RAPD and 55 SSR). Compared to RAPD primers SSR primers were efficient in distinguishing the genotypes. A total of 86 and 23 polymorphic bands were observed with RAPD and SSR primers, respectively. Percentage polymorphism observed between RAPD and SSR primers was 97.40 % and 56.54 %. Grouping of genotypes by using combined data of RAPD and SSR primers indicated that irrespective of their place of collection or geographical origin, 30 genotypes were clustered into different groups which showed that, each individual genotype is having wider variability or it might be due to the genetic similarity existing among them.
Keywords: Ginger, molecular markers, monomorphic and polymorphic.
INTRODUCTION
Ginger of commerce is the underground rhizome of Zingiber officinale Rosc. (2n=22), belonging to the family Zingiberaceae and it is originated from South- East Asia. It is one of the oldest and most important spices, being cultivated in Tropical Asia for over 3000 years. It is one of the earliest oriental spices known to Europe and is still in large demand today. The rhizomes may be scraped or peeled before drying and are esteemed for their aroma, flavour and pungency. It may also be used in powdered form (Purseglove et al., 1981). Largest collection of ginger germplasm (675 accessions) is being conserved at ICAR-Indian Institute of Spices Research, Kozhikode, Kerala which is also NAGS centre of ginger.
Most of the varieties have vernacular names and as the crop is propagated vegetatively hence the chances of mixing are very high. Generally, ginger genotypes are identified based on morphological traits, but the assessment of these traits is difficult and their evaluation can be subjective considering that most of these cultivars are related. Most of the ginger cultivars are not easily differentiated based on rhizome or aerial morphological features, further confounding the confusion to a greater extent.The development in molecular approaches for identification of plant varieties/genotypes seems to be more effective than the traditional morphological markers because it allows direct access to the hereditary material and makes it possible to understand the relationships, between plants (Williams et al., 1990; Paterson et al., 1991). Molecular marker technology is the powerful tool for determining genetic variation in ginger genotypes as they can reveal abundant difference among genotypes at the DNA level, providing a more direct, reliable and efficient tool for germplasm characterization, conservation, management and untouched by environmental influence. Although RAPD markers are suitable for genetic diversity analysis of clonal organisms (Bardakci, 2001), SSR markers are more reproducible and useful in evaluating genetic diversity and cultivar identification (Goulao and Oliveira 2001; Pomper et al., 2010; Nas et al., 2011). In view of the above, the present study used both RAPD and SSR markers to analyze the presence of diversity among different ginger genotypes
MATERIAL AND METHODS
Plant material
Twenty-seven ginger genotypes, one Zingibersp., one Curcuma sp. and one Kaempferia sp. collected from different parts of the country and maintained at NAGS centre IISR, Kozhikode were used in the study (Table S1).
Genomic DNA isolation
Young leaves from 45-60 days old plants were selected for DNA isolation. Genomic DNA was isolated using the CTAB method (Syamkumar et al., 2003). One gram of young, clean leaf was ground in liquid nitrogen into fine powder with the help of pestle and mortar. DNA was extracted with CTAB extraction buffer. DNA was purified and quantified by gel (0.8% agarose gel) based quantification.
RAPD and SSR analysis
Thirty randomly selected RAPD primers were used in the study (Table S2). A 25 µl reaction mixture was prepared as follows: 3 µl of dNTP (10 mM), 1 µl primer (10 mM), 3.5 µl of 10 X reaction buffer with 15mM MgCl., 0.5 µl of Taq DNA polymerase (3 U/ μl) and 1.6 µl of template DNA. PCR amplification was done in a thermocycler with an initial denaturation of 94 °C for 3 minutes followed by 35 cycles of 94 °C for 45 seconds, annealing at 37 °C for 45 seconds and extension at 72 °C for 1 minute followed by a final extension at 72 °C for 15 minutes. The PCR amplified products were analysed on a 1.5 % agarose gel stained with ethidium bromide. The gels were digitally photographed by Bio-Imaging systems (Syngene GBOX-CHEMI, England).
A set of 55 SSR primers were used in the present study viz., 22 EST SSR primers (Anu, 2016), eight ginger genomic SSR primers (Lee et al., 2007), 18 genomic SSR primers (Siju et al., 2010a) and 7 EST SSR primers (Siju et al., 2010b) from Curcuma longa (Table S3). A 20 µl reaction mixture was prepared as follows: 2 µl of dNTP (10 mM), 2 µl primer (10 mM), 2.5 µl of 10 X reaction buffer with 15mM MgCl., 0.2 µl of Taq DNA polymerase (3 U/μl) and 1.5 µl of template DNA. PCR amplification was done in a thermocycler with an initial denaturation of 94 °C for 5 minutes followed by 35 cycles of 94 °C for 45 seconds, 45 seconds of annealing temperature (52-65 °C) and extension at 72 °C for 1 minute followed by a final extension at 72 °C for 20 minutes. The PCR amplified products were analysed on a 3.0 % agarose gel stained with ethidium bromide. The gels were digitally photographed by Bio-Imaging systems (Syngene GBOX-CHEMI, England).
Data analysis
The independent as well as combined data generated for 30 genotypes from RAPD and SSR primers were subjected to statistical analysis. RAPD and SSR products were scored visually for presence (1) and absence (0) of bands. The scores were used to create a data matrix to analyze genetic relationship using the NTSYS-pc program version 2.02 (Exeter Software, New York, USA) described by Rohlf (1990). A dendrogram was constructed based on Jaccard’s similarity coefficient (Jaccard, 1908) using the marker data from the ginger with unweighted pair group method (UPGMA). Parameters such as PIC and genotypic gene diversity were estimated by using the formula developed by Anderson et al. (1993) and Mariette et al. (2002), respectively.
RESULTS
Molecular variability of ginger genotypes through RAPD
Using RAPD analysis, polymorphic fragments were generated in ginger genotypes. The selection of primers was based on clear, scorable and reproducible amplified banding patterns.
Out of 30 primers used, 11 RAPD primers showed amplification and the number of amplification products obtained was specific to each primer. The size of the amplified products varied from 400 to 2800 bp. Of the 11 primers, ten primers viz., OPA 09, OPA 17, OPA 18, OPB 08, OPD 03, OPD 07, OPD 18, OPH 08, OPI 07 and OPL 12 were found to show 100 per cent polymorphism which is presented in Table 1. Of the 88 total alleles observed, 86 alleles were polymorphic and maximum numbers of 14 alleles were obtained with primer OPL 12, followed by primer OPA 09 and OPI 07 with 10 alleles. Minimum numbers of 3 alleles were generated with primer OPD 03. Thus, amplifications varied across the primer employed. Among the 11 RAPD primers, the Polymorphism Information Content (PIC) was high in OPD 03, OPD 07 and OPH 08 (0.998) (Table 1).
| Primers | Totalallele | MB | PB | % MM | % PM | Total amplicons | Allele brange | PIC | Genotypic gene diversity |
| OPA 09 | 10 | 0 | 10 | 0 | 100 | 55 | 750-2600 | 0.981 | 0.816 |
| OPA 17 | 6 | 0 | 6 | 0 | 100 | 80 | 1000-2500 | 0.985 | 0.555 |
| OPA 18 | 8 | 0 | 8 | 0 | 100 | 98 | 400-1800 | 0.988 | 0.591 |
| OPB 08 | 6 | 0 | 6 | 0 | 100 | 107 | 500-1500 | 0.996 | 0.448 |
| OPD 03 | 3 | 0 | 3 | 0 | 100 | 87 | 1000-2000 | 0.998 | 0.275 |
| OPD 07 | 7 | 0 | 7 | 0 | 100 | 92 | 1500-2300 | 0.998 | 0.561 |
| OPD 18 | 9 | 0 | 9 | 0 | 100 | 169 | 500-2800 | 0.993 | 0.324 |
| OPH 08 | 8 | 0 | 8 | 0 | 100 | 70 | 1200-2700 | 0.998 | 0.708 |
| OPH 15 | 7 | 2 | 5 | 28.57 | 71.43 | 111 | 1000-2300 | 0.997 | 0.390 |
| OPI 07 | 10 | 0 | 10 | 0 | 100 | 175 | 400-2600 | 0.993 | 0.358 |
| OPL 12 | 14 | 0 | 14 | 0 | 100 | 253 | 400-2800 | 0.988 | 0.437 |
| Total | 88 | 2 | 86 | 28.57 | 1071 | 10.92 | 5.463 | ||
| Mean | 8 | 0.18 | 7.82 | 2.59 | 97.40 | 117.90 | 0.99 | 0.50 |
Each RAPD pattern was compared with other patterns and genetic similarity matrix for all the thirty genotypes was constructed from binary data of markers using Jaccard’s algorithm.
The coefficient of genetic similarity ranged from 39 - 97 per cent. Maximum similarity of 95 per cent was noticed between Himachal and Zaheerabad local. Further, the information generated out of RAPD banding pattern was used for clustering through unweighted mean pair group arithmetic mean method (UPGMA) (Fig. 1).The genotypes were divided into two main groups, I and II sharing 39 % similarity which were further subdivided into clusters. Among the genotypes, two
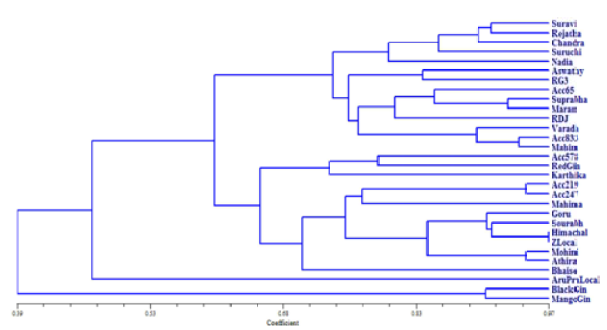
Fig. 1
UPGMA dendrogram based on RAPD markers using Jaccard’s similarity coefficient
genotypes (black ginger and mango ginger) were grouped under group I with sharing similarity of 90% and other 28 genotypes (Suravi, IISR Rejatha, KAU Chandra, Suruchi, Nadia, Aswathy, RG 3, Acc. 65, Suprabha, Maran, Rio de Janeiro, IISR Varada, Acc. 833, Mahim, Acc. 578, Red ginger, Karthika, Acc. 219, IISR Mahima, Gorubathane, Sourabh, Acc. 247, Mohini, Athira, Bhaise, Arunachal Pradesh local, Himachal and Zaheerabad local) were grouped under group II with sharing similarity of 47 %.
Group II consisted of two sub clusters namely A and B sharing similarity of 47 %. Cluster A consisted of one genotype viz., Arunachal Pradesh local. Cluster B was sub divided into C and D sharing similarity of 60 %. Group C further divided into cluster E and F sharing approximately 65 % similarity. Cluster E was subdivided into G and H sharing 70 % similarity. Cluster G consisted only one genotype Bhaise. Cluster H consisted of nine genotypes (Acc. 219, Acc. 247, Mahima, Gorubathane, Sourabh, Himachal, Zaheerabad local, Mohini and Athira). Among the nine genotypes, Himachal and Zaheerabad local showed 97% similarity followed by 94 % similarity was observed between Mohini and Athira as well as Acc. 219 and Acc. 247. Cluster F consisted of three genotypes viz., Acc. 578, red ginger and Karthika showing 71 % similarity.
Molecular variability of ginger genotypes through SSR
Out of 55 SSR primers screened, sixteen primers amplified and produced 34 alleles among them 25 were polymorphic bands and 10 were monomorphic bands. SSR fragments ranged from 100 to 1200 bp in size (Table 2).
Maximum number of alleles detected was seven from ZOM 103 primer. With the average of 62.80 per cent polymorphism produced by sixteen SSR primers, cent per cent polymorphism was detected by the primers ZOC 11, ZOC 28, ZOC 156, ZOC 33, ZOM 064, ZOM 140 and CLEST 16. Polymorphism information content (PIC), a measure of gene diversity was an average of 0.92 with a range of 0.889 by ZOM 033 to 0.982 by CLEST 16 primer.
Jaccard’s similarity coefficients among the thirty genotypes helped to establish genetic relationships (Fig. 2). Phylogenetic analyses of thirty genotypes, conducted on SSR banding patterns, indicated that maximum percentage of similarity (100 %) was observed between KAU Chandra, IISR Mahima and Mohini; IISR Rejatha and Nadia; Acc 65, Suprabha and Maran; Rio de Janeiro and Sourabh; Suruchi and Acc. 833; IISR Varada and Bhaise.
Thirty ginger genotypes were used to study their variability through SSR analysis using sixteen primers. The SSR pattern obtained for these genotypes with different primers were defined by the presence or absence of bands. Each SSR pattern was compared with each other and euclidean distance matrix was calculated for all the 30 ginger genotypes. The relationship among the genotypes was represented as dendrogram using UPGMA.
The genotypes were divided into two main groups, I and II sharing 59 % similarity. Group I comprised of only one genotype, mango ginger. Group II was further subdivided into cluster A and B with similarity
| Primers | Totalallele | MB | PB | % MM | % PM | Total amplicons | Allele brange | PIC | Genotypic gene diversity |
| ZOC 11 | 1 | 1 | 0 | 100 | 0 | 30 | 250 | 0.893 | 0 |
| ZOC 28 | 3 | 0 | 3 | 0 | 100 | 31 | 150-280 | 0.923 | 0.655 |
| ZOC 92 | 1 | 1 | 0 | 100 | 0 | 30 | 190 | 0.943 | 0 |
| ZOC 98 | 3 | 1 | 2 | 33.33 | 66.66 | 88 | 250-280 | 0.952 | 0.022 |
| ZOC 100 | 2 | 1 | 1 | 50 | 50 | 58 | 150-170 | 0.922 | 0.033 |
| ZOC 156 | 3 | 0 | 3 | 0 | 100 | 36 | 150-250 | 0.897 | 0.60 |
| ZOC 33 | 1 | 0 | 1 | 0 | 100 | 29 | 180 | 0.889 | 0.633 |
| ZOM 040 | 2 | 1 | 1 | 50 | 50 | 42 | 190-210 | 0.921 | 0.3 |
| ZOM 055 | 1 | 1 | 0 | 100 | 0 | 30 | 190 | 0.921 | 0 |
| ZOM 064 | 1 | 0 | 1 | 0 | 100 | 28 | 250 | 0.954 | 0.066 |
| ZOM 103 | 7 | 2 | 5 | 28.57 | 71.43 | 101 | 150-1200 | 0.988 | 0.545 |
| ZOM 107 | 3 | 1 | 2 | 33.33 | 66.66 | 32 | 190-400 | 0.893 | 0.644 |
| ZOM 111 | 1 | 1 | 0 | 100 | 0 | 30 | 300 | 0.906 | 0 |
| ZOM 140 | 2 | 0 | 2 | 0 | 100 | 58 | 140-150 | 0.940 | 0.033 |
| CLEST 15 | 1 | 1 | 0 | 100 | 0 | 30 | 150 | 0.948 | 0 |
| CLEST 16 | 2 | 0 | 2 | 0 | 100 | 56 | 170-190 | 0.982 | 0.066 |
| Total | 34 | 11 | 23 | 695.23 | 904.75 | 709 | 14.87 | 3.597 | |
| Mean | 2.12 | 0.68 | 1.43 | 43.45 | 56.54 | 44.31 | 0.92 | 0.22 |
percentage of 74. Cluster A consisted of 2 genotypes (Acc. 578 and black ginger) sharing similarity of approximately 81 %. Cluster B was subdivided into 2 clusters C and D sharing percentage similarity of 84 %. Cluster C divided into 2 sub clusters E and F with 89 % similarity. Cluster E consisted of 4 genotypes namely Red ginger, Athira, Karthika and Zaheerabad local sharing 92 % similarity. Cluster F consisted of 8 genotypes viz., Suruchi, Acc. 833, Aswathy, RG 3, IISR Varada, Bhaise, Acc. 219 and Gorubathane. Among the 8 genotypes Suruchi and Acc. 833 shared 100 % similarity; IISR Varada and Bhaise were also 100 % similar to each other.
Cluster D was subdivided into 2 clusters namely G and H with similarity percentage of approximately 88%. Cluster G consisted of 7 genotypes sharing 91 % similarity, among 7 genotypes Acc. 65, Suprabha and Maran showed 100 % similarity and Rio de Janeiro and Sourabh were also 100 % similar. Cluster H consisted 8 genotypes sharing 91 % similarity, among them genotypes KAU Chandra, IISR Mahima and Mohini were 100 % similar. Similarly, genotypes IISR Rejatha and Nadia also showed 100 % similarity.
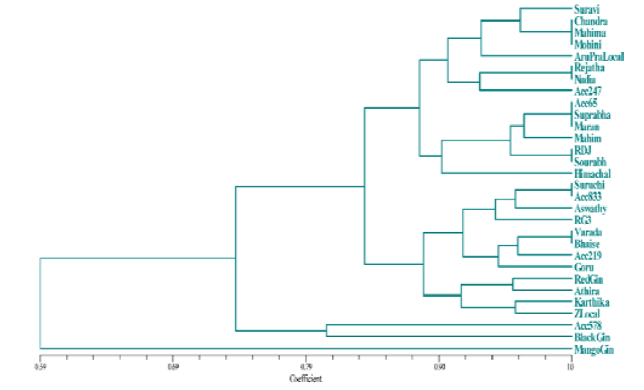
Fig. 2
UPGMA dendrogram based on SSR markers using Jaccard’s similarity coefficient
Cluster A consisted of only one genotype i.e., Mango ginger. Cluster B further divided into cluster B and D with 53 % similarity. Cluster C consisted of two genotypes (Himachal and Zaheerabad local) sharing approximately 63 % similarity. Cluster D is subdivided into cluster E and F sharing similarity percentage of 68. Cluster E was subdivided into G and H with 72% similarity. Cluster G consisted of eight genotypes namely Acc. 219, IISR Mahima, Gorubathane, Mohini, Athira, Acc 247, Sourabh and Bhaise. Among them, Acc. 247 and Sourabh showed maximum similarity of 90 %. Cluster H consisted of three genotypes, Acc. 578, Red ginger and Karthika sharing 77 % similarity. Cluster F was divided into 2 clusters, I and J sharing 77 % similarity. Cluster I consisted of nine genotypes namely Aswathy, RG 3, Acc. 65, Suprabha, Maran, Rio de Janeiro, IISR Varada, Acc. 833 and Mahim. Among them, genotypes Suprabha and Maran showed 100 % similarity. Cluster J consisted of 5 genotypes (Suravi, KAU Chandra, IISR Rejatha, Suruchi and Nadia) sharing approximately 83 % similarity.
Comparison of RAPD and SSR marker systems for their efficacy in assessing genetic diversity of ginger genotypes
To compare the utility of the two marker systems, thirty ginger genotypes were analyzed with eleven RAPD and sixteen SSR primers. Various parameters viz., total number of alleles, number of polymorphic bands per assay unit, mean percentage of polymorphism per assay, number of monomorphic bands per assay and polymorphic information content (PIC) value were recorded as criteria to differentiate their efficacy and the results are presented in Table 3.
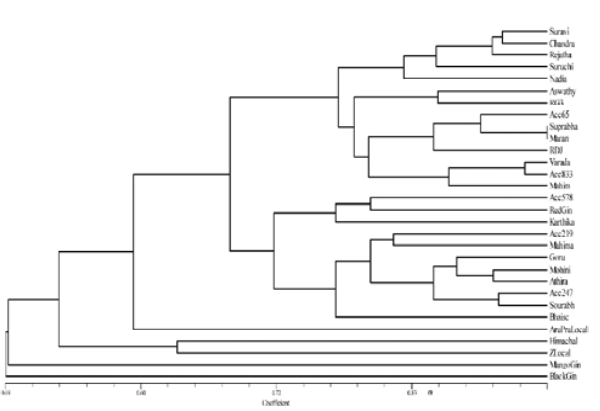
Fig. 3
UPGMA dendrogram based on RAPD and SSR markers using Jaccard’s similarity coefficient
| Components | RAPD | SSR |
| Number of alleles per assay unit | 11 | 16 |
| Total amplicons | 1297 | 709 |
| Total number of alleles | 88 | 34 |
| Mean number of alleles per assay unit | 8 | 2.12 |
| Number of polymorphic bands per assay unit | 7.83 | 1.43 |
| Mean (%) polymorphism per assay | 97.40 | 56.54 |
| Number of monomorphic bands per assay unit | 0.18 | 0.68 |
| Mean PIC per assay | 0.99 | 0.92 |
The mean number of alleles per assay unit, number of polymorphic and monomorphic bands per assay unit in SSR analysis was 16.0, 1.56 and 0.62 respectively, and in case of RAPD primers it was 11.0, 7.82 and 0.18 respectively. Mean percentage of polymorphism per assay was 96.97 % in RAPD, whereas, it is 62.80% in case of SSR primers.
DISCUSSION
Knowledge of the genetic variation within and among populations is an important component for understanding the variability in any crop. Therefore, information on population diversity may be used in selection and crop improvement process. Molecular methods are much faster, more specific, sensitive and accurate. Molecular markers are nowadays widely used to distinguish the genotypes in several horticulture crops (Li et al., 2007; Karimi et al., 2010 and Ansari and Singh 2013 and 2014). As ginger is clonally propagated and it is difficult to distinguish between the genotypes using morphological markers, molecular approaches are highly useful for characterization of ginger genotypes. In the present study 30 RAPD and 55 SSR markers were used to study the genetic variability.
RAPD dendrogram was not associated with exact geographical localities from which the ginger genotypes were collected. The considerable polymorphism detected in this study illustrated that, it is possible to find genetic divergence among ginger cultivars of the same origin. These results are in accordance with Nayak et al. (2005) and Sera et al. (2003), who also reported similar results in ginger and coffee respectively. These results in ginger indicate that, RAPD markers were able to provide more reliable information than morphological characters to identify closely related ginger genotypes (Nayak et al., 2005 and Palai and Rout 2007). Diversity among the cultivars revealed the presence of genotypic diversity among the genotypes. Variability to certain extent might be due to the different environmental conditions.
SSRs are widely used as versatile tool in plant breeding programme as well as in evolutionary studies because of their ability for showing diversity among the cultivars (Adato et al., 1995). Therefore, in the present investigation, out of 55 SSR primers screened, 16 primers amplified and produced 34 alleles among them 23 were polymorphic bands and 11 were monomorphic bands. Pandotra et al. (2013); Das et al. (2016); Jatoi et al. (2006) and Lee et al. (2007) also reported the use of SSR markers to study the variability and genetic diversity existing at the population level.
Dendrogram obtained revealed that, irrespective of their place of collection or geographical origin they have grouped into different clusters which showed that, each genotype selected in the study is having wide variability or it may be due to genetic similarity existing among them. SSR primers used were highly efficient in separating Curcuma sp. from the Zingiber species but those did not distinguish the ginger genotypes based on any character or place of collection. Jatoi et al. (2006) also reported that clustering pattern within the genus Zingiber did not reflect any relationship between genotypic variation and place of collection. Similar results were obtained by Jaleel and Sasikumar (2010) and they reported that, collection of the accessions based on vernacular identity irrespective of the geographical proximity may be the probable reason for this behaviour. It also implies that genes amplified by the markers need not be strictly linked with any agronomic traits.
CONCLUSION
RAPD and SSR primers were used to study the diversity among ginger genotypes collected from different agro climatic regions of the country. Among 11 RAPD primers, ten primers viz., OPA 09, OPA 17, OPA 18, OPB 08, OPD 03, OPD 07, OPD 18, OPH 08, OPI 07 and OPL 12 were found to show 100 per cent polymorphism. Among the sixteen SSR primers, cent per cent polymorphism was detected by the primers ZOC 11, ZOC 28, ZOC 156, ZOC 33, ZOM 064, ZOM 140 and CLEST 16. Irrespective of their place of collection or geographical origin, 30 ginger genotypes were clustered into different groups which showed that, each individual genotype is having wider variability or it may be due to the genetic similarity existing among them.
REFERENCES
Adato, A., Sharon, D. and Lavi, U. 1995. Application of DNA fingerprints for identification and genetic analyses of mango (Mangifera indica) genotypes. J. Am. Soc. Hortic. Sci., 120: 259-264.
Anderson, J. A., Churchill, G. A., Autrique, J. E., Tanksley, S. D. and Sorrels, M. E. 1993. Optimizing parental selection for genetic linkage maps. Genome, 36: 181-186.
Ansari, A. M. and Singh, Y. V. 2013. Molecular diversity of brinjal (Solanum melongena L.) genotypes revealed by RAPD marker. J. Res. (BAU), 25: 41-48.
Ansari, A. M. and Singh, Y. V. 2014. Molecular diversity of brinjal (Solanum melongena L. and S. aethiopicum L.) genotypes revealed by SSR markers. Electron. J. Plant Breed., .: 722-728
Anu, C. 2016. Development of microsatellite markers for small cardamom (Elettaria cardamomum Maton). Ph.D. Dissertation, Mangalore University.
Bardakci, F. 2001. Random amplified polymorphic DNA (RAPD) markers. Turk. J. Biol., 25: 185–196.
Das, A., Gaur, M., Barik, D. P. and Subudhi, E. 2016. Genetic diversity analysis of 60 ginger germplasm core accessions using ISSR and SSR markers. Plant Biosystems, 151(5): 822-832.
Goulao, L. and Oliveira, C. M. 2001. Molecular characterization of cultivars of apple (Malus x domestica Borkh.) using microsatellite (SSR and ISSR) markers. Euphytica, 122: 81–89.
Jaccard, P. 1908. Nouvelles reachers surla distribution florale. Bull. Soc. Vaud. Sci. Nat., 44: 223-270.
Jaleel, K. and Sasikumar, B. 2010. Genetic diversity analysis of ginger (Zingiber officinale Rosc.) germplasm based on RAPD and ISSR markers. Sci. Hortic., 125: 73–76.
Jatoi, S. A., Kikuchi, A., Yi, S. S., Naing, K. W., Yamanaka, S., Watanabe, J. A. and Watanabe,K. N. 2006. Use of rice SSR markers as RAPD Markers for genetic diversity analysis in Zingiberaceae. Breed. Sci., 56: 107-111.
Karimi, R., Ershadi, A., Vahdati, K. and Woeste, K. 2010. Molecular characterization of Persian walnut populations in Iran with microsatellite markers. Hortic. Sci., 45: 1403-1406.
Lee, S. Y., Fai, W. K., Zakaria, M., Ibrahim, H.,Othman, R. Y., Gwag, J. G., Rao, V. R. and Park, Y. J. 2007. Characterization of polymorphic microsatellite markers, isolated from ginger (Zingiber officinale Rosc.). Mol. Ecol. Notes, .(6): 1009-1011.
Li, Z., Lanying, Z. and Qianwen, X. 2007. Identification of RAPD markers linked to thickness gene of shuck in walnut. Adv. Biol. Res., .: 137–140.
Mariette, S., Corre, V. L., Austerlitz, F. and Kremer,A. 2002. Sampling within the genome for measuring within population diversity: trade- offs between markers. Mol. Ecol., 11: 1145- 1156.
Nas, M. N., Bolek, Y. and Bardak, A. 2011. Genetic diversity and phylogenetic relationships of Prunus microcarpa C.A. Mey. subsp. tortusa analyzed by simple sequence repeats (SSRs). Sci. Hortic., 127: 220–227.
Nayak, S., Naika, P. K., Acharya, L., Mukherjee, A. K., Pand, P. C. and Das, P. 2005. Assessment of genetic diversity among 16 promising cultivars of ginger using cytological and molecular markers. Z. Naturforsch., 60c: 485- 492.
Palai, S. K. and Rout, G. R. 2007. Identification and genetic variation among eight varieties of ginger by using random amplified polymorphic DNA markers. Plant Biotechnol., 24: 417-420.
Pandotra, P., Gupta, A. P., Husain, M. K., Gandhiram and Gupta, S. 2013. Evaluation of genetic diversity and chemical profile of ginger cultivars in north-western Himalayas. Biochem. Syst. Ecol., 48: 281-287.
Paterson, A. H., Tanksley, S. D. and Sorreis, M. E. 1991. DNA markers in plant improvement. Adv. Agron., 46: 39-90.
Pomper, K. W., Lowe, J. D., Lu, L., Crabtree, S. B. and Dutta, S. 2010. Characterization and identification of Pawpaw cultivars and advanced selections by simple sequence repeat markers. J. Am. Soc. Hortic. Sci., 135: 143– 149.
Purseglove, J. W., Brown, E. G., Green, C. L. and Robbins, S. R. J. 1981. Ginger. In: Spices, Vol- 2, Longman Inc, New York, pp. 447-532.
Rohlf, F. J. 1990. NTSYS-pc Numerical taxonomy and multivariable analysis system. Exeter software, New York.
Sera, T., Ruas, P. M., Ruas, C. F., Diniz, L. E. C., Carvalho, V. P., Rampin, L., Ruas, E. A. and Silveira, S. R. 2003. Genetic polymorphism among 14 elite Coffea arabica L. cultivars using RAPD markers associated with restriction digestion. Genet. Mol. Biol., 26: 59-64.
Siju, S., Dhanya, K., Syamkumar, S., Sheeja, T. E., Sasikumar, B., Bhat, A. I. and Parthasarathy,V. A. 2010a. Development, characterization and utilization of genomic microsatellite markers in turmeric (Curcuma longa L.). Biochem. Syst. Ecol., 38: 641-646.
Siju, S., Dhanya, K., Syamkumar, S., Sheeja, T. E., Sasikumar, B., Bhat, A. I. and Parthasarathy,V. A. 2010b. Development, characterization and cross species amplification of polymorphic microsatellite markers from expressed sequence tags of turmeric (Curcuma longa L.). Mol. Biotechnol., 44: 140–147.
Syamkumar, S., Lowarence, B. and Sasikumar, B. 2003. Isolation and amplification of DNA from rhizomes of turmeric and ginger. Plant Mol. Biol. Rep., 21: 171a-171e.
Williams, J. G. K., Kubehk, A. R., Livak, K. J., Rafalaki, J. A. and Tingey, S. V. 1990. DNA polymorphism amplified by arbitrary primers are useful as genetic markers. Nucleic Acids research, 18(22): 6531-6535