SAR and Temperature Increase in a Head Model Composed of Several Tisues Produced by Two WiFi Devices Working on the 2.4 GHz Band
SAR y el incremento de temperatura en un modelo de cabeza compuesto por varios tejidos producidos por dos dispositivos WiFi que funcionan en la banda de 2.4 GHz
 Ezequiel Ignacio Espinosa Rivas eiespinosar@ipn.mx
 Roberto Linares y Miranda rlinaresy@ipn.mx
SAR and Temperature Increase in a Head Model Composed of Several Tisues Produced by Two WiFi Devices Working on the 2.4 GHz Band
Científica, vol. 27, núm. 2, pp. 1-14, 2023
Instituto Politécnico Nacional
Recepción: 05/02/2023
Aprobación: 24/05/2023
Resumen: En este trabajo se presenta un análisis de la tasa de absorción especifica (conocida como SAR, por sus siglas en inglés) debida a la exposición de dos fuentes de campo electromagnético en un modelo de cabeza humana; formado por diferentes tejidos. Las fuentes de campo son un modem Wi-Fi y un telefono celular operando ambos a la frecuencia de 2.4 GHz. El campo eléctrico necesario en el cálculo del SAR se obtiene usando una simulación mediante el método de diferencias finitas en el dominio del tiempo (FDTD por sus siglas en inglés). Con el proposito de evaluar como interactua el campo electromagnético con los diferentes tejidos que componen la cabeza humana, especialmente los del cerebro, el SAR es desglosado por tejido y los datos son presentados en diagramas de caja, nueve diferentes tejidos fueron usados en la simulación. Finalmente, utilizando la ecuación de bio-calor en su forma más simple se realiazó un análisis sencillo del incremento de temperatura en cada tejido.
Palabras clave: dispositivos Wi-Fi, distribución del SAR, ecuación de bio-calor, incremento de temperatura, método FDTD.
Abstract: An analysis of the specific absorption rate (SAR) in a model of a human head, composed of several tissues, as a result of the exposure to two electromagnetic sources working on the 2.4 GHz WiFi band is presented; the devices are a WiFi modem and a cell phone. The electric field necessary to get the SAR is calculated using a simulation based on the finite-difference time-domain (FDTD) method. With a view to evaluating how the electromagnetic field interacts in different tissues, specially in brain tissues, the SAR is broken down by tissue, and the data are displayed using box-plots. Nine other tissues were used in the head model. Finally, using a simple bio-heat equation, a simple analysis of the temperature increase is done as well.
Keywords: Bio-heat equation, FDTD method, SAR distribution, Temperature rate, WiFi devices.
I. Introduction
Interaction between the human body, specially the head, and electromagnetic fields (EMFs) produced by cell phones in phone call mode have been intensively analyzed and regulated by international organizations, and some of these results can be found in [1], [2], [3], [4], [5] and [6]. However, as far as we know, there are no similar extensive studies for these mobile devices used as internet access points working with WiFi technology. In this case, the cell phone is not longer used next to the ear instead, it is used several centimeters from the face, which causes the EMF to be a far field, not a near field, as in phone call mode. In addition to this, the usage time can be longer, even several hours watching videos or similar, not just calls for a few minutes.
In Mexico more than 90% of people who use the internet do so or have done so through a cell phone [7], [8]. Due to the above, it is a particular concern to analyze the effects of EMFs working on WiFi bands. In this work, we try to take into consideration the normal operating conditions for an end user of a WiFi communications network. It is assumed that the mobile device, a cell phone, is used at 30 cm from the user's face, and the WiFi modem is located at 2.5 m from the user's right cheek, see Fig. 1.
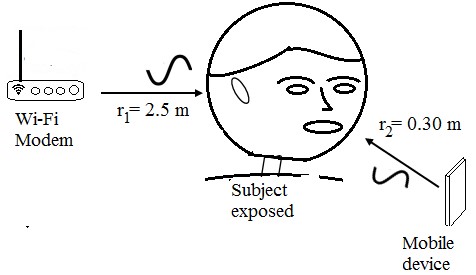
Fig 1.
Subject exposed to electromagnetic waves from two sources
Recommendations from ICNIRP [4], IEEE [5], and FCC [6] establish the limits to which a person can be exposed to EMFs based on the temperature increase. In order to have just a coarse value of temperature increase in the tissues that compose the modeled head, an analysis using the bio-heat equation in its simplest form was carried out.
Any issue that involves EMFs can be solved using Maxwell's equations; however, the shape and the different tissues that compose the human being produce several phenomena, so an analytic solution to find the EMF in a point is a challenging task. Therefore, computational methods are used. The chosen one in this work is the Finite-Difference Time-Domain (FDTD) method.
II. Specific absorption rate (SAR) and bio-heat equation
The specific absorption rate (SAR) indicates the amount of electromagnetic energy, in the form of power, absorbed per unit mass in a volume when it is exposed to EMFs [9]. The SAR is calculated using (1) and it has units of W kg-1.
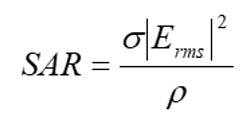 (1)
(1)Where s and r represent the conductivity (S m.1) and mass density (kg m-3) of the tissues, respectively, and Erms is the rms electric field (V m-1).
Standards and recommendations that limit the exposure to EMFs as [4], [5], and [6] use the whole-body averaged SAR as well as a local SAR averaged over 10 g of mass as a value of reference to limit the exposure. However, the averaged value works well in a constant distribution, but SAR is not constant, as can be seen in (1). Even if the electric field were uniform, SAR depends on the conductivity and density of the tissue, and the human body is not composed of regular tissue, so SAR can be a constant value. For that reason, we put particular emphasis on analyzing the SAR in several tissues specially in brain tissues, which can not be studied when measurements in phantoms are made.
SAR is an indirect measure of the temperature increase. Although it is not an easy task to model the thermal energy transport in a living being, many efforts have been made [10], [11], [12], and-[13], and the bio-heat equation given by (2) is widely accepted to perform this task.
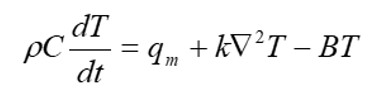 (2)
(2)If the heat diffusion and perfusion are negligibly, namely, the last two terms are zero, and the heat generation by a metabolic process is given by (3):
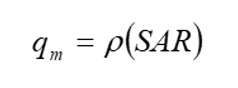 (3)
(3)So, we can rewrite (2) as (4):
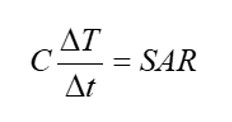 (4)
(4)Which is valid just for homogeneous bodies and exposure times Dt of a few seconds. From the above, it is necessary to get a reliable value of the electric field at each point.
III. Parameters used in the FDTD simulation
The FDTD method was introduced by Yee [14]. All the equations used here are too long to write, and they can be found in textbooks as [15], [16] and [17]. For a more detailed view of all the FDTD equations used in this work, see [18]. The Convolutional Perfect Match Layer (CPML) method [19] was used in the FDTD simulation in order to simulate an open area and avoid wave reflections.
A. INCIDENT ELECTRIC FIELD
Before starting the simulation, it is necessary to know the electric field intensity of the electromagnetic waves that impinge on the object. Electromagnetic waves from WiFi devices working at 2.4 GHz were used in the simulation whose radiated power is regulated by several standards, ERC [20], [21] and ITU [22]. So, using (5), the electric field impinging on the head can be calculated:
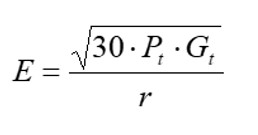 (5)
(5)Where E is the electric field (V m-1) at a distance r (m) from a transmitting antenna, Pt is the power radiated by the antenna (W), and Gt is the numeric gain of the antenna.
The electric field intensity from a mobile device was obtained from the measuring of several devices using an anechoic chamber and an electric field probe ETS LINDGREN model HI-6105. Eighteen devices were tested, and it was noticed that there was a significant dispersion in the data. Still, we wanted just an approximated value in order to use it in the simulation. The value used was 1 V m-1 for the mobile device.
B. SOURCE USED
The FDTD object needs to be excited and to do it, the Total-Field Scattering Field (TFSF) technique was used. The source used was a sine plane wave oscillating at 2.4 GHz, which can be expressed in the computational domain by (6) as [17]:
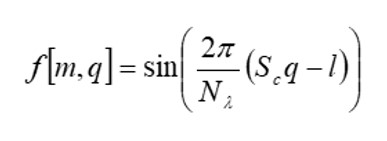 (6)
(6)Where l is the delay in time steeps, Sc is a relationship between the spatial steeps and the time steep called the Courant number [23], the spatial and time steep discretized is represented by m and q, respectively, and the number of points per wavelength used is given by Nl where Nl = Sc/fDt in which Dt is the time step size and f is the frequency in Hz.
C. SPATIAL AND TIME STEP SIZE
The object to be solved is a human head, which needs to be turned into a Yee’s object composed of a set of Yee’s cell. A cube with an edge of 2.5 mm was chosen for each Yee´s cell that composed the discretized head. Therefore, the spatial step size is: mm.
In order to get the time step size, (7) must be satisfied [23]:
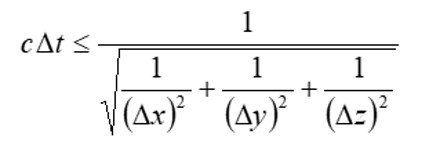 (7)
(7)Where c is the speed of light. Thus, the time step is = 4.8113 x 10⁻¹² s so that (7) is fulfilled.
The head size is not the same for all the people. Nevertheless, it was chosen a head with a size of 17.0 cm × 20.5 cm × 22.0 cm. The model of the head is composed of nine tissues, and the anatomy of the head was set up using the data from [24] and [25]. The electrical properties, as well as the physical properties of the model, were gotten from [26], [27], [28], [29], and [30]. In Fig. 2 is displayed a sagittal section of the model used in the simulation.
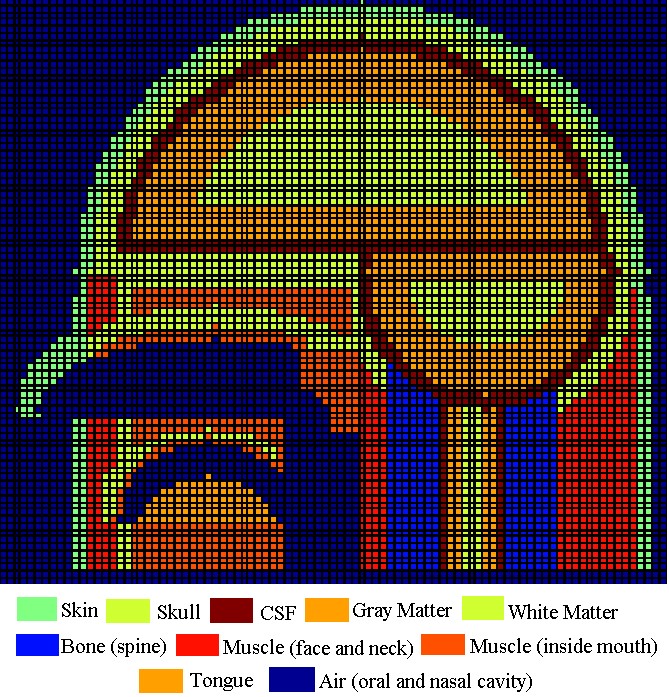
Fig. 2.
Sagital section of the model of the head used in the simulation, nine tissues and air were considered.
IV. Results
A. SPECIFIC ABSORPTION RATE
Due to the difference between the maximum and minimum values of SAR and in order to have a better visualization of SAR distribution, it was necessary to turn them into decibels. This conversion was made using (8), where the maximum value of SAR in a Yee’s cell found was used as reference so that 0 dBSAR = 2.5626´10-3 W kg-1.
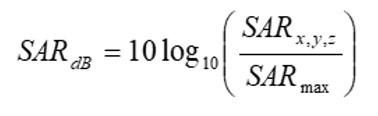 (8)
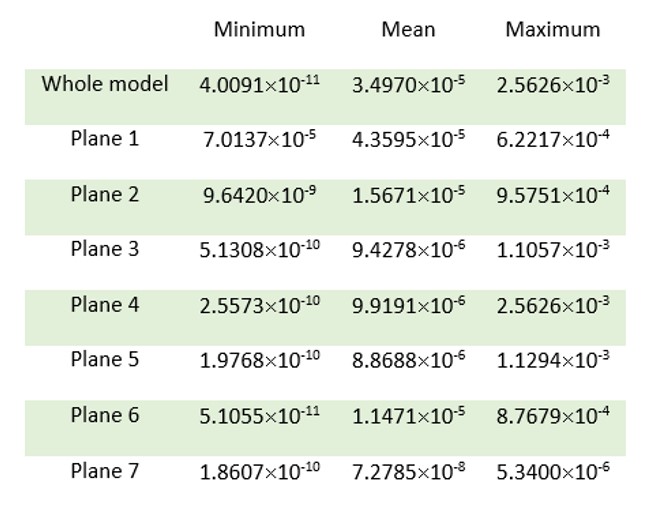
(8)Fig. 3 shows the results of SAR distribution along the head model. From Fig. 3, it is noticed that plane 1, namely the correct check, and the face have an uniform SAR distribution. These areas are where the EMFs coming from the WiFi devices impinge. However, the EMFs coming from mobile devices are attenuated as long as they propagate along the head due to the skin effect. Besides, the several layers of tissue that make up the model produce multiple reflections that causes an interference phenomenon. As a result, a. non-uniform SAR distribution in the whole model of the head is caused. Table 1 displays the maximum, mean, and minimum values of SAR found for the entire model of head and in each plane of Fig. 3.
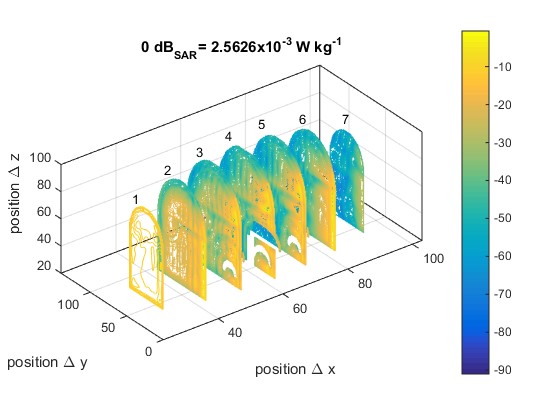
Fig 3.
SAR distribution in the model of head used due to two sources of electromagnetic field. Values in dBSAR.
The SAR is broken down by tissue in Table 2 with a view to giving the best description of SAR distribution and seeing SAR values in each tissue. In Fig. 4, these data are displayed by means of box plots. The data shown in the box plot are maximum, third quartile, median, first quartile, and minimum [31], [32]. From Table 2 and Fig. 4, it can be seen that although the maximum value of SAR is located in the skin, the cerebrospinal fluid (CSF) has a third quartile bigger than the skin and tissues, as the white matter has the largest medium value of SAR and the gray matter has the third largest median value of SAR, both of them important cerebral tissues. The authors wish to emphasize that these data cannot be obtained with uniform models such as the phantom models.
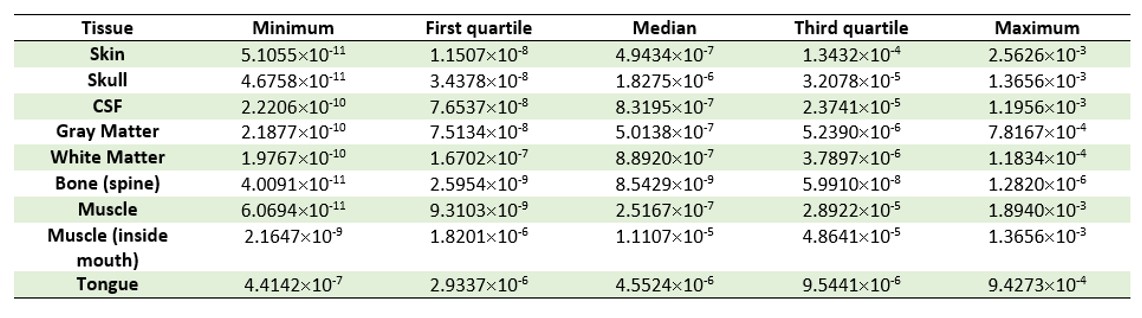

Fig. 4.
Box-plots of SAR distribution by tissue.
B. TEMPERATURE INCREASE
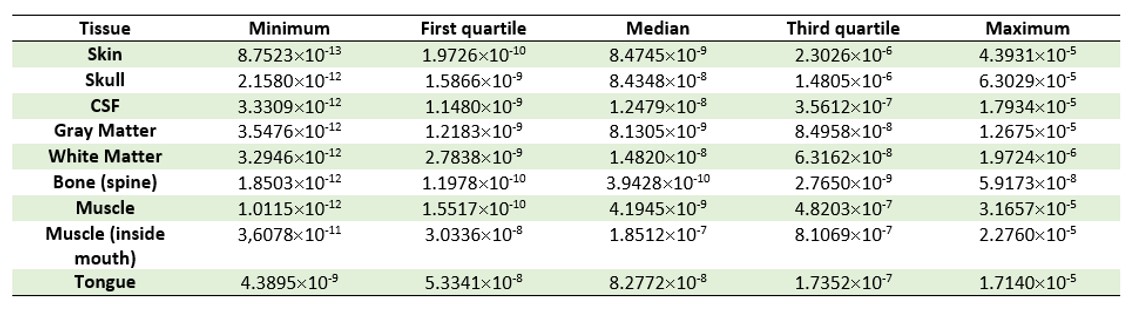
In some papers, [33], [34], and [35] (4) are used to quantify the temperature increase due to EMFs in a material similar to phantom. (4) must be used just for short periods [34], and homogenous bodies, here, are used with = 60 s.
Fig. 5 displays by means of a box-plot the temperature increase distribution for the model of head used, and in Table 3, the breaking down of temperature increase by tissues is shown. Regarding the temperature increase, the skull has the maximum value. However, it must be taken into account that, for the sake of simplicity, the heat diffusion and perfusion were negligible, but this was done to have a coarse value of the possible temperature increase in each tissue due to the two sources of the electromagnetic field.
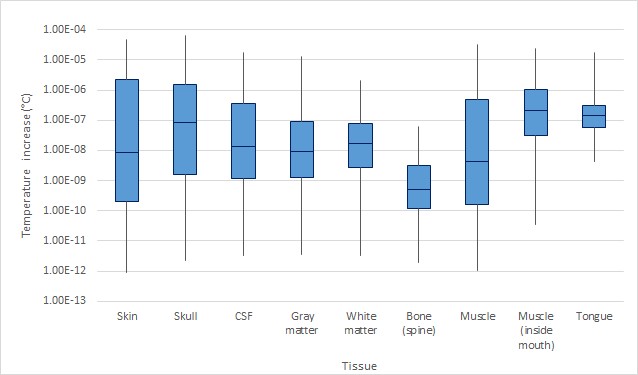
Fig. 5.
Box-plots of temperature increase by tissue.
V. Conclusions
The human body is made up of various tissues; it is not a uniform set, so we believe that making use of uniform models to obtain the SAR is not enough, either by means of simulations or phantom measurements, because the uniform models do not take into account a significant phenomenon that is of multiple reflections. When there are reflections, the phenomenon of constructive and/or destructive interference of the electromagnetic wave occurs, which can cause some tissues to be more affected by the electromagnetic field than others.
In addition, uniform models use the averaged SAR; although the averaged value works well in an uniform distribution, SAR is not constant. Due to the above, box-plots that describe better no uniform distributions were used, and what is more, a breaking down of SAR and temperature increase values by tissue was done. In this way, it can be noticed more clearly which tissues can be more affected than others.
Although the SAR and temperature increase values are far below the given in the recommendations, the long time that the mobile device is used must be taken into account. The authors are aware that the temperature analysis done was very simple and that more research is still needed for exposure times of hours since, as is well known, these devices are increasingly used to watch videos and movies. In other words, they can be used for hours, but the analysis done can give us a basic idea of which tissues may be more affected by this use.
Not only that, the authors are conscious of the use of new operating bands, such as 5 GHz, and those used by 5G technology. A person is not only subjected to one electromagnetic field source but to several ones. Therefore, an analysis much more detailed must be done in which all these sources are taken into account, so we hope that this paper can be used as as one of the bases for a much broader work to establish standards and recommendations on the use of wireless technologies as was done at the time with the cell phone used for phone calls.
Referencias
[1] International Agency Research of Cancer, Press Release no. 200: Interphone Study Reports on Mobile Phone Use and Brian Cancer Risk. World Health Organization, 2010.
[2] INTERPHONE Study Group, “Brain tumour risk in relation to mobile telephone use: results of the INTERPHONE international case-control study”, Int J Epidemiol. Vol. 39, no. 3, 2010, pp. 675-94.
[3] INTERPHONE Study Group, “Acoustic neuroma risk in relation to mobile telephone use: Results of the INTERPHONE international case–control study”, Cancer Epidemiology, vol. 35, no. 5, Oct. 2011, pp. 453-464, doi: https://doi.org/10.1016/j.canep.2011.05.012
[4] ICNIRP, “Guidelines for limiting exposure to time varying electric, magnetic and electromagnetic fields (up to 300 GHz)”, Health Phys., vol. 74, no. 4, pp. 494-522.
[5] IEEE Standard C95.1-2005. IEEE Standard for Safety Levels with Respect to Human Exposure to Radio Frequency Electromagnetic Fields 3 kHz to 300 GHz. Institute of Electrical and Electronics Engineers, 2005.
[6] FCC, In the Matter of Reassessment of Federal Communications Commission Radio Frequency Exposure Limits and Policies, Federal Communications Commission, 2003.
[7] INEGI. Encuesta nacional sobre disponibilidad y uso de tecnologías de la información en los hogares (ENDUTIH) 2021. Comunicado de prensa núm. 350/22. Jul. 4 2022. Available on: https://www.inegi.org.mx/programas/dutih/2021/
[8] Asociación de internet MX, 18° Estudio sobre los hábitos de personas usuarias de internet en México 2022, May 2022. Available on: https://www.asociaciondeinternet.mx/estudios/habitos-de-internet
[9] NCRP Report No.67, Radiofrequency Electromagnetic Fields Properties, Quantities and Units, Biophysical Interaction and Measurements, National Council on Radiation Protection and Measurements, 1981.
[10] H. Pennes, “Analysis of Tissue and Arterial Blood Temperatures in the Resting Human Forearm”, J Appl Physiol., vol. 1, no. 2, 1948, pp. 93-122.
[11] W. Wulff, “The Energy Conservation Equation for Living Tissue”, IEEE Trans Biomed Eng., vol. 21, no. 6, 1974, pp. 494-495.
[12] A. Shitzer, J. C. Chato, “Analytical Solutions to the Problem of Transient Heat Transfer in Living Tissue”, J Biomech Eng., vol. 100, no. 4, 1978, pp. 202-210.
[13] A. Hirata, M. Morita, T. Shiozawa, “Temperature Increase in the Human Head due to a Dipole Antenna at Microwave Frequencies”, IEEE Trans Electromagn Compat., vol. 45, no. 1, 2003, pp. 109-116.
[14] K. S. Yee, “Numerical Solution of initial boundary value problems involving Maxwell’s equations in isotropic media”, IEEE Trans on Antennas Propag., vol. 14, no. 3, 1966, pp. 302-307.
[15] D. M. Sullivan, Electromagnetic Simulation Using the FDTD Method, New York: IEEE Press Series, 2000.
[16] A. Elsherbeni, V. Demir, The Finite-Difference Time-Domain Method for Electromagnetics with MATLAB simulations, North Carolina: SciTech Publishing Inc., 2009
[17] J. B. Schneider, Understanding the Finite-Difference Time-Domain Method. School of Electrical Engineering and Computer Science Washington State University. [accessed 2023 July 26], 2023, http://www.eecs.wsu.edu/~schneidj/ufdtd/.
[18] R. Espinosa, I. Ezequiel, Análisis de la distribución del SAR producido por dispositivos de comunicación móvil en modelos de tejido usando el método FDTD [Analysis of the SAR distribution produced by devices of mobile communications in models of tissue using the FDTD method]. [dissertation] Mexico City: Instituto Politécnico Nacional, 2019.
[19] J. A. Roden, S. D. Gedney, “Convolution PML (CPML): an efficient FDTD implementation of the CFS-PML for arbitrary media”, Microw Opt Technol Lett., vol. 27, no. 5, 2000, pp. 334-339.
[20] ERC, Decision on harmonized frequencies technical characteristics and exemption from individual licensing of Short Range Devices used for Radio Local Area Networks (RLANs) operating in the frequency band 2400-2483.5 MHz. European Radiocommunications Committee, 2001.
[21] ERC Recommendation 70-3, Relating to the use of Short Range Devices (SRD). European Radiocommunications Committee, 2017.
[22] ITU 2014. International, regional and National regulation of SRD’s, Geneva Switzerland, June 3. International Telecommunication Union. [accessed: 2023 June 1], 2014, https://www.itu.int/en/ITU-R/study-groups/workshops/RWP1B-SRD-UWB-14/Presentations/International,%20regional%20and%20national%20regulation%20of%20SRDs.pdf
[23] R. Courant, K. Friedrichs, H. Lewy, “On the Partial Difference Equations of Mathematical Physics”, IBM J Res Dev., vol. 11, no. 2, 1967, pp. 215–234.
[24] K. Wendel, D. Stoliar, J. Malmivvo, J. Hyttinen, “Measuring Tissue Thickness of the Human Head Using Centralized and Normalized Trajectories”, In Proceedings of the Conference Consciousness and its Measures; Nov 29.-Dec 1.2009; St. Raphael hotel, Limassol, Cyprus, 2009, pp. 112-113.
[25] A. M. Gilroy, B. R. MacPherson, L. M. Roy, Atlas of Anatomy. 2nd ed., New York: Thieme, 2012.
[26] H. J. Krzywicki, S. K. Kenneth, Human Body Density and Fat of an Adult Male Population as Measured by Water Displacement. Colorado (CO). US Army Medical Research Nutrition. Laboratory (US), 1966.
[27] C. Gabriel, S. Gabriel, E. Corthout, “The dielectric properties of biological tissues: I”, Literature Survey. Phys. Med. Biol., vol. 41, no. 11, 1996, pp. 2231-2249.
[28] S. Gabriel, R. W. Lau, C. Gabriel, “The dielectric properties of biological tissues: II. Measurements in the Frequency range 10 Hz to 20 GHz”, Phys. Med. Biol., vol. 41, no. 11, 1996, pp. 2251-2269.
[29] S. Gabriel, R. W. Lau, C. Gabriel, “The dielectric properties of Biological Tissues: III. Parametric Models for the Dielectric Spectrum of Tissues”, Phys. Med. Biol., vol. 41, no. 11, 1996, pp. 2271-2293.
[30] O. P. Gandhi, Q. X. Li, G. Kang, “Temperature Rise for the Human Head for Cellular Telephones and for Peak SARs Prescribed in Safety Guidelines”, IEEE Trans Microw Theory Tech., vol. 49, no. 9, 2001, pp. 1607-1613.
[31] R. McGill, J. W. Tukey, W. A. Larsen, “Variations at Box Plots”, Am Stat., vol. 32, no. 1, 1978, pp.12-16.
[32] W. Esty, J. Banfield, “The Box-Percentile Plot”, J Stat Softw., vol. 8, no. 17, 2003, pp. 1-14.
[33] Y. Okano, K. Ito, I. Ida, M. Takahashi, “The SAR Evaluation Method by a Combination of Thermographic Experiments and Biological Tissue-Equivalent Phantoms”, IEEE Trans Microw Theory Tech., vol. 48, no. 11, 2003, pp. 2094-2103.
[34] J. C. Lin, “Specific Absorption Rates (SARs) Induced in Head Tissues by Microwave Radiation from Cell Phones”, IEEE Antennas Propag Maga., vol. 42, no. 5, 2000, pp. 138-139.
[35] N. Ticaud, S. Kohler, P. Jarrige, L. Duvallaret, G. Gaborit, R. P. O’Connor, D. Arnaud-Cormos, P. Leveque, “Specific Absorption Rate Assessment Using Simultaneous Electric Field and Temperature Measurements”, IEEE Antennas Wirel Propag Lett., vol. 11, 2012, pp. 252-255.
Información adicional
redalyc-journal-id: 614