Artículos de investigación
From Fiscal Mechanisms to Economic Inequalities: A Comparative Analysis of Countries with Different Income Levels*
De los mecanismos fiscales a las desigualdades económicas: análisis comparativo para países de diferente nivel de ingreso
 Juan José Espinal Piedrahita juan.espinalpi@amigo.edu.co
Ruby Stella Cabrera Jaramillo ruby.cabreraja@amigo.edu.co
Albeiro Aguirre Ríos albeiro.aguirreri@amigo.edu.co
Sol Beatriz Vélez Escobar sol.velezes@amigo.edu.co
Hugo A. Macias hmacias@udemedellin.edu.co
Juan José Espinal Piedrahita juan.espinalpi@amigo.edu.co
Ruby Stella Cabrera Jaramillo ruby.cabreraja@amigo.edu.co
Albeiro Aguirre Ríos albeiro.aguirreri@amigo.edu.co
Sol Beatriz Vélez Escobar sol.velezes@amigo.edu.co
Hugo A. Macias hmacias@udemedellin.edu.co
From Fiscal Mechanisms to Economic Inequalities: A Comparative Analysis of Countries with Different Income Levels*
Revista CEA, vol. 11, núm. 27, e3284, 2025
Instituto Tecnológico Metropolitano

Esta obra está bajo una Licencia Creative Commons Atribución-NoComercial-CompartirIgual 4.0 Internacional.
Recepción: 08 Octubre 2024
Aprobación: 12 Agosto 2025
Abstract:
Objective: To analyze the impact of fiscal mechanisms on reducing economic inequalities within and between countries with different income levels.
Design/Methodology: The study adopted a quantitative, descriptive–comparative approach. A Data Envelopment Analysis (dea) model based on linear programming and benchmarking algorithms was developed to measure the relationship between fiscal mechanisms and economic inequality across a set of countries with different income levels.
Results: The dea model identified the Fiscal Efficiency Possibility Frontier (fepf) for countries with varying income levels. Germany, France, the United Kingdom, and Russia have efficient fiscal mechanisms that reduce economic inequalities. The United States, Mexico, Brazil, and Colombia fall into a second group of less efficient countries. The remaining countries demonstrate even greater gaps in fiscal policy development and its limited impact on reducing inequalities.
Conclusions: The findings show that fiscal efficiency depends not on revenue collection but on the structured design of fiscal policy, as illustrated by the cases of Russia and the United States. Colombia’s fiscal mechanisms are ineffective at addressing economic inequalities, though they perform better than those of lower-middle- and low-income countries.
Originality: The study’s main contribution is constructing a fepf that measures the relationship between fiscal mechanisms and economic inequalities among countries classified by income level according to the World Bank Group (wbg).
Keywords: fiscal mechanisms, economic inequalities, income redistribution, tax system, JEL codes: H20, H21, H30, C61.
Resumen:
Objetivo: analizar el impacto de los mecanismos fiscales en la reducción de las desigualdades económicas en y entre países de diferente nivel de ingreso.
Diseño/metodología: el diseño metodológico se basó en un enfoque cuantitativo de tipo descriptivo-comparativo. Para ello se construyó un modelo de análisis envolvente de datos (dea), según el algoritmo de programación lineal y benchmarking, que permiten medir la relación de eficiencia entre una serie de mecanismos fiscales y las desigualdades económicas, para un conjunto de países de diferentes niveles de ingreso
Resultados: en el modelo dea, que evidencia la frontera de posibilidades de eficiencia fiscal para países de diferente nivel de ingreso, Alemania, Francia, Reino Unido y Rusia muestran un nivel de eficiencia en sus mecanismos fiscales que conllevan la reducción de las desigualdades económicas; mientras que países como Estados Unidos, México, Brasil y Colombia se encuentran en el segundo agrupamiento de países ineficientes. Igualmente, la brecha es mayor para los demás países en el desarrollo de políticas fiscales y su moderado efecto sobre las desigualdades.
Conclusiones: los resultados demuestran que la eficiencia no radica en el recaudo, sino en el diseño estructurado de la política fiscal, como se constata en el análisis del caso de Rusia y Estados Unidos. En el caso colombiano, se identifica que sus mecanismos fiscales son ineficientes con relación a las desigualdades económicas, pero supera a los países de ingreso medio bajo y bajo.
Originalidad: la novedad del estudio es la construcción de la frontera de posibilidades de eficiencia fiscal, que permite medir el nivel de eficiencia entre los mecanismos fiscales y las desigualdades económicas en países de diferentes niveles de ingreso de acuerdo con la clasificación del Banco Mundial.
Palabras clave: desigualdades económicas, mecanismos fiscales, redistribución del ingreso, sistema tributario, Códigos JEL: H20, H21, H30, C61.
Highlights
-
Fiscal efficiency depends on the institutional design of expense.
-
Efficient fiscal policies contribute to reducing poverty, informality, and social inequalities.
-
The Data Envelopment Analysis (dea) model is an effective tool for comparing fiscal efficiency across countries with different income levels.
-
This study redefines fiscal efficiency in terms of redistributive capacity rather than mere revenue collection.
Highlights
-
La eficiencia fiscal no depende del ingreso, sino del diseño institucional del gasto.
-
Las políticas fiscales eficientes reducen la pobreza, la informalidad y las brechas sociales.
-
El modelo dea es un instrumento útil para comparar la eficiencia fiscal en países con distinto nivel de ingreso.
-
Este estudio redefine la eficiencia fiscal como capacidad redistributiva, no solo recaudatoria.
1. INTRODUCTION
Progress towards economic recovery continues globally after periods of negative Gross Domestic Product (GDP) indicators (Gunay et al., 2021; Zhang, et al., 2022). The COVID-19 pandemic reinforce existing economic inequality (Alfani et al., 2024) and revealed the unsustainability of pro-cyclical fiscal policies for economic and social development, particularly those influencing poverty and income redistribution. According to Onrubia and Rodado (2014), in the absence of well-defined redistributive mechanisms, economic functioning tends to increase disparities over time.
Reducing inequalities is a key component of the Sustainable Development Goals (SDGS) (Wang et al., 2025), especially since the pandemic has exacerbated existing disparities and affected vulnerable populations. The decline in formal employment has led to income loss and increased household vulnerability (Angelov & Waldenström, 2023). Therefore, studies examining the relationship between fiscal mechanisms and economic inequalities are needed to inform decision-making and strengthen the efficiency of resource distribution toward greater social balance.
However, income redistribution through fiscal policy is not always the most effective means of stimulating economic dynamism. It reduces the incentive to work because of transfer benefits and lowers investment incentives due to higher taxes (Barrientos Marín et al., 2014; Ferreira et al., 2007; Gallo, 2006; Klasen, 2004; Macías Vázquez, 2014; Montalvo & Ravallion, 2009; Persson & Tabellini, 1994; Ravallion, 2004; Warr, 2002). These studies conclude that sectoral growth contributes more significantly to poverty reduction.
High levels of inequality require stronger fiscal mechanisms and greater tax efforts, which can increase the overall tax burden, and are often perceived as unfair depending on the justification. As Gonareva et al. (2021, p. 33) and Lansing and Markiewicz (2013) note, “The world knows quite a number of economic mechanisms of solution of the problem of income inequality: from the progressive taxation to social payments, reduced payments and subsidies.”
Furthermore, when inequalities result from inefficient public administration, unstable fiscal policy, or corruption, it is understandable why capital and investors would relocate to more equitable scenarios (Camacho Pérez, 2020). Corruption affects society, the economy, and government performance, eroding credibility and trust in institutions (Cingano, 2014; Galindo y Ríos, 2015; Keefer & Knack, 2002).
In developing economies, fiscal redistribution is often weaker due to lower and less progressive spending and taxation (Gaspar & García-Escribano, 2017). Fiscal redistribution also defines how taxes are managed (Dyrda & Pedroni, 2023)—including which entities collect, allocate, and distribute resources; the sanctions for noncompliance; and the general regulation of taxation-related activities and institutions.
Many countries’ tax systems tend toward regressivity due to their heavy reliance on indirect taxes and imbalances in economic agents’ contributions. The relationship between economic growth and income distribution has been widely studied across theoretical traditions. Until the 1970s, Simon Kuznets’ theory dominated. This theory posited that economic growth driven by the modernization of the productive apparatus would eventually reduce inequality in income distribution (Aguilera Verduzco, 1998; Sánchez Almanza, 2006, p. 13).
Piketty (2013) argues that income inequality can only be analyzed through tax data since indicators of economic growth and development hide “immense inequalities.” Conversely, regressive fiscal mechanisms exacerbate inequalities (Krugman, 2020). As Stiglitz (2012) contends, the state is responsible for poorly designed fiscal policies.
Public spending, transfers, and taxation also influence aggregate demand and production. Since few goods qualify as “genuine” public goods, Adam Smith (1994) argued that the optimal size of the state should be limited to the cost of its essential functions: defense, security, justice, and infrastructure—what is known as the minimal state.
According to Karakotsios et al. (2020) and Prasad (2008), fiscal mechanisms are policy instruments that can reduce income inequality, increase public revenues, encourage investment, and correct market failures. Barro (2000) and Banerjee and Duflo (2000), however, suggest a quadratic relationship between inequality and growth. At high levels of inequality, reducing disparity promotes growth by providing political stability and reducing socio-political tensions that cause uncertainty and deter investment and growth (Bengoa Calvo & Sánchez-Robles Rute, 2001). This study therefore aims to analyze the impact of fiscal mechanisms on reducing economic inequalities within and between countries of different income levels.
Methodologically, it is important to distinguish between quantitative analysis and literature review. This study uses bibliometric and scientific mapping techniques only to identify input variables associated with key fiscal mechanisms in the literature and to define the output variables of the Data Envelopment Analysis (DEA) model representing economic inequalities (see Table 1).
The paper is structured as follows. Section 1 presents the literature review and defines the study variables. Section 2 details the DEA model used to measure the efficiency of fiscal mechanisms in reducing economic inequalities. Section 3 outlines the results, including the construction of the Fiscal Efficiency Possibilit Frontier (FEPF). Section 4 offers the study’s conclusions.
2. THEORETICAL FRAMEWORK
Impact of Fiscal Mechanisms on Economic Inequality
Studies by Beramendi and Rogers (2020), Salvador Casara et al. (2023), Tang and Wang (2021), and Verde Selva et al. (2020) have examined various aspects of economic inequality. These aspects include the effects of tax incentives, income tax progressivity, fiscal decentralization, and the perception of inequality. These studies highlight the importance of well-designed fiscal policies and effective revenue governance in mitigating inequality. Similarly, Banzhaf et al. (2021), Berzosa (2002), Cutler et al. (2018), Festa (2018), and Koger and Rodríguez (2021) analyze the impact of various fiscal measures on economic growth and income distribution. These studies emphasize the roles of family transfers, pensions, unemployment benefits, and redistributive policies.
Despite this extensive body of research, however, none of these studies has empirically demonstrated the fepf for countries with different income levels using a scientific approach. This study fills that gap by offering an innovative perspective that prioritizes the structured design of fiscal policy over a narrow focus on tax collection. This approach has the potential to transform the way governments and institutions address economic inequality and fiscal efficiency by providing a robust, adaptable framework that can be applied to diverse national contexts to maximize social well-being and promote sustainable economic growth.
As a universal ontological principle, equality ensures that all individuals can live with dignity. Consequently, high levels of inequality challenge the legitimacy of those who govern as guarantors of universal and fundamental rights. “Inequalities limit economic growth, marginalize individuals, and erode trust in institutions” (CEPAL, 2019). The following section defines the key variables used to analyze the correlations between fiscal mechanisms and economic inequalities.
Fiscal Mechanisms That Influence Inequality Indicators
Informality and Wages
Similarly, regressive tax systems transfer the burden of economic sacrifice to the weaker segments of society through low wages, as noted by Bird and Zolt (2005) and Tahlova and Banociova (2020). Consistent with the views of Galindo and Ríos (2015) and Koske et al. (2012), labor income in underdeveloped countries is insufficient for wealth accumulation through investments or fixed assets. The resulting increase in the prices of goods and services distorts the intended redistributive nature of taxation, leaving inequality levels unchanged before and after taxes are paid. Therefore, misguided economic policies can simultaneously exacerbate inequality and hinder economic growth (Stiglitz, 2012).
For one segment of the population, informality reflects exclusion from income redistribution, forcing individuals to seek livelihoods informally. For others, high tax burdens imposed as a means of achieving greater redistribution induce tax evasion and avoidance, thereby deepening inequalities. A political system that favors the wealthy over the poor further aggravates income disparities and promotes informality (Esaku, 2021).
When inequalities stems from reduced or neglected income distribution, the informal economy emerges as an efficient and effective, short-term alternative to address employment shortages. The informal economy compensates for what the formal economy fails to provide: greater income inequality promotes the expansion of informality, while the growth of the informal sector reinforces income inequality (Berdiev & Saunoris, 2019). In his seminal work, Capital in the Twenty-First Century, Thomas Piketty (2013) asserts that unemployment is one of the primary sources of inequality.
Gross Domestic Product (GDP)
In principle, the relationship between economic growth and inequality is inverse; higher growth tends to create greater wealth (Motahar & Mamipour, 2025). However, according to Alamanda (2021), this outcome is only possible through redistributive policies. Their findings show that an increase in GDP pushes the Gini index up, thereby widening income inequality. Conversely, Marrero and Servén (2022) argue that economic growth reduces poverty. Considering income levels, Villanthenkodath et al. (2024) conclude that growth diminishes inequality in high-income countries but exacerbates it in middle- and low-income economies.
Taxes
Recent studies reveal that economic systems finance the state only to the extent that they receive direct benefits proportional to their economic sacrifice or direct social investment towards their own interests, which reinforces power structures and deepens inequalities. According to Wortel-London (2021), capital owners become more reluctant to contribute when taxes finance social goods aimed at the working class because the perceived personal benefit diminishes. From an ethical or social justice perspective, equality of opportunity aligns with the concept of “capabilities” proposed by Sen (2016).
From a strictly economic perspective, equality of opportunity can be understood on three levels: (a) equal access to education, (b) equal access to credit, and (c) equal treatment of all citizens by public administration, with impartial enforcement of regulations (Novales Cinca, 2011, p. 10). However, as Sen and Drèze (1995) emphasize, operationalizing the concept of “equity” remains complex, even when income, rather than consumption or wealth, is used as the primary measure.
Income Redistribution
Economic inequalities are intensified by the redistribution of income. Salazar Méndez and Waltember (2018) identify Latin America as the most unequal region in the world in terms of income distribution and redistribution. They emphasize that income redistribution is the most effective mechanism to curb disparities. Mirrlees (1971) highlights progressive tax systems as essential policy tools for achieving equality. Similarly, positive theory (Karabarbounis, 2011; Meltzer & Richard, 1981) posits that greater income inequality leads to higher redistribution rates.
Paradoxically, Sidgwick (2012) argues that redistribution and tax progressivity may reduce effort among the most productive workers, since wealthier individuals pay higher taxes. Karabarbounis (2011) further notes that elite groups seek to reduce taxes through direct transfers.
McDonald and Larson (2020) assert that the right to live with dignity should not depend on tax collection, particularly in societies with a weak tax culture and widespread tax evasion, avoidance, and shifting—all of which reinforce inequalities. Moreover, as Citi and Justesen (2021) argue that weak fiscal mechanisms can have adverse effects, turning public budgets into instruments that perpetuate inequalities rather than reduce them.
Transfers
Caminada et al. (2019, 2021) identified several ways to combat poverty, emphasizing transfers as the most essential instrument for redistributing income to the poorest households. These transfers “work as automatic stabilizers and will increase in times of economic downturn” (Caminada et al., 2019, p. 2). In turn, Panigrahi (2019) states that “The politics involved with subsides have immense emotional appeal than fulfilling the objective of social and economic justice.”
Arauco et al. (2013) and Bucheli et al. (2013) found that direct cash transfers and in-kind transfers—particularly those related to education, health, social assistance, and contributory pensions—are reflected in social spending. They conclude that combining both forms of transfer can bring the Gini index closer to zero.
Budget design plays a key role in this process. “[…] the state plays an important role in redistributing income by way of taxes and social transfers” (Jesuit & Mahler, 2017, p. 7). For example, subsidizing inadequate wages with housing, social, and other local services can improve equality and quality of life (Alkadry et al., 2019).
According to Gomo (2019) and Lehmann (2010), social transfers are particularly effective in reducing poverty but have a limited impact on inequality. Enami et al. (2019) argue that transfers effectively reduce inequality while taxes efficiently raise revenue without increasing poverty. However, they note that a progressive tax or transfer could increase inequality, whereas a regressive one could reduce it. Higgins and Lusting (2016) demonstrate this dynamic by showing that chronic poverty deepens when the poor pay more in taxes than they receive in transfers.
Economic Inequalities
Welfare
The selected proxy variable measures household well-being in relation to domestic violence and seeks to determine if income levels are associated with the prevalence of violence within the home. While research by Kebede et al. (2022) and Liu and Olamijuwon (2024) affirms that greater income inequality leads to higher levels of domestic violence, Stöckl et al. (2021) found that improving household economic conditions reduces violence.
Violence
The proxy variable used to measure violence is Homicide. It is so closely related to economic inequality that several studies use it as a predictor. Ouimet (2012) and, more recently, Schargrodsky and Freira (2021) conclude that inequality is the only significant and robust predictor of homicide in Latin America and the Caribbean.
Inequality
Economic inequalities persist largely due to the mismanagement of fiscal mechanisms. In many countries, high tax burdens fail to promote equality, instead reinforcing privilege. The true purpose of taxation—redistributing wealth and combating exclusion—is often obscured when political and business elites capture revenues and use them to consolidate their power and wealth, leaving little for the majority.
Jong-Song and Khagram (2005) warn that vulnerable populations often fall victim to bureaucratic coercion, which distorts the allocation of goods and services and creates new forms of exclusion. Similarly, Acemoglu et al. (2013) argue that political elites exploit corruption to capture state power and redirect social spending for personal benefit, thereby reinforcing inequality and perpetuating the concentration of power.
Beyond institutional analysis, some scholars offer a structural critique of the global economic model. Nadal (2020), cited by Rojas Merchand (2020), contends that inequality is not a byproduct but an inherent feature of capitalism, whose logic is based on capital concentration and the systematic exploitation of labor. This view aligns with that of Stiglitz (2012), who observes that the top 1 % of the global population owns what the remaining 99 % needs, severely undermining democracy and the rule of law.
In the same vein, Krugman (2011) argues that immense wealth shapes political systems, and Insulza (2011) warns that unfair wealth distribution causes structural harm to the democratic fabric. Casas Zamora et al. (2011) further emphasize that excessive wealth concentration widens social divides, erodes institutional legitimacy, and perpetuates privilege.
Despite the severity of the shared diagnosis, several authors have proposed ways to reverse these dynamics. For example, Keneck-Massil et al. (2021) advocate for a progressive fiscal architecture supported by institutional reforms that increase transparency and accountability. These reforms aim to strengthen income redistribution and reduce structural inequality.
Similarly, Acemoglu et al. (2013) acknowledge that the corruption effects on inequality vary according to a country’s level of development, enabling differentiated policy interventions. Thus, while there is broad consensus on the systemic nature of inequality and the distorting role of corruption, there is also room for emerging approaches that advocate for transformative and socially just taxation.
Poverty
Poverty—understood as the structural deprivation of the material resources and capabilities necessary to meet basic needs and exercise fundamental rights—remains a persistent, multifaceted phenomenon. One of its most incisive structural causes is the concentration of capital among elites, as it systematically distorts state functions and undermines distributive equity. Zang et al. (2023) argue that wealth concentration exacerbates poverty by weakening education systems, reducing the quality of public services, and intensifying income concentration in privileged sectors.
According to Rojas Merchand (2020), the concentration of economic and political power is a central mechanism of contemporary capitalism that is structurally linked to labor exploitation and the unequal accumulation of capital. Jong-Song and Khagram (2005) observe that, in contexts of pronounced inequality, elites design and maintain institutional frameworks that preserve their interests, producing chronic conditions of vulnerability and exclusion. Stiglitz (2012) build on this critique, warning that when the wealthiest 1% capture resources, democratic governance erodes and economic power dictates the rules of legal and institutional systems.
The instrumentalization of institutions in favor of dominant groups is well documented. Krugman (2011) denounces the influence of large fortunes on political systems, and Insulza (2011) emphasizes that the unjust distribution of wealth undermines the foundations of democracy. Similarly, Casas Zamora et al. (2011) argue that wealth concentration intensifies structural inequalities and restricts access to public goods. Acemoglu et al. (2013) further contend that monopolization of power systematically affects the rights of vulnerable populations.
Consequently, poverty should be understood not merely as an income deficit but also as the outcome of institutional designs that reproduce exclusion, perpetuate inequality, and legitimize the capture of the state by private interests.
Education and Literacy
Colclough (2012) and Rose et al. (2021) argue that education is causally related to social inequalities, driven by disparities in wealth, power, and status. Power (2021) highlights the paradox of education as both a cause of and a potential solution to inequality. Evans and Harshorn (2021), on the contrary, describe education as the most valuable redistributive mechanism. Similarly, Bernasconi and Profeta (2012) emphasize that public education and redistributive transfers should be the main pillars of social spending and investment.
Tang and Wang (2021) note that corruption-induced underinvestment in educational coverage and quality exacerbates inequality by limiting access to higher income levels and direct redistribution. This hinders stability, growth, and economic development (Adams & Klobodu, 2016). Similarly, corruption distorts tax systems in favor of the wealthy, making them regressive and inequitable (Sáenz-Castro & García-González, 2019).
Education emerges as one of the most effective fiscal mechanisms for reducing economic inequalities and promoting development. Gandhari (2021) argues that education breaks the vicious cycle of poverty and serves as a key pathway to equality. Without access to robust, high quality education systems, individuals face severe barriers to specialized, formal labor markets. As Reinders et al. (2021) observe, “Higher education is regarded as a key instrument to enhance socioeconomic mobility and reduce inequalities.”
From a critical perspective, literacy can also be perceived as a threat to the status quo in contexts dominated by hegemonic capitalist structures. When education fulfils its emancipatory function—liberating, questioning, transforming, resisting, and creating—it ceases to serve the interests of the dominant system and becomes an uncomfortable policy for those who benefit from exclusion. Gaining linguistic competence, understanding social realities, and becoming aware of individual’s rights challenge the very foundations that sustain poverty, inequality, and institutionalized subordination.
3. METHODOLOGY
Comparative Analysis for Countries with Different Income Levels
The analysis of fiscal efficiency in relation to economic inequalities across countries begins with a review of 150 articles retrieved from the Scopus database—each article addressing similar research objectives to this study. The most common methods used to examine the relationship between fiscal instruments and economic inequalities were descriptive statistics (35 studies), qualitative analysis (33 studies), ordinary least squares (27 studies), panel data (10 studies), generalized method of moments (10 studies), bibliometric analysis (6 studies), and multivariate regression (4 studies), among others.
This methodological overview underscores the novelty of this study, as it is the first to use an optimization approach to construct the FEPF. This approach strengthens the analytical and practical contributions to the field of fiscal efficiency.
The study adopts a quantitative, descriptive–comparative approach. A DEA model is developed using a linear programming and benchmarking[*] algorithms to measure the relationship between the efficiency of various fiscal mechanisms and economic inequalities across countries with different income levels.
Variable selection was informed by an extensive literature review conducted in specialized databases, such as Scopus. The review identified studies whose titles, abstracts, or keywords explicitly examined the impact of fiscal mechanisms on reducing economic inequalities between countries. This variable selection also aligns with the monitoring of SDG 10, Reduced Inequalities, as the study aims to assess how fiscal policy decisions in the selected countries contribute to improving egalitarian conditions and opportunities (Jiménez, 2015).
The literature review yielded 240 relevant articles, including 75 that address fiscal mechanisms, 61 that focus on economic inequality, and 104 that encompass both dimensions. These studies span the period from 2010 to 2021. The following section defines the fiscal mechanisms and economic inequality variables analyzed to achieve the objectives of this study (see Figure 1).
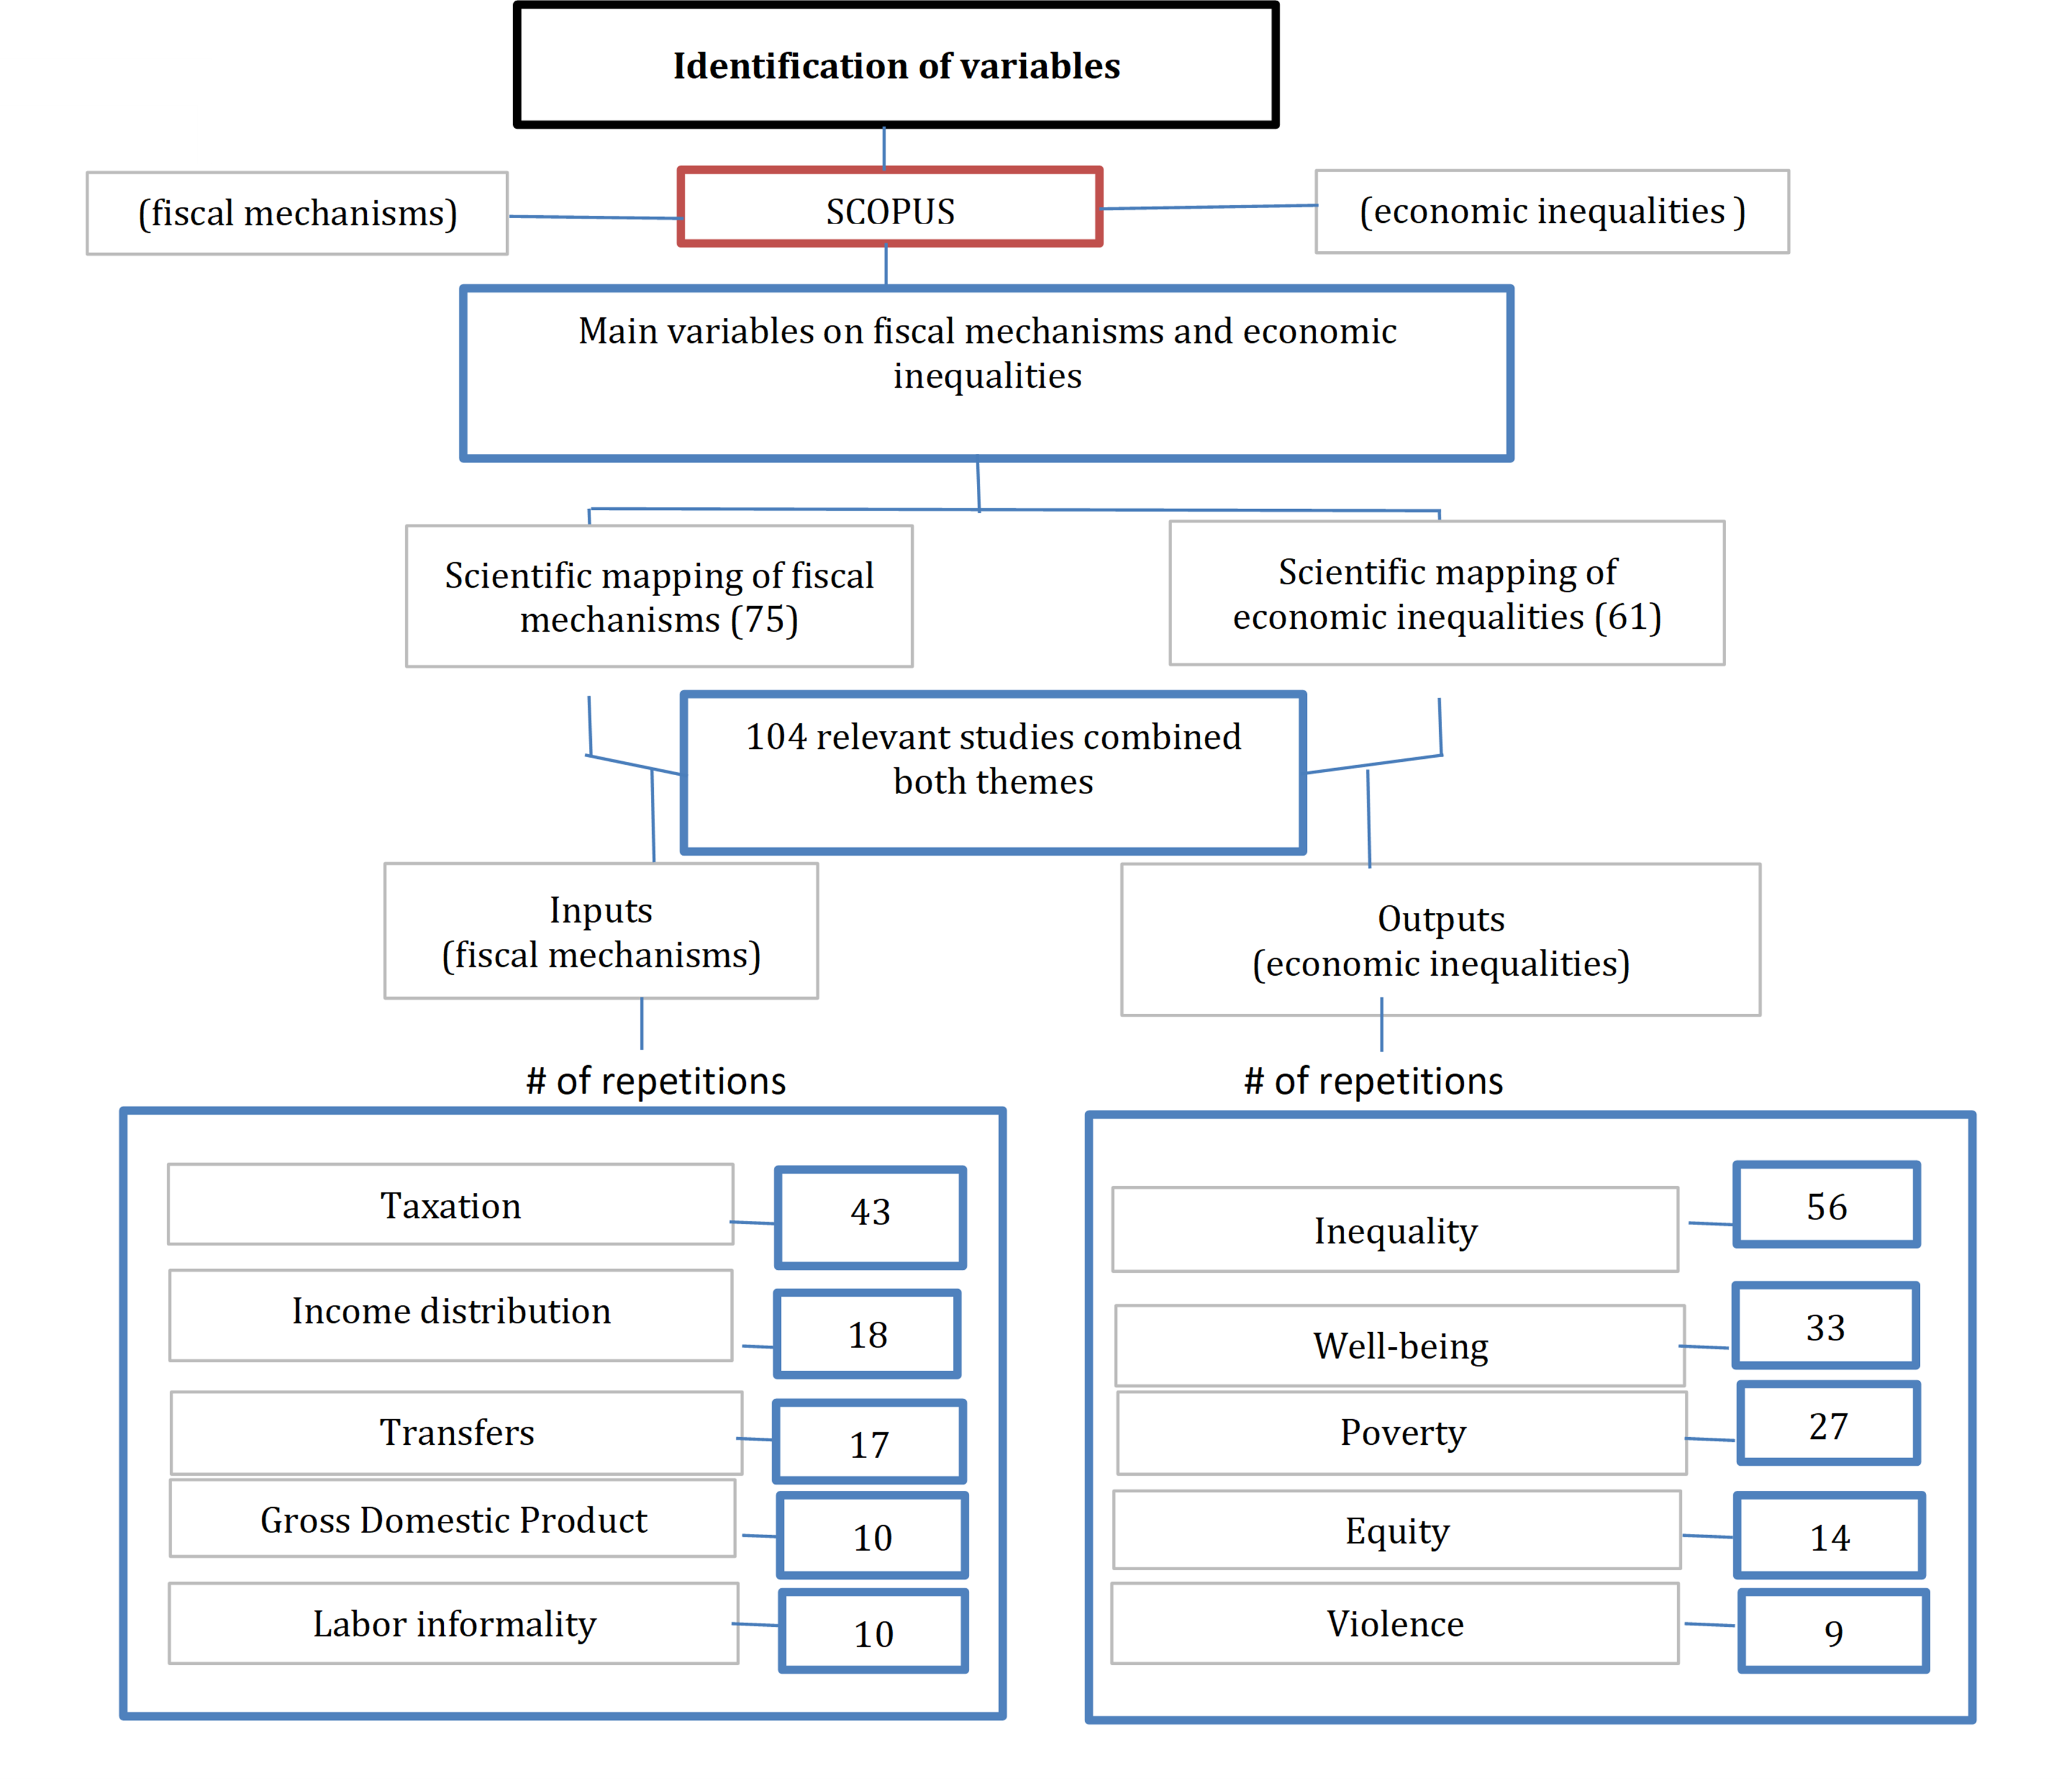
Figure 1
Identification of variables for the study
Figura 1. Identificación de variables para el estudio
Source: Authors’ own work.According to Hosseinzadeh et al. (2020), proxy variables were defined for the DEA model to specify fiscal mechanism inputs and economic inequality outputs (see Table 1).
| Fiscal mechanisms (Inputs) | |||||
| Variable | Proxy variable | Name | Type | Definition | Institution |
| Informality | Informal employment | Informal | Quantitative | All paid jobs that are not registered, regulated, or protected under legal or regulatory frameworks, as well as unpaid work carried out in income-generating enterprises. | ILO |
| Gross Domestic Product | Economic growth | GDP | Quantitative | Annual percentage growth rate of gdp at market prices in local currency at constant 2019 prices. | WBG |
| Taxation | Collection, excluding grants (% of GDP) | Recaud | Quantitative | Income from taxes, social contributions and other revenues, such as fines, fees, rents, and income from property or sales. | WBG |
| Income distribution | Social Contributions (% of revenues) | Contribuc | Quantitative | Social contributions include payments by employees, employers, and the self-employed to social security systems, along with other related contributions. | WBG |
| Transfers | Subsidies and other transfers (% of expense) | Transf | Quantitative | All unrequited transfers, subsidies, and grants to public enterprises, private entities, foreign governments, international organizations, and other government units. | WBG |
| Economic inequalities (outputs) | |||||
| Variable | Proxy variable | Name | Type | Definition | Institution |
| Welfare | Domestic violence: Prevalence of intimate partner violence (per 10,000 inhabitants) | VioFam | Quantitative | Proportion of women aged 15–49 who have experienced physical or sexual violence at the hands of their current intimate partner. | WBG |
| Violence | Homicide rate | Homic | Quantitative | Annual prevalence rate of homicides. | WHO |
| Inequality | Gini Coefficient | Gini | Quantitative | Income inequality within countries. | WBG |
| Poverty | Poverty incidence | Pobrez | Quantitative | Poverty line at $1.90 a day (in 2019 Purchasing Power Parity (ppp)) expressed as a percentage. | WBG |
| Equity | Literacy rate, total adults (% of population ages 15 and above) | Alfabet | Quantitative | Percentage of population ages 15 and above who can read and write with understanding. | WBG |
Tabla 1. Inputs y outputs para la medición del dea
Source: Authors’ own work based on definitions from the International Labour Organization (ilo), the World Bank Group (wbg), and the World Health Organization (who).The WBG’S country and lending classification was used to determine income levels. 16 countries were selected for analysis: four high-income (Germany, the United Kingdom, the United States, and Spain); four upper-middle-income (Colombia, Mexico, Brazil, and Russia); four lower-middle-income (India, Nicaragua, El Salvador, and Nigeria); and four low-income (Afghanistan, Haiti, Madagascar, and Uganda). The selection criteria were based on data availability, including only countries with complete information for all variables. This resulted in 176 cross-sectional data points across 16 countries and 11 observations.
For the comparative analysis, an efficiency assessment was conducted using a DEA. The fiscal mechanisms—Informal, GDP, Recaud, Contribuc, and Transf—represent the inputs, and the economic inequality indicators—VioFam, Homic, Gini, Pobrez, and Alfabet—constitute the outputs. The model was built using RStudio 4.0. Two annexes are provided at the end of the article: the RStudio code (Annex 1) and the complete database (Annex 2).
The DEA approach calculates a set of weights for each country that maximizes efficiency. This ensures that, when applied to other fiscal mechanisms, the resulting efficiency never exceeds 1. In other words, the model identifies the optimal combination of fiscal mechanisms for each country, maximizing its efficiency relative to the others, with an upper limit of 1. Countries located on the FEPF use a broad mix of fiscal instruments to reduce economic inequalities according to their income level.
This nonparametric method does not require assumptions about functional form or error distribution (Bogetoft & Otto, 2011). Instead, it measures efficiency relative to an “extreme” frontier constructed from the observed economic inequalities under the condition that all decision-making units lie on or beneath this frontier (Coelli et al., 2005; see Figure 2 and Table 1).
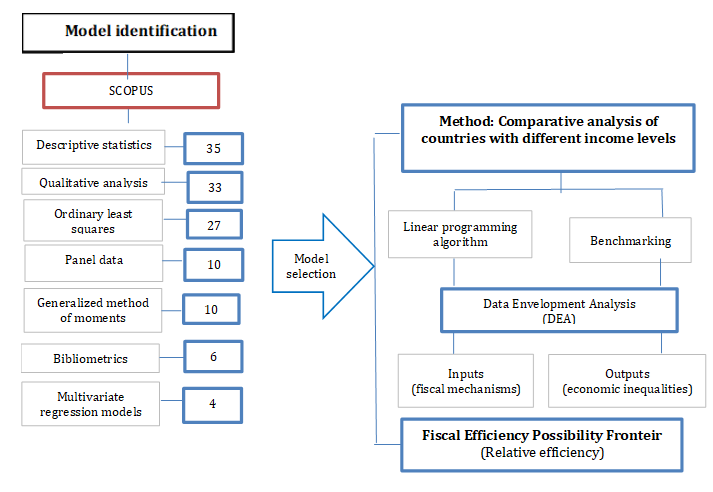
Figure 2
Identification and selection of the dea method
Figura 2. Identificación y selección del método dea
Source: Authors’ own work.Formally, DEA applies mathematical programming techniques to estimate the relationships between multiple inputs and outputs for a set of Decision Making Units (DMUS), which, in this study, correspond to countries. A set of (n) countries is evaluated based on fiscal mechanisms (inputs) that influence (m) economic inequalities (outputs). Specifically, each fiscal mechanism j (where j = 1, 2, ..., n) is represented by the pair (Xj,Yj), where Xj = (x1j, x2j, ..., xmj) are the inputs and Yj = (y1j, y2j, ..., ysj) are the outputs. Both inputs and outputs are assumed to be strictly positive.
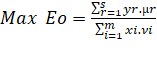
Given these sets of inputs and outputs, an aggregate term is established to represent overall economic inequalities, generalizing the input–output relationship globally as follows in Equation 1:
 (1)
(1)In Equation 1, µr and νi denote the weights assigned by the DEA and can be interpreted as the value of the outputs produced and the costs of providing the inputs, respectively. The only restriction on these weights is that they must be nonnegative, which offers flexibility in maximizing the ratio of total output to total input for each country. Thus, the dea model is estimated as follows in Equation 2:
 (2)
(2)Subjet to Equation 3:
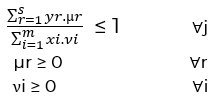 (3)
(3)According to these constraints, the ratio of total output to total input must not exceed one for any of the observed units. The program’s objective is to determine the weights µr and νi that maximize the ratio of the unit under evaluation. Consequently, the relative efficiency of each country’s fiscal mechanism lies within the interval 0 < Eo ≤ 1.
4. RESULTS
Table 2 shows the relative and global efficiency indices for each DMU in 2020. A DMU is considered efficient if its efficiency index equals 1; otherwise, it is classified as inefficient.
According to the DEA model, the countries that demonstrated the highest performance in implementing fiscal policies—based on the defined mechanisms and their impact on reducing economic inequalities—were the United Kingdom, Germany, and Spain. This finding underscores the critical role of fiscal mechanisms in mitigating inequality, which is bolstered by robust political and institutional stability. In fact, higher inequality increases the likelihood of governmental crises. However, the adverse distributional effects of ineffective fiscal mechanisms can be mitigated by expansionary or well-designed fiscal stimulus programs, which substantially impact the reduction of economic inequality (Agnello et al., 2017).
| DMUS Relative efficiency for economic inequalities (outputs) | Overall average efficiency for the DEA model | ||||||||
| Countries | Income level | VioFam | Homic | Gini | Pobrez | Alfabet | Average efficiency | Ranking | |
| United Kingdom | UK | High | 1.0000000 | 1.0000000 | 0.9979113 | 1.0000000 | 1.0000000 | 0.9995816 | 1 |
| Germany | GER | High | 0.9885908 | 0.9930352 | 1.0000000 | 1.0000000 | 1.0000000 | 0.9963028 | 2 |
| Spain | ESP | High | 1.0000000 | 1.0000000 | 0.9980511 | 0.9741807 | 1.0000000 | 0.9943409 | 3 |
| Russia | RUS | Upper-Middle | 0.9911026 | 0.9780586 | 0.9774025 | 0.9931301 | 0.9885716 | 0.9856084 | 4 |
| Mexico | MEX | Upper-Middle | 0.9056217 | 0.9048373 | 0.9039419 | 0.9263078 | 0.9263078 | 0.9132820 | 5 |
| Brazil | BRA | Upper-Middle | 0.9257973 | 0.9175117 | 0.9131749 | 0.9056494 | 0.9026280 | 0.9128767 | 6 |
| United States | USA | High | 0.9795437 | 0.6772832 | 1.0000000 | 0.9777835 | 0.9795438 | 0.9023682 | 7 |
| Colombia | COL | Upper-Middle | 0.8702704 | 0.8672526 | 0.8501367 | 0.8530711 | 0.8479729 | 0.8576426 | 8 |
| Nigeria | NIG | Medium Low | 0.8785955 | 0.8848497 | 0.8330225 | 0.8275916 | 0.8159916 | 0.8470855 | 9 |
| Nicaragua | NIC | Lower-Middle | 0.7840215 | 0.7855010 | 0.8855010 | 0.7864248 | 0.7915517 | 0.8047939 | 10 |
| El Salvador | ESL | Lower-Middle | 0.7919610 | 0.7995698 | 0.7641686 | 0.7928083 | 0.7934145 | 0.7881852 | 11 |
| India | IND | Lower-Middle | 0.7813969 | 0.7718032 | 0.7608130 | 0.7588866 | 0.7487077 | 0.7641562 | 12 |
| Afghanistan | AFG | Low | 0.6903455 | 0.7822378 | 0.6770509 | 0.6960197 | 0.6815050 | 0.7034319 | 13 |
| Madagascar | MAD | Low | 0.7423719 | 0.7398766 | 0.7323398 | 0.6366300 | 0.6445294 | 0.6957599 | 14 |
| Uganda | UGA | Low | 0.7319866 | 0.7237101 | 0.6993947 | 0.6001557 | 0.6548251 | 0.6783265 | 15 |
| Haiti | HAI | Low | 0.6825869 | 0.6775529 | 0.5895826 | 0.5744215 | 0.6777496 | 0.6366683 | 16 |
Tabla 2. Eficiencia DEA resultados por output para países de diferentes niveles de ingreso, 2020
Source: Authors’ own work.The three least efficient countries are Madagascar, Uganda, and Haiti. These results suggest that lower institutional capacity is associated with higher economic inequality. This highlights the significant influence of the tax system on inequality and its remains a central concern for policymakers (Stephenson & Perea, 2018). In this regard, the closer a country’s efficiency score is to 1, the stronger its institutional governance and principal–agent alignment. Over time, these factors contribute to reducing internal economic disparities.
Similarly, Russia demonstrates strong performance with respect to the inputs and outputs defined in the study. Unlike top-performing high-income countries, Russia is classified as an upper-middle-income country yet outperforms the United States, a high-income economy. This suggests that relative and overall efficiency are not determined by income level but rather by institutional capacity reflected in improvements to social welfare, economic equality, and income redistribution. Consequently, while economic crises may increase inequality, they do not necessarily correlate with changes in national productivity (Ryvkin & Semykina, 2017).
Figure 3 illustrates the relationship between fiscal mechanisms and economic inequalities across countries. The figure displays the FEPF for 2020 (red line) and the data points near it correspond to the countries’ performance between 2010 and 2020. The graph visualizes the results summarized in Table 2, using output-oriented models that aim to maximize output levels while keeping input levels constant (Hosseinzadeh et al., 2020).
In this sense, countries located on the FEPF—namely the United Kingdom, Germany, Spain, and Russia—demonstrate optimal performance, which reveals a positive relationship between fiscal mechanisms (inputs) and economic outcomes (outputs). The more effective the fiscal mechanisms, the greater the reduction in inequalities. In contrast, Colombia, which is positioned below the frontier, is considered inefficient, though it belongs to a cluster of nations moving towards efficiency. This is not the case for Afghanistan, Madagascar, Uganda, and Haiti, which remain far from the efficiency frontier.
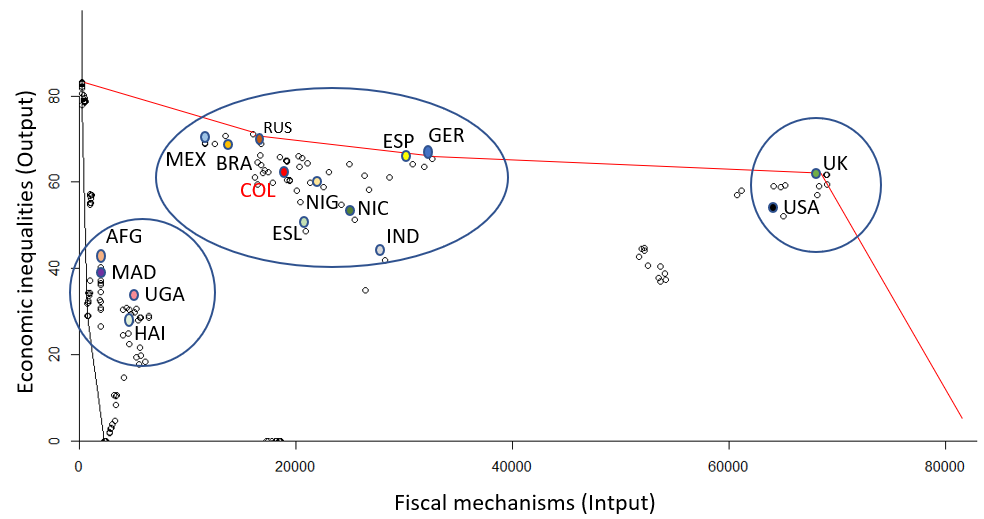
Figure 3
Fiscal efficiency possibility frontier in countries with different income levels, 2020
Figura 3. Frontera de posibilidades de eficiencia fiscal para países de diferente nivel de ingreso, 2020
Source: Authors’ own elaboration.Figure 3 shows how efficiency is estimated based on the calculation of the DMUS and the FEPF (red line). The analysis evaluates fiscal mechanisms (inputs) in relation to economic inequalities (outputs) under the assumption of variable returns to scale. This approach acknowledges that some countries—particularly high-income economies—operate with increasing returns to scale, while others exhibit constant or decreasing returns, as observed in the remaining nations. Each point in the figure represents the level of fiscal mechanisms applied and the corresponding degree of economic inequality observed in a given country.
The figure also illustrates the relationship between resources (fiscal mechanisms) and results (reductions in economic inequalities). A process is considered efficient when it achieves the maximum possible result with the available resources or reaches a desired outcome with the fewest resources. Accordingly, the figure shows that greater fiscal investment does not necessarily translate into higher efficiency in reducing inequalities—as seen in the United States. In contrast, countries such as Russia, Spain, and Germany achieve more efficient outcomes in lowering economic disparities with relatively lower transfers.
Figure 4 ranks countries by income level and shows that the top three performers efficiently balance fiscal mechanisms and economic inequalities, reaching efficiency values close to 1: the United Kingdom (0.9995), Germany (0.9963), and Spain (0.9943). Russia (0.9856) follows closely behind, differing only in income classification. Mexico (0.9132), Brazil (0.9128), and the United States (0.9023) follow next in the ranking. Notably, the United States is a high-income country surpassed by three upper-middle-income economies. Colombia (0.8576) ranks eighth, with performance similar to that of Nigeria (0.8470) and Nicaragua (0.8047)—both lower-middle-income countries. El Salvador (0.7881) and India (0.7641) appear next, while the countries with the lowest efficiency levels include Afghanistan (0.7034), Madagascar (0.6957), Uganda (0.6783), and Haiti (0.6366).
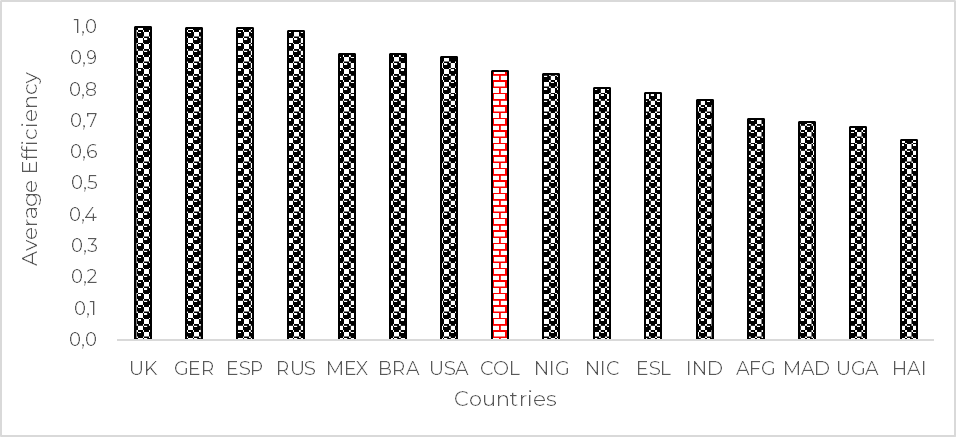
Figure 4
Global efficiency rankings for countries with different income levels, 2020
Figura 4. Eficiencia global para el conjunto de países de diferentes niveles de ingreso, 2020 (Ranking)
Source: Authors’ own work.5. DISCUSSION
Economic inequalities have long been a central topic in economic policy debates, with fiscal mechanisms serving as key tools for reducing disparities in income redistribution across countries. The relationship between these two concepts is a cornerstone of global economic discussions. Policymakers in each nation are deeply concerned about distributional outcomes and other objectives aimed at mitigating economic inequalities, especially in relation to income levels in other countries. High-income economies, such as the United States, Germany, the United Kingdom, and Spain, benefit from strong economic growth and sustainable public finances, which allows them to more effectively align their fiscal policies with the reduction of economic inequality.
In contrast, upper-middle-income, lower-middle-income, and low-income countries rely on the available fiscal tools to reduce economic inequalities. These include measures such as increasing general and specific tax collection (Russia, Colombia, Nicaragua, El Salvador, India, and Brazil); expanding social security contributions (Russia, Colombia, and Brazil); implementing progressive taxation (Mexico and Russia); and reducing fiscal uncertainty (Brazil). Many also increase public spending (Nigeria, Mexico, Brazil, Colombia, Russia, El Salvador, India, and Uganda), reduce public debt (Colombia, Nicaragua, El Salvador, India, and Madagascar) and introduce customs tariffs (Afghanistan, the United States, Mexico, and Haiti). These actions aim to reduce economic inequalities, particularly in lower-middle-income and low-income contexts.
The fiscal instruments used to address economic inequality vary widely across countries, reflecting differences in administrative, financial, and fiscal capacity. Advanced or high-income economies can more accurately project the impacts of transfers, tax revenues, and labor market policies. Conversely, developing countries and those in the lower-middle-income and low-income categories often lack the institutional sophistication necessary to provide complex mechanisms, which could exacerbate economic inequalities.
While Colombia occupies a middle position among the analyzed DMUS, it has made progress in developing fiscal mechanisms to reduce inequalities; however, efficiency remains limited. One possible explanation is that political and institutional decision-making processes do not reflect the level of trust required for the effective integration of fiscal and economic systems as drivers of growth and distributive policy (Benedikter et al., 2015). Similarly, Mexico and Brazil perform slightly better and surpass the United States—suggesting that it is not a country’s income level but rather the efficient allocation of resources the determining factor in the optimal combination of fiscal instruments to maximize societal benefits and reduce economic inequalities.
As mentioned, Colombia is in the middle in terms of efficiency among the countries analyzed. Compared to other upper-middle-income countries—such as Russia, Mexico, and Brazil—Colombia does not outperform any high-income country or its peers within the same income group. However, its performance exceeds that of all lower-middle-income and low-income countries. Colombia’s results are comparable to those of Nigeria and Nicaragua, and significantly outperform those of El Salvador, India, and Afghanistan. Nevertheless, its institutional capacity to manage fiscal mechanisms based on the principles of legality and ethics raises questions about its role in redistribution and social transformation, as taxation remains the primary means of ensuring collective welfare (Alkadry et al., 2019; Espinal et al., 2021).
In practice, the relationship between fiscal mechanisms and inequality reduction is direct but gradual, and is largely constrained by institutional decision-making processes (Gonareva et al., 2021; Lansing & Markiewicz, 2013). Although the fiscal framework is designed to be fair and equitable, the opposite occurs in practice: income inequality, poverty, and tax evasion remain constant. These issues erode public confidence in the fiscal system’s ability to improve redistribution, ultimately limiting its alignment with the population’s social and welfare needs (Espinal et al., 2021; Karakotsios et al., 2020).
6. CONCLUSIONS
The DEA model assesses how effectively fiscal mechanisms optimize the reduction of economic inequalities through the FEPF. While the model reveals a positive relationship between inputs and outputs, being a high-income country does not guarantee efficiency, as demonstrated by the United States. Similarly, upper-middle-income countries tend to converge towards efficiency; however, their progress is often hindered by limited institutional development and weak trust relationships between the government and taxpayers. The variables that most influence economic inequalities across all countries are Income distribution, Poverty, and Equity, with the latter significantly affecting the first two.
The countries with the best fiscal policy performance in reducing economic inequalities are the United Kingdom, Germany, and Spain. In contrast, Madagascar, Uganda, and Haiti are the least efficient countries and support the hypothesis that lower institutional capacity correlates with higher economic inequality (Krugman, 2020).
Russia stands out as a strong performer among upper-middle-income countries, surpassing the United States. As a high-income country, the United States would be expected to achieve greater efficiency. These two cases reveal a discrepancy with the rest of the sample, most of which display below-average performance, including Colombia. Similarly, Mexico and Brazil, the next best-performing countries, also exceed the United States, reinforcing the conclusion that efficiency depends on the strategic allocation of resources rather than income level, enabling a more effective combination of fiscal instruments to narrow economic inequality gaps.
Colombia occupies an intermediate position in terms of efficient performance. Compared to similar upper-middle-income countries, such as Russia, Mexico, and Brazil, it does not reach their average efficiency levels or those of high-income economies. Nevertheless, Colombia outperforms low-income and lower-middle-income countries. To improve its performance, Colombia must strengthen social investment projects that promote territorial integration and guarantee citizens access to essential public services.
A critical variable to consider in future research is corruption arising from tax reductions, such as exemptions, credits, and deductions. These reductions are often designed to favor large capital groups under the premise of stimulating employment and development. However, as these measures have not resulted in significant reductions in unemployment (Espinal et al., 2021), they may become a fiscal mechanism that exacerbate inequalities by reducing effective tax rates and weakening income redistribution. As Jong-Song and Khagram (2005) noted, inequality driven by corruption is associated with both lower tax rates and reduced government transfers and subsidies. Likewise, evidence suggests that the impact of inequality on economic growth can, at least in part, be explained as an underlying effect of corruption.
REFERENCES
Acemoglu, D., Robinson, J. A., & Torvik, R. (2013). Why Do Voters Dismantle Checks and Balances? The Review of Economic Studies, 80(3), 845-875. https://doi.org/10.1093/restud/rdt007
Adams, S., & Klobodu, E. K. M. (2016). Financial development, control of corruption and income. International Review of Applied Economics, 30(6), 790-808. https://doi.org/10.1080/02692171.2016.1208740
Aguilera Verduzco, M. (1998). Crecimiento económico y distribución del ingreso, Balance teórico y evidencia empírica. Facultad de Economía UNAM-Escuela Nacional de Estudios Profesionales Acatlán.
Alamanda, A. (2021). The effect of economic growth on incomeinequality: Panel data analysis from fifty countries. Info Artha, 5(1), 1-10. https://jurnal.pknstan.ac.id/index.php/JIA/article/view/1176
Alfani, F., Clementi, F., Fabiani, M., Molini, V., y Schettino, F. (2024). Underestimating the Pandemic: The Impact of COVID-19 on Income Distribution in the US and Brazil. Economies, 12(9), 235. https://doi.org/10.3390/economies12090235
Alkadry, M. G., Trammell, E., & Dimand, A. M. (2019). The power of public procurement: social equity and sustainability as externalities and as deliberate policy tools. Procurement Management, 12(3), 336-362. https://doi.org/10.1504/IJPM.2019.099553
Angelov, N., & Waldenström, D. (2023). COVID-19 and income inequality: evidence from monthly population registers. The Journal of Economic Inequality, 21(2), 351-379. https://doi.org/10.1007/s10888-022-09560-8
Arauco, V. P., Molina, G. G., Aguilar, E. Y., & Pozo, W. J. (2013). Explaining Low Redistributive Impact in Bolivia. Public Finance Review, 42(3), 326-345. https://doi.org/10.1177/1091142113496133
Agnello, L., Castro, V., Jalles, J. T., & Sousa, R. (2017). Income Inequality, Fiscal Stimuli and Political (In)Stability. International Tax Public Finance, 24, 484-511. https://hdl.handle.net/2134/24127
Banerjee, A. V., & Duflo, E. (2000). Inequality and Growth: What Can the Data Say? Working Paper 00-99. Massachusetts Institute of Technology, Department of Economics.
Banzhaf, H. S., Mickey, R., & Patrick, C. (2021). Age-based property tax exemptions and school quality. Journal of Urban Economics, 121, 103311. https://doi.org/10.1016/j.jue.2020.103311
Barrientos Marín, J. H., Ramírez Ramírez, S., & Tabares, E. (2014). El patrón de crecimiento económico y la pobreza en Colombia. Perfil de Coyuntura Económica, (24), 7-31. https://revistas.udea.edu.co/index.php/coyuntura/article/view/24412
Barro, R. J. (2000). Inequality and Growth in a Panel of Countries. Journal of Economic Growth, 5(1), 87-120. https://www.jstor.org/stable/i40007506
Benedikter, R., Siepmann, K., & Zlosilo, M. (2015). The educational dimension: Michelle Bachelet II’s “Master Plan” for Chile’s Future -The reform of education”. En R. Benedikter y K. Siepmann (eds.), Chile in transition: prospects and Challenges for Latin America’s Forerunner of Development (159-187). Springer International Publishing. https://link.springer.com/chapter/10.1007/978-3-319-17951-3_7
Bengoa Calvo, M., & Sánchez-Robles Rute, B. (2001). Crecimiento económico y desigualdad en los países latinoamericanos. ICE: Revista de Economía, 1(790), 63-74. https://revistasice.com/index.php/ICE/article/view/192
Beramendi, P., & Rogers, M. (2020). Fiscal decentralization and the distributive incidence of the Great Recession. Regional Science and Urban Economics, 84(7), 881-896. https://doi.org/10.1080/00343404.2019.1652895
Berdiev, A. N., & Saunoris, J. W. (2019). On the Relationship Between Income Inequality and the Shadow Economy. Eastern Economic Journal, 45(2), 224-249. https://doi.org/10.1057/s41302-018-0120-y
Bernasconi, M., & Profeta, P. (2012). Public education and redistribution when talents are mismatched. European Economic Review, 56(1), 84-96. https://doi.org/10.1016/j.euroecorev.2011.06.001
Berzosa, C. (2002). Los desafíos de la economía mundial en el siglo XXI. Catarata.
Bird, R. M., & Zolt, E. M. (2005). Redistribution via Taxation: The Limited Role of the Personal Income Tax in Developing Countries. UCLA Law Review, 52(6), 1627-1695. https://www.uclalawreview.org/wp-content/uploads/2019/09/39_52UCLALRev16272004-2005.pdf
Bogetoft, P., & Otto, L. (2011). Benchmarking with DEA, SFA and R. International Series in Operations Research & Management Science, Vol. 157. Springer. https://link.springer.com/book/10.1007/978-1-4419-7961-2
Bucheli, M., Lusting, N., Rossi, M., & Amábile, F. (2013). Social Spending, Taxes, and Income Redistribution in Uruguay. Public Finance Review, 42(3), 413-433. https://doi.org/10.1177/1091142113493493
Camacho Pérez, J. A. (2020). Participación ciudadana para el combate a la corrupción. Un análisis del Comité de Participación Ciudadana del Sistema Nacional Anticorrupción. Buen Gobierno, (28), 140-153. https://www.redalyc.org/journal/5696/569662688006/569662688006.pdf
Caminada, K., Goudswaard, K., Wang, C., & Wang, J. (2019). Income Inequality and Fiscal Redistribution in 31 Countries After the Crisis. Comparative Economic Studies, 61(1), 119-148. https://doi.org/10.1057/s41294-018-0079-z
Caminada, K., Goudswaard, K., Wang, C., & Wang, J. (2021). Antipoverty Effects of Various Social Transfers and Income Taxes Across Countries. Social Indicators Research, 154(3), 1055-1076. https://doi.org/10.1007/s11205-020-02572-9
Casas Zamora, K., Muñoz-Pogossian, B., & Vidaurri, M. (2011). Consideraciones sobre la desigualdad política en las Américas. En Organización de los Estados Americanos (ed.), Desigualdad e Inclusión Social en las Américas (pp. 55-76). OEA.
Cepal. (2019). Panorama Fiscal de América Latina y el Caribe 2019: políticas tributarias para la movilización de recursos en el marco de la Agenda 2030 para el Desarrollo Sostenible. Cepal. https://repositorio.cepal.org/handle/11362/44516
Cingano, F. (2014). Trends in Income Inequality and its impact on Economic Growth. OECD Social, Employment and Migration Working Papers, No. 163. OECD Publishing. https://www.oecd.org/en/publications/trends-in-income-inequality-and-its-impact-on-economic-growth_5jxrjncwxv6j-en.html
Citi, M., & Justesen, M. K. (2021). Redistribution in a political union: The case of the EU. European Journal of Political Research, 60(2), 317-338. https://doi.org/10.1111/1475-6765.12397
Coelli, T. J., Prasada Rao, D. S., O’Donell, C. J., & Battese, G. E. (2005). An Introduction to Efficiency and Productivity Analysis (2a. ed.). Springer.
Colclough, C. (2012). Education, poverty and development – mapping their interconnections. Comparative Education, 48(2), 135-148. https://doi.org/10.1080/03050068.2011.608891
Cutler, H., Shields, M., & Davies, S. (2018). Can State Tax Policy Increase Economic Activity and Reduce Inequality? Growth and Change, 49(1), 142-164. https://doi.org/10.1111/grow.12216
Dyrda, S., & Pedroni, M. (2023). Optimal fiscal policy in a model with uninsurable idiosyncratic income risk. The Review of Economic Studies, 90(2), 744-780. https://doi.org/10.1093/restud/rdac031
Enami, A., Lustig, N., & Taqdiri, A. (2019). Fiscal Policy, Inequality and Poverty in Iran: Assessing the Impact and Effectiveness of Taxes and Transfers. Journal Middle East Development Journal, 11(1), 49-74. https://doi.org/10.1080/17938120.2019.1583510
Esaku, S. (2021). Does income inequality increase the shadow economy? Empirical evidence from Uganda. Development Studies Research, 8(1), 147 -160. https://doi.org/10.1080/21665095.2021.1939082
Espinal, J., Colorado, J. E., Cabrera, R., & Espinosa, M. (2021). Eficacia del sistema tributario bajo las pretensiones del legislativo: análisis de los objetivos propuestos en la Ley 1607 de 2012 y la Ley 1819 de 2016. Contaduría Universidad de Antioquia, 78, 205-224. https://revistas.udea.edu.co/index.php/cont/article/view/344478/20805561
Evans, A. D., & Harshorn, I. M. (2021). Education as the “silver bullet”: bringing politics. New Political Science, 43(3), 280-300. https://doi.org/10.1080/07393148.2021.1928442
Ferreira, F. H. G., Leite, P. G., & Ravallion, M. (2007). Poverty Reduction without Economic Growth? Explaining Brazil’s Poverty Dynamics, 1985-2004 (English). Policy Research working paper; no. WPS 4431. World Bank. http://documents.worldbank.org/curated/en/169731468226737145
Festa, A. (2018). Inequality, Redistribution, and Growth in Developed Countries. Applied Economics Quarterly, 64(4), 297-323. https://doi.org/10.3790/aeq.64.4.297
Galindo, M., & Ríos, V. (2015). Desigualdad. En Serie de Estudios Económicos, Vol. 1. México ¿cómo vamos?
Gallo, P. C. (2006). El Impacto de la Composición Sectorial del Crecimiento Sobre la Pobreza en Venezuela: 1975-2003. Revista Venezolana de Análisis de Coyuntura, 12(2), 81-114. https://saber.ucv.ve/ojs/index.php/rev_ac/article/view/10639
Gandhari, Y. (2021). Equity in higher education of Nepal. International Journal of Educational Administration and Policy Studies, 13(1), 40-47. https://doi.org/10.5897/IJEAPS2021.0694
Gaspar, V., & García-Escribano, M. (2017, 11 de octubre). Desigualdad: La política fiscal puede corregir la situación [blog]. IMF Blog. https://www.imf.org/es/Blogs/Articles/2017/10/11/inequality-fiscal-policy-can-make-the-difference
Gomo, C. (2019). Government transfers, income inequality and poverty in South Africa. International Journal of Social Economics, 46(12), 1349-1368. https://doi.org/10.1108/IJSE-09-2018-0458
Gonareva, I., Vitalina, B., Shmaktko, N., & Dariusz, P. (2021). Correlation of Income Inequality and Entrepreneurial Activity. Journal of Optimization in Industrial Engineering, 14, 33-38 https://doi.org./10.22094/JOIE.2020.677815
Gunay, S., Can, G., & Ocak, M. (2021). Forecast of China’s economic growth during the COVID-19 pandemic: a MIDAS regression analysis. Journal of Chinese Economic and Foreign Trade Studies, 14(1), 3-17. https://doi.org/10.1108/JCEFTS-08-2020-0053
Gutiérrez Ortiz, A. (2010). El Puerto de Lázaro Cárdenas y su eficiencia en la cuenca del pacífico (2003-2008): Un Análisis Envolvente de Datos. Universidad Michoacana de San Nicolás de Hidalgo. Instituto de Investigaciones Económicas y Empresariales. http://bibliotecavirtual.dgb.umich.mx:8083/xmlui/handle/DGB_UMICH/945
Higgins, S., & Lustig, N. (2016). Can a poverty-reducing and progressive tax and transfer system hurt the poor? Journal of Development Economics, 122, 63–75. https://doi.org/10.1016/j.jdeveco.2016.04.001
Hosseinzadeh, F., Ebrahimnejad, A., Vaez-Ghasemi, M., & Moghaddas, Z. (2020). Data envelopment analysis with R. Springer.
Insulza, J. M. (2011). Desigualdad, democracia e inclusión social. En Organización de los Estados Americanos (ed.), Desigualdad e inclusión social en las Américas 14 Ensayos (pp. 13-34). OEA. https://www.oas.org/docs/desigualdad/libro-desigualdad.pdf
Jesuit, D. K., & Mahler, V. A. (2017). LIS Working Paper, Series 717. Fiscal redistribution in comparative perspective: Recent evidence from the Luxembourg Income Study (LIS) datacenter. LIS. https://www.lisdatacenter.org/wps/liswps/717.pdf
Jiménez, J. P. (ed.) (2015). Desigualdad, concentración del ingreso y tributación sobre las altas rentas en América Latina. Naciones Unidas Cepal-cef. https://repositorio.cepal.org/server/api/core/bitstreams/19af03d3-af5c-4b0f-ba27-6f53df74ac97/content
Jong-Song, Y., & Khagram, S. (2005). A Comparative Study of Inequality and Corruption. American Sociological Review, 70(1), 136-157. https://www.jstor.org/stable/4145353
Karabarbounis, L. (2011). One Dollar, One Vote. The Economic Journal, 121(553), 621-651. https://doi.org/10.1111/j.1468-0297.2010.02406.x
Karakotsios, A., Katrakilidis, C., Dimitriadis, D., & Christoforidis, T. (2020). Examining the relationship between income inequality, taxationand economic freedom: Apanel cointegration approach. Economics and Business Letters, 9(3), 206-215. https://doi.org/10.17811/ebl.9.3.2020.206-215
Kebede, S., Van Harmelen, A.-L., & Roman-Urrestarazu, A. (2022). Wealth Inequality and Intimate Partner Violence: An Individual and Ecological Level Analysis Across 20 Countries. Journal of Interpersonal Violence, 37(17-18), 1-26. https://doi.org/10.1177/08862605211016337
Keefer, P., & Knack, S. (2002). Polarization, politics and property rights: Links between inequality and growth. Public Choice, 111(1), 127-154. https://doi.org/10.1023/A:1015168000336
Keneck-Massil, J., Nomo-Beyala, C., & Owoundi, F. (2021). The corruption and income inequality puzzle: Does political power distribution matter? Economic Modelling, 103, 105610. https://doi.org/10.1016/j.econmod.2021.105610
Klasen, S. (2004). In search of the holy grail: how to achieve pro-poor growth? IAI Discussion Papers, No. 96. Georg-August-Universität Göttingen, Ibero-America Institute for Economic Research (IAI), Göttingen.
Koger, G., & Rodríguez, S. (2021). Economic inequality and congressional action in the United States: A comparison of the minimum wage and alternative minimum tax. Poverty & Public Policy, 13(3), 273-292. https://doi.org/10.1002/pop4.319
Koske, I, Fournier, J. M., & Wanner, I. (2012). Less Income Inequality and More Growth – Are They Compatible? Part 2. The Distribution of Labour Income, Economics Department Working Paper, No. 925. OECD Publishing.
Krugman, P. (2011). Oligarchy, American Style. Economist's View.
Krugman, P. (2020). Arguing with the Zombies. W.W. Norton.
Lansing, K. J., & Markiewicz, A. (2013). Top Incomes, Rising Inequality, and Welfare, Working Paper 10 [paper]. Norges Bank Research. https://nbp.pl/wp-content/uploads/2023/01/Top-incomes-rising-inequality-and-welfare.pdf
Lehmann, C. (2010). Working Paper No. 2010-32. Why may government transfers to the poor have modest effects on reducing rural inequality? Paris School of Economics. https://shs.hal.science/halshs-00564924v1
Liu, C., & Olamijuwon, E. (2024). The link between intimate partner violence and spousal resource inequality in lower- and middle-income countries. Social Science & Medicine, 345, 116688. https://doi.org/10.1016/j.socscimed.2024.116688
Macías Vázquez, A. (2014). Crecimiento, desigualdad y pobreza: Estado de la cuestión. Revista de Economía Institucional, 16(31), 101-126. https://revistas.uexternado.edu.co/index.php/ecoins/article/view/3878
Marrero, G., & Servén, L. (2022). ¿Growth, inequality and poverty: a robust relationship? Empirical Economics, 63, 725-791. https://doi.org/10.1007/s00181-021-02152-x
McDonald, B. D., & Larson, S. E. (2020). Implications of the Coronavirus on Sales Tax Revenue and Local Government Fiscal Health. Journal of Public and Nonprofit Affairs, 6(3), 379-400. https://doi.org/10.20899/JPNA.6.3.377-400
Meltzer, A. H., & Richard, S. F. (1981). A Rational Theory of the Size of Government. Journal of Political Economy, 89, 914-927. https://www.jstor.org/stable/1830813
Mirrlees, J. A. (1971). An Exploration in the Theory of Optimum Income Taxation. The Review Of Economic Studies, 38(2), 175-208. https://doi.org/10.2307/2296779
Montalvo, J. G., & Ravallion, M. (2009). The Pattern of Growth and Poverty Reduction in China (English). Policy Research working paper; no. WPS 5069. World Bank. http://documents.worldbank.org/curated/en/630501468219884900
Motahar, S. A., & Mamipour, S. (2025). The impact of wealth inequality on economic growth: A machine learning approach. Computational Economics, 1-26. https://doi.org/10.1007/s10614-025-10902-7
Novales Cinca, A. (2011). Crecimiento económico, desigualdad y pobreza. En Anales de la Real Academia de Ciencias Morales y Políticas (pp. 419-432). Ministerio de Justicia. https://www.ucm.es/data/cont/docs/518-2013-11-27-Ponencia%20210611.pdf
Onrubia, J., & Rodado, M. d. C. (2014). Presión Fiscal en España. Análisis de la presión Fiscal por niveles de renta en España, 2009-2011. Intermón Oxfam.
Ouimet, M. (2012). The Effect of Economic Development, Income Inequality, and Excess Infant Mortality on the Homicide Rate for 165 Countries in 2010. Homicide Studies, 16(3), 238-258. https://doi.org/10.1177/1088767912442500
Panigrahi, R. (2019). Economics of Subsidies in a Welfare State: Dynamics of Populist Policies and Farm Profitability. Global Business Review, 22(3), 705-717. https://doi.org/10.1177/0972150918816902
Persson, T., & Tabellini, G. (1994). Is Inequality Harmful for Growth? American Economic Review, 84(3), 600-621. https://www.jstor.org/stable/2118070
Piketty, T. (2013). Capital in the Twenty-First Century. Harvard University Press.
Power, S. (2021). From redistribution to recognition to representation: Social injustice and the changing politics of education. Globalisation, Societies and Education, 10(4), 473-492. https://doi.org/10.1080/14767724.2012.735154
Prasad, N. (2008). Policies for Redistribution: The Use of Taxes and Social Transfers, Discussion Paper 194. International Institute for Labour Studies. http://dx.doi.org/10.2139/ssrn.1358237
Ravallion, M. (2004). Pro-poor growth: A primer. Policy Research working paper 3242. Development Research Group, World Bank.
Reinders, S., Dekker, M., & Falisse, J. B. (2021). Inequalities in higher education in low‐and middle‐income countries: A scoping review of the literature. Development Policy Review, 39(5), 865-889. https://doi.org/10.1111/dpr.12535
Rojas Merchand, M. A. (2020). Desigualdad e Ideología neoliberal antidemocrática. Revista Kavilando, 12(1), 175-190. https://www.ojs.kavilando.org/index.php/kavilando/article/view/371
Rose, P., Arnot, M., Jeffery, R., & Singal, N. (2021). Reforming Education and Challenging Inequalities in Southern Contexts: Research and Policy in International Development. Routledge. https://doi.org/10.4324/9780429293467
Ryvkin, D., & Semykina, A. (2017). An experimental study of democracy breakdown, income and inequality. Experimental Economics, 20(2), 420-447. https://doi.org/10.1007/s10683-016-9490-3
Sáenz-Castro, J. E., & García González, J. D. (2019). The relationship between corruption and inequality in Colombia: empirical evidence using panel data for the period 2008-2017. Iberoamerican Journal of Development Studies, 8(2),28-49. https://doi.org/10.26754/ojs_ried/ijds.359
Salazar Méndez, Y., & Waltember, F. D. (2018). Desigualdad de renta y reivindicación por redistribución caminan juntas en Latinoamérica (1997-2015). Dados revista ciencia sociais, 61(4). https://doi.org/10.1590/001152582018162
Salvador Casara, B. G., Filippi, S., Suitner, C., Dollani, E., & Maass, A. (2023). Tax the élites! The role of economic inequality and conspiracy beliefs on attitudes towards taxes and redistribution intentions. British Journal of Social Psychology, 62(1), 104-118. https://doi.org/10.1111/bjso.12555
Sánchez Almanza, A. (2006). Crecimiento económico, desigualdad y pobreza: una reflexión a partir de Kuznets. Problemas del Desarrollo, 37(145), 11-30. https://doi.org/10.22201/iiec.20078951e.2006.145.7613
Sen, A. (2016). La desigualdad económica. Fondo de Cultura Económica.
Sen, A., & Dréze, J. (1995). Economic Development and social opportunity. Clarendon Press.
Schargrodsky, E., & Freira, L. (2021, 30 de marzo). 13 UNDP LAC Working Paper Series. Inequality and Crime In Latin America and The Caribbean. New Data For An Old Question. United Nations Development Programme UNDP. https://www.undp.org/latin-america/publications/inequality-and-crime-latin-america-and-caribbean-new-data-old-question
Sidgwich, H. (2012). The principles of political economy. Cambridge University Press.
Smith, A. (1994). The wealth of nations [original publicado en 1776] (Vol. 11937). Alianza
Stephenson, M., & Perea, J. R. (2018). No. 242. How to leverage outward FDI for development? A six-step guide for policymakers. Columbia FDI Perspectives.
Stiglitz, J. E. (2012). El precio de la desigualdad. Taurus.
Stöckl, H., Hassan, A., Ranganathan, M., & Hatcher, A. M. (2021). Economic empowerment and intimate partner violence: A secondary data analysis of the cross-sectional Demographic Health Surveys in Sub-Saharan Africa. BMC Women’s Health, 21(241), 1-13. https://doi.org/10.1186/s12905-021-01363-9
Tahlova, S., & Banociova, A. (2020). Assessment of the Redistribution Function. Montenegrin Journal of Economics, 16(3), 57-67. https://doi.org/10.14254/1800-5845/2020.16-3.5
Tang, R., & Wang, G. (2021). Educational mismatch and income inequality. Economic Modelling, 100, 105525. https://doi.org/10.1016/j.econmod.2021.105525
Verde Selva, G., Pauli, N., Kiatkoski Kim, M., & Clifton, J. (2020). Opportunity for change or reinforcing inequality? Power, governance and equity implications of government payments for conservation in Brazil. Environmental Science & Policy, 114, 12-18. https://doi.org/10.1016/j.envsci.2020.01.001
Villanthenkodath, M. A., Pal, S., & Mahalik, M. K. (2024). Income Inequality in Globalization Context: Evidence from Global Data. Journal of the Knowledge Economy, (15), 3872–3902. https://doi.org/10.1007/s13132-023-01342-5
Wang, Q., Leung, K., Jit, M., Wu, J. T., & Lin, L. (2025). Global socioeconomic inequalities in vaccination coverage, supply, and confidence. NPJ Vaccines, 10(1), 91. https://doi.org/10.1038/s41541-025-01143-8
Warr, P. G. (2002). Discussion Paper No. 2002/20. Poverty incidence and sectoral growth: evidence from Southeast Asia. United Nations University-WIDER. https://www.wider.unu.edu/sites/default/files/dp2002-20.pdf
Wortel-London, D. (2021). The Tax Trap. Dissent, 68(1), 125-134. https://doi.org/10.1353/dss.2021.0016
Zang, L., Zhang, B., & Xiong, F. (2023). Multimodal assessment of political corruption worsening national poverty: Evidence of mediating and moderating effects from global panel data. Chinese Public Administration Review, 14(3), 137-147. https://doi.org/10.1177/15396754221146073
Zhang, H., Luo, W. Q., Yang, S., & Yu, J. (2022). Impact of Covid-19 on economic recovery: Empirical analysis from China and global economies. Economic Change and Restructuring, 56, 57–78. https://doi.org/10.1007/s10644-022-09405-4
Annex 1
RStudio code for the development of the Data Envelopment Analysis
> View(Datos1)
> summary(Datos1)
> describe(Datos1)
> describe(Datos1$VioFam)
> describe(Datos1$Homic)|
> describe(Datos1$Gini)
> describe(Datos1$Pobrez)
> describe(Datos1$Alfabet)
> describe(Datos1$PIB)
> describe(Datos1$Recaud)
> describe(Datos1$Contribuc)
> describe(Datos1$Transf)
> class(Datos1)
> str(Datos1)
> x<- with(Datos1. cbind(VioFam. Homic. Gini. Pobrez. Alfabet))
> y<-matrix(Datos1$Transf)
> y<-matrix(Datos1$PIB)
> y<-matrix(Datos1$Informal)
> y<-matrix(Datos1$Recaud)
> y<-matrix(Datos1$Contribuc)
> bcc<- dea(x.y. RTS = "vrs". ORIENTATION = "in")
> bcc
> shapiro.test(bcc$eff)
> eff(bcc)
> data.frame(bcc$eff)
> summary(bcc)
> sl<- slack(x.y. bcc)
> data.frame(eff(bcc). eff(sl).sl$slack. sl$sx. sl$sy. lambda(sl))
> dea.plot(x.y. RTS = "vrs". ORIENTATION = "in-out")
> bccb<- dea.boot(x.y. NREP = 3000. RTS = "vrs". ORIENTATION = "in". alpha = 0.05)
> bccb
> superbcc <- sdea(x.y. RTS = "vrs". ORIENTATION = "in")
> superbcc
> print(peers(superbcc. NAMES = TRUE). quote = FALSE)
> excess(bcc. x)
> ccr<- dea(x.y. RTS = "crs". ORIENTATION = "in")
> ccr
> shapiro.test(ccr$eff)
> dea.plot(x.y. RTS = "crs". ORIENTATION = "in-out". add = TRUE. lty="dashed")
> superccr <- sdea(x.y. RTS = "crs". ORIENTATION = "in")
> superccr
> rint(peers(superccr.NAMES = TRUE).quote = FALSE)
Annex 2
| Economic inequality variables | Fiscal mechanism variables | |||||||||||
| Income level | Country | Year | Domestic violence: Prevalence of intimate partner violence per 10,000 inhabitants | Violence (homicides) | Gini | Pobrez | Adult literacy rate (% of people aged 15 and above) | Informality (waged workers employed, % of total employment) | gdp growth (annual %) | Revenue, excluding donations (% of gdp) | Social contributions (% of revenue) | Subsidies and other transfers (% of expense) |
| High | Spain | 2010 | 1.1 | 395 | 35.2 | 0.5 | 99.71 | 16.7 | 0.2 | 27.0 | 42.0 | 78.6 |
| 2011 | 0.8 | 388 | 35.7 | 0.9 | 99.73 | 16.4 | -0.8 | 26.4 | 42.1 | 78.7 | ||
| 2012 | 0.7 | 345 | 35.4 | 0.6 | 99.7 | 17.3 | -3.0 | 27.6 | 42.6 | 78.8 | ||
| 2013 | 0.7 | 329 | 36.2 | 0.8 | 99.56 | 17.9 | -1.4 | 26.4 | 42.9 | 78.6 | ||
| 2014 | 0.7 | 298 | 36.1 | 0.5 | 99.47 | 17.6 | 1.4 | 27.2 | 43.0 | 78.5 | ||
| 2015 | 0.7 | 294 | 36.2 | 0.6 | 99.39 | 17.3 | 3.8 | 26.3 | 43.2 | 78.6 | ||
| 2016 | 0.7 | 294 | 35.8 | 0.7 | 98.79 | 16.9 | 3.0 | 26.9 | 43.1 | 79.4 | ||
| 2017 | 0.7 | 325 | 34.7 | 0.5 | 97.27 | 16.5 | 3.0 | 27.1 | 43.3 | 79.5 | ||
| 2018 | 0.8 | 275 | 34.7 | 0.6 | 98.2 | 16.0 | 2.4 | 27.9 | 42.4 | 79.3 | ||
| 2019 | 1.2 | 262 | 34.7 | 0.6 | 98.4 | 15.7 | 2.0 | 28.0 | 43.8 | 80.1 | ||
| 2020 | 0.9 | 261 | 34.7 | 0.6 | 98.7 | 15.6 | 1.1 | 28.1 | 43.8 | 80.1 | ||
| High | United Kingdom | 2010 | 5.9 | 1.014 | 0.1 | 0.9 | 98.0 | 14.0 | 1.9 | 34.4 | 21.7 | 57.1 |
| 2011 | 5.8 | 924 | 0.3 | 0.8 | 98.1 | 14.2 | 1.5 | 34.7 | 21.4 | 57.0 | ||
| 2012 | 6.0 | 932 | 0.1 | 0.8 | 98.4 | 14.6 | 1.5 | 34.1 | 21.2 | 57.0 | ||
| 2013 | 7.4 | 908 | 0.1 | 0.8 | 99.7 | 14.6 | 2.1 | 34.9 | 20.8 | 57.0 | ||
| 2014 | 5.6 | 899 | 0.1 | 1.0 | 99.9 | 15.2 | 2.6 | 34.2 | 20.9 | 56.7 | ||
| 2015 | 7.4 | 886 | 0.1 | 0.9 | 99.9 | 15.0 | 2.4 | 34.4 | 21.2 | 57.2 | ||
| 2016 | 5.9 | 963 | 0.1 | 0.9 | 99.7 | 15.4 | 1.9 | 34.9 | 21.4 | 56.2 | ||
| 2017 | 6.2 | 973 | 0.2 | 1.0 | 99.5 | 15.4 | 1.9 | 35.4 | 21.5 | 55.1 | ||
| 2018 | 6.9 | 884 | 0.2 | 0.9 | 99.3 | 15.1 | 1.3 | 35.4 | 21.6 | 55.1 | ||
| 2019 | 7.2 | 868 | 0.2 | 0.9 | 99.4 | 15.6 | 1.5 | 35.4 | 22.6 | 54.7 | ||
| 2020 | 6.6 | 869 | 0.2 | 0.9 | 99.6 | 15.5 | 0.4 | 35.4 | 22.5 | 54.7 | ||
| High | United States | 2010 | 17.9 | 16.912 | 40.0 | 12.6 | 93.37 | 7.04 | 2.6 | 16.5 | 39.3 | 62.7 |
| 2011 | 19.2 | 16.746 | 40.9 | 13 | 92.44 | 6.82 | 1.6 | 16.7 | 34.8 | 62.1 | ||
| 2012 | 17.4 | 17.233 | 40.9 | 14.9 | 92.79 | 6.75 | 2.2 | 16.8 | 34.4 | 62.4 | ||
| 2013 | 16.6 | 16.616 | 40.7 | 15.8 | 92.81 | 6.59 | 1.8 | 18.9 | 34.5 | 63.9 | ||
| 2014 | 19.3 | 16.277 | 41.5 | 15.8 | 93.23 | 6.45 | 2.5 | 18.9 | 34.3 | 64.5 | ||
| 2015 | 21.8 | 18.364 | 41.2 | 15.5 | 93.9 | 6.44 | 2.9 | 19.1 | 34.2 | 65.8 | ||
| 2016 | 18.7 | 20.069 | 41.1 | 15.1 | 95.07 | 6.39 | 1.6 | 18.7 | 35.0 | 65.9 | ||
| 2017 | 17.3 | 20.383 | 41.2 | 14.6 | 94.63 | 6.25 | 2.4 | 19.5 | 33.7 | 65.7 | ||
| 2018 | 16.3 | 18.902 | 41.4 | 14.1 | 94.1 | 6.28 | 2.9 | 17.5 | 37.3 | 65.0 | ||
| 2019 | 18.6 | 18976 | 41.4 | 14.2 | 94.2 | 6.09 | 2.2 | 17.5 | 37.5 | 64.9 | ||
| 2020 | 17.5 | 18975 | 41.5 | 14 | 94.3 | 6.10 | 1.2 | 17.5 | 37.5 | 64.8 | ||
| High | Germany | 2010 | 4.4 | 124 | 30.2 | 0 | 94.6 | 11.6 | 4.2 | 28.0 | 55.5 | 77.9 |
| 2011 | 4.6 | 125 | 30.5 | 0 | 94.6 | 11.7 | 3.9 | 28.3 | 54.3 | 80.5 | ||
| 2012 | 5.0 | 124 | 30.9 | 0 | 94.6 | 11.6 | 0.4 | 28.6 | 54.4 | 80.6 | ||
| 2013 | 12.2 | 117 | 31.1 | 0 | 94.6 | 11.2 | 0.4 | 28.5 | 54.4 | 81.7 | ||
| 2014 | 12.6 | 114 | 30.9 | 0 | 94.6 | 11.0 | 2.2 | 28.5 | 54.4 | 82.2 | ||
| 2015 | 12.7 | 114 | 31.7 | 0 | 95.1 | 10.8 | 1.5 | 28.5 | 54.7 | 82.9 | ||
| 2016 | 24.0 | 111 | 31.9 | 0 | 95.6 | 10.4 | 2.2 | 28.4 | 55.3 | 82.9 | ||
| 2017 | 13.9 | 113 | 28.9 | 0 | 96.5 | 10.2 | 2.6 | 28.6 | 55.5 | 82.1 | ||
| 2018 | 14.1 | 113 | 28.9 | 0 | 97.2 | 9.9 | 1.3 | 29.0 | 55.4 | 82.9 | ||
| 2019 | 14.2 | 112 | 28.8 | 0 | 98.3 | 9.6 | 0.6 | 29.4 | 55.6 | 83.0 | ||
| 2020 | 14.2 | 112 | 28.8 | 0 | 99.4 | 9.6 | 0.1 | 29.4 | 55.5 | 83.1 | ||
| Upper-Middle | Colombia | 2010 | 17.2 | 28.046 | 54.6 | 2.8 | 93.4 | 53.4 | 4.5 | 21.6 | 12.5 | 41.8 |
| 2011 | 18.1 | 26.241 | 53.5 | 2.3 | 93.6 | 53.5 | 6.9 | 23.5 | 18.0 | 34.9 | ||
| 2012 | 15.7 | 25.268 | 52.6 | 2.3 | 93.4 | 53.2 | 3.9 | 26.3 | 20.1 | 51.2 | ||
| 2013 | 14.9 | 23.994 | 52.6 | 2.2 | 93.8 | 52.3 | 5.1 | 24.5 | 13.0 | 54.7 | ||
| 2014 | 22.9 | 22.391 | 52.6 | 2 | 94.2 | 51.5 | 4.5 | 23.4 | 15.9 | 58.8 | ||
| 2015 | 18.4 | 21.100 | 51 | 1.7 | 94.2 | 51.0 | 3.0 | 24.1 | 16.4 | 59.9 | ||
| 2016 | 24.9 | 20.750 | 50.6 | 1.8 | 94.7 | 51.1 | 2.1 | 24.2 | 18.2 | 48.6 | ||
| 2017 | 18.4 | 20.189 | 49.7 | 1.6 | 94.9 | 51.1 | 1.4 | 22.6 | 7.3 | 55.3 | ||
| 2018 | 19.5 | 19.860 | 50.4 | 1.7 | 95.1 | 51.4 | 2.5 | 23.3 | 11.2 | 58.1 | ||
| 2019 | 15.1 | 19.268 | 51.3 | 1.9 | 95.1 | 49.6 | 3.3 | 24.2 | 11.5 | 60.4 | ||
| 2020 | 17.2 | 19.261 | 51.3 | 2 | 95.0 | 50.1 | -6.8 | 24.2 | 11.5 | 60.3 | ||
| Upper-Middle | Mexico | 2010 | 14.2 | 26.162 | 47.2 | 1.6 | 93.1 | 33.4 | 5.1 | 18.0 | 11.5 | 61.4 |
| 2011 | 16.7 | 28.456 | 47.5 | 1.4 | 93.5 | 33.7 | 3.7 | 18.9 | 10.9 | 61.1 | ||
| 2012 | 14.3 | 26.582 | 48.7 | 1.2 | 94.2 | 33.0 | 3.6 | 18.7 | 11.1 | 58.2 | ||
| 2013 | 12.7 | 22.882 | 48.6 | 1.1 | 94.0 | 32.9 | 1.4 | 18.8 | 11.5 | 62.4 | ||
| 2014 | 14.1 | 20.143 | 48.7 | 1.1 | 94.6 | 32.2 | 2.8 | 18.3 | 11.8 | 63.5 | ||
| 2015 | 12.5 | 20.853 | 47.3 | 0.9 | 94.5 | 32.1 | 3.3 | 19.0 | 11.6 | 64.5 | ||
| 2016 | 11.9 | 24.794 | 46.3 | 0.6 | 94.9 | 31.7 | 2.6 | 19.8 | 10.9 | 64.3 | ||
| 2017 | 10.7 | 31.646 | 46.8 | 0.6 | 95.0 | 31.4 | 2.1 | 20.0 | 10.7 | 63.6 | ||
| 2018 | 9.5 | 30.590 | 45.4 | 0.5 | 95.4 | 31.6 | 2.2 | 18.8 | 11.5 | 64.1 | ||
| 2019 | 9.8 | 32.450 | 45.4 | 0.5 | 95.4 | 31.9 | -0.1 | 18.6 | 12.2 | 65.4 | ||
| 2020 | 9.4 | 32.440 | 45.3 | 0.5 | 95.6 | 32.0 | -8.2 | 18.6 | 12.1 | 65.3 | ||
| Upper-Middle | Brazil | 2010 | 6.2 | 60.959 | 52.9 | 1.8 | 90.4 | 32.1 | 7.5 | 29.0 | 31.6 | 57.9 |
| 2011 | 7.2 | 60.598 | 52.9 | 1.9 | 91.4 | 31.5 | 4.0 | 29.1 | 31.9 | 57.1 | ||
| 2012 | 9.4 | 65.011 | 53.5 | 1.4 | 91.3 | 29.9 | 1.9 | 29.6 | 31.5 | 59.2 | ||
| 2013 | 12.4 | 63.943 | 52.8 | 1 | 91.5 | 30.1 | 3.0 | 28.7 | 32.3 | 59.1 | ||
| 2014 | 7.2 | 64.564 | 52.1 | 0.9 | 91.7 | 30.0 | 0.5 | 27.4 | 33.8 | 58.8 | ||
| 2015 | 6.9 | 64.859 | 51.9 | 1.1 | 92.0 | 31.3 | -3.5 | 29.3 | 31.6 | 52.1 | ||
| 2016 | 6.8 | 67.937 | 53.3 | 1.4 | 92.8 | 31.8 | -3.3 | 29.6 | 31.2 | 56.9 | ||
| 2017 | 19.3 | 68.886 | 53.3 | 1.6 | 93.1 | 32.3 | 1.3 | 27.9 | 33.8 | 59.4 | ||
| 2018 | 36.4 | 68.129 | 53.9 | 1.6 | 93.2 | 32.8 | 1.3 | 29.1 | 32.3 | 59.0 | ||
| 2019 | 56.4 | 68.779 | 53.4 | 1.7 | 93.6 | 33.1 | 1.1 | 29.7 | 31.8 | 61.7 | ||
| 2020 | 49.5 | 68.770 | 53.8 | 1.7 | 93.9 | 33.1 | -0.8 | 29.5 | 31.8 | 61.7 | ||
| Upper-Middle | Russia | 2010 | 15.1 | 19.013 | 39.5 | 0 | 94.1 | 6.8 | 4.5 | 26.1 | 20.3 | 60.5 |
| 2011 | 14.3 | 17.650 | 39.7 | 0 | 95.4 | 7.0 | 4.3 | 29.1 | 19.5 | 59.8 | ||
| 2012 | 12.6 | 16.275 | 40.7 | 0 | 96.3 | 6.9 | 4.0 | 27.2 | 21.0 | 59.4 | ||
| 2013 | 14.6 | 16.048 | 40.9 | 0 | 96.2 | 7.2 | 1.8 | 26.5 | 25.2 | 61.2 | ||
| 2014 | 17.9 | 16.519 | 39.9 | 0 | 94.4 | 7.2 | 0.7 | 27.2 | 26.1 | 66.3 | ||
| 2015 | 16.3 | 16.645 | 37.7 | 0 | 95.7 | 7.2 | -2.0 | 24.5 | 21.4 | 68.9 | ||
| 2016 | 19.1 | 15.868 | 36.8 | 0 | 96.7 | 7.5 | 0.2 | 24.3 | 26.5 | 71.2 | ||
| 2017 | 24.9 | 13.316 | 37.2 | 0 | 95.1 | 6.6 | 1.8 | 24.5 | 22.9 | 70.6 | ||
| 2018 | 22.4 | 12.296 | 37.5 | 0 | 96.4 | 6.8 | 2.5 | 27.3 | 21.9 | 68.8 | ||
| 2019 | 21.4 | 11.450 | 37.4 | 0 | 98.6 | 8.2 | 1.3 | 27.4 | 22.4 | 69.0 | ||
| 2020 | 18.6 | 11.452 | 37.5 | 0 | 99.4 | 8.14. | 0.7 | 27.1 | 22.3 | 68.9 | ||
| Lower-Middle | Nigeria | 2010 | 65.1 | 17.110 | 36.1 | 13.4 | 64.1 | 82.6 | 8.0 | 16.4 | 7.2 | 0.0 |
| 2011 | 66.5 | 17.229 | 36.6 | 11.9 | 63.4 | 81.1 | 5.3 | 19.0 | 7.2 | 0.0 | ||
| 2012 | 64.3 | 17.287 | 38.7 | 12.5 | 62.5 | 81.6 | 4.2 | 20.9 | 7.0 | 0.0 | ||
| 2013 | 69.4 | 17.573 | 39.4 | 12.7 | 64.1 | 81.9 | 6.7 | 24.3 | 7.5 | 0.0 | ||
| 2014 | 68.0 | 17.868 | 38.4 | 12.5 | 63.7 | 81.6 | 6.3 | 27.6 | 8.2 | 0.0 | ||
| 2015 | 64.1 | 18.026 | 36.7 | 11.6 | 63.6 | 82.3 | 2.7 | 24.4 | 8.0 | 0.0 | ||
| 2016 | 68.2 | 18.210 | 36.4 | 13.4 | 62.1 | 82.6 | -1.6 | 21.6 | 8.0 | 0.0 | ||
| 2017 | 72.1 | 18.250 | 36.4 | 12.6 | 62.5 | 81.5 | 0.8 | 24.0 | 4.2 | 0.0 | ||
| 2018 | 74.3 | 18.305 | 35.1 | 12.5 | 62.4 | 80.5 | 1.9 | 23.3 | 4.3 | 0.0 | ||
| 2019 | 78.3 | 18.407 | 35.4 | 12.4 | 62.9 | 79.9 | 2.2 | 28.9 | 4.8 | 0.0 | ||
| 2020 | 79.4 | 18.408 | 35.2 | 12.6 | 62.0 | 79.9 | 1.5 | 28.9 | 4.9 | 0.0 | ||
| Lower-Middle | Nicaragua | 2010 | 7.5 | 858 | 47.3 | 1.4 | 81.3 | 48.8 | 4.4 | 14.7 | 0.0 | 37.1 |
| 2011 | 6.9 | 821 | 47.5 | 1.2 | 81.4 | 48.1 | 6.3 | 15.8 | 0.0 | 34.3 | ||
| 2012 | 9.2 | 767 | 47.4 | 1.3 | 80.3 | 47.3 | 6.5 | 16.4 | 0.0 | 33.7 | ||
| 2013 | 6.1 | 715 | 48.6 | 1.1 | 80.7 | 46.5 | 4.9 | 16.2 | 0.0 | 34.1 | ||
| 2014 | 7.5 | 667 | 46.2 | 0.8 | 81.2 | 45.7 | 4.8 | 16.4 | 0.0 | 32.3 | ||
| 2015 | 4.4 | 637 | 46.1 | 0.9 | 81.3 | 44.8 | 4.8 | 16.7 | 0.0 | 34.4 | ||
| 2016 | 7.1 | 607 | 46.2 | 0.8 | 81.2 | 43.9 | 4.6 | 17.4 | 0.0 | 31.8 | ||
| 2017 | 11.9 | 614 | 46.8 | 0.9 | 82.6 | 43.0 | 4.6 | 17.8 | 0.0 | 31.9 | ||
| 2018 | 12.5 | 631 | 46.2 | 1.0 | 82.4 | 42.8 | -3.9 | 16.9 | 0.0 | 32.0 | ||
| 2019 | 14.9 | 619 | 46.2 | 0.9 | 82.5 | 42.7 | -3.9 | 19.1 | 0.0 | 28.9 | ||
| 2020 | 16.2 | 620 | 46.2 | 0.8 | 82.1 | 42.6 | -5.7 | 19.2 | 0.0 | 28.9 | ||
| Lower-Middle | El Salvador | 2010 | 5.0 | 4.429 | 43.5 | 1.5 | 84.5 | 41.8 | 2.1 | 22.0 | 11.6 | 22.5 |
| 2011 | 7.6 | 4.376 | 42.3 | 1.1 | 85.5 | 41.7 | 3.8 | 23.2 | 10.2 | 24.9 | ||
| 2012 | 5.6 | 3.884 | 41.8 | 1.0 | 85.4 | 41.8 | 2.8 | 22.7 | 11.2 | 24.4 | ||
| 2013 | 9.0 | 3.981 | 43.4 | 0.8 | 86.8 | 41.9 | 2.2 | 21.1 | 11.0 | 14.7 | ||
| 2014 | 7.0 | 4.657 | 41.6 | 0.7 | 87.0 | 39.6 | 1.7 | 20.6 | 11.3 | 27.7 | ||
| 2015 | 6.7 | 5.537 | 40.6 | 0.4 | 88.0 | 40.4 | 2.4 | 20.8 | 11.6 | 28.5 | ||
| 2016 | 7.0 | 5.483 | 40.0 | 0.5 | 88.1 | 40.0 | 2.5 | 23.7 | 11.2 | 21.6 | ||
| 2017 | 10.8 | 5.109 | 38.0 | 0.4 | 88.5 | 40.2 | 2.2 | 25.1 | 10.6 | 19.4 | ||
| 2018 | 14.6 | 5.345 | 38.6 | 0.3 | 89.0 | 38.8 | 2.4 | 24.9 | 9.7 | 17.7 | ||
| 2019 | 15.2 | 5.485 | 38.8 | 0.2 | 89.1 | 39.1 | 2.4 | 24.0 | 11.2 | 19.7 | ||
| 2020 | 14.1 | 5.487 | 38.8 | 0.2 | 89.1 | 39.1 | 1.1 | 24.0 | 11.2 | 19.7 | ||
| Lower-Middle | India | 2010 | 21.6 | 53.464 | 36.4 | 4.8 | 69.4 | 83.3 | 8.5 | 13.2 | 0.3 | 37.0 |
| 2011 | 23.2 | 53.957 | 35.7 | 4.6 | 69.3 | 82.0 | 5.2 | 11.5 | 0.1 | 37.3 | ||
| 2012 | 22.0 | 53.904 | 35.4 | 4.7 | 69.4 | 80.7 | 5.5 | 12.6 | 0.2 | 38.8 | ||
| 2013 | 22.5 | 53.470 | 35.9 | 4.1 | 70.1 | 80.1 | 6.4 | 12.6 | 0.2 | 40.5 | ||
| 2014 | 17.6 | 53.309 | 35.8 | 3.9 | 70.6 | 79.5 | 7.4 | 11.6 | 0.1 | 37.7 | ||
| 2015 | 20.0 | 52.314 | 35.1 | 4.7 | 71.5 | 78.8 | 8.0 | 12.4 | 0.1 | 40.7 | ||
| 2016 | 23.0 | 51.532 | 35.8 | 4.2 | 72.9 | 78.1 | 8.3 | 12.9 | 0.1 | 42.7 | ||
| 2017 | 22.3 | 52.057 | 35.7 | 4.6 | 73.4 | 77.3 | 7.0 | 12.7 | 0.1 | 44.1 | ||
| 2018 | 23.1 | 51.979 | 35.6 | 4.1 | 74.6 | 76.5 | 6.1 | 13.1 | 0.1 | 44.6 | ||
| 2019 | 22.9 | 51.767 | 35.7 | 4.8 | 74.4 | 75.8 | 4.2 | 13.1 | 0.1 | 44.5 | ||
| 2020 | 23.5 | 51.766 | 35.7 | 4.9 | 74.2 | 75.5 | 2.1 | 13.1 | 0.1 | 44.5 | ||
| Low | Afganistan | 2010 | 49 | 2.638 | 27.4 | 61.2 | 31.1 | 88.6 | 14.4 | 11.1 | 0.3 | 1.8 |
| 2011 | 29 | 2.666 | 27.3 | 61.4 | 31.4 | 87.9 | 0.4 | 11.5 | 0.3 | 2.1 | ||
| 2012 | 52 | 2.702 | 27.8 | 61.5 | 31.4 | 86.6 | 12.8 | 10.2 | 0.5 | 2.7 | ||
| 2013 | 46 | 2.783 | 27.8 | 61.7 | 31.6 | 85.7 | 5.6 | 9.4 | 0.5 | 2.9 | ||
| 2014 | 41 | 2.853 | 28.6 | 61.1 | 31.9 | 84.9 | 2.7 | 8.6 | 0.6 | 3.9 | ||
| 2015 | 49 | 3.130 | 28.4 | 61.7 | 32.4 | 84.2 | 1.5 | 10.1 | 0.6 | 4.5 | ||
| 2016 | 49 | 3.191 | 28.6 | 61.8 | 35.9 | 83.5 | 2.3 | 12.7 | 0.6 | 8.4 | ||
| 2017 | 45 | 3.031 | 28.1 | 61.3 | 38.4 | 82.5 | 2.6 | 13.0 | 0.6 | 10.5 | ||
| 2018 | 51 | 3.168 | 27.8 | 61 | 43.1 | 82.3 | 1.2 | 12.9 | 0.6 | 10.4 | ||
| 2019 | 55 | 3.217 | 28.3 | 61.3 | 43.5 | 82.2 | 3.9 | 13.1 | 0.6 | 10.5 | ||
| 2020 | 57 | 3.219 | 28.6 | 61.6 | 43.7 | 82.3 | 1.3 | 13.0 | 0.6 | 10.5 | ||
| Low | Haiti | 2010 | 14.9 | 2.120 | 42.6 | 7.9 | 60.1 | 75.3 | -3.8 | 10.1 | 0.0 | 0.0 |
| 2011 | 13.9 | 2.118 | 46.1 | 8.1 | 60.7 | 74.7 | 6.2 | 10.5 | 0.0 | 0.0 | ||
| 2012 | 19.3 | 2.142 | 41.1 | 8.0 | 60.4 | 74.6 | 0.6 | 9.2 | 0.0 | 0.0 | ||
| 2013 | 17.8 | 2.173 | 42.6 | 8.1 | 61.4 | 74.3 | 3.1 | 9.4 | 0.0 | 0.0 | ||
| 2014 | 13.2 | 2.200 | 42.7 | 8.3 | 61.9 | 74.0 | 3.4 | 8.3 | 0.0 | 0.0 | ||
| 2015 | 28.0 | 2.221 | 43.1 | 8.4 | 61.4 | 73.8 | 1.6 | 9.1 | 0.0 | 0.0 | ||
| 2016 | 5.6 | 2.244 | 43.5 | 7.9 | 61.5 | 73.8 | 1.7 | 10.7 | 0.0 | 0.0 | ||
| 2017 | 8.5 | 2.265 | 43.6 | 8.1 | 61.7 | 73.7 | 2.3 | 11.0 | 0.0 | 0.0 | ||
| 2018 | 15.3 | 2.305 | 43.7 | 8.1 | 61.7 | 73.5 | 1.7 | 11.9 | 0.0 | 0.0 | ||
| 2019 | 17.8 | 2.330 | 43.6 | 8.0 | 61.7 | 73.5 | -1.7 | 11.1 | 0.0 | 0.0 | ||
| 2020 | 16.7 | 2.331 | 42.1 | 8.2 | 61.8 | 73.5 | -5.7 | 11.0 | 0.0 | 0.0 | ||
| Low | Uganda | 2010 | 25.5 | 3.808 | 40.9 | 37.9 | 73.2 | 81.3 | 5.6 | 11.3 | 0.0 | 30.4 |
| 2011 | 25.0 | 4.186 | 40.8 | 38.1 | 73.1 | 80.1 | 9.4 | 11.2 | 0.0 | 30.8 | ||
| 2012 | 33.4 | 4.435 | 41.1 | 40.3 | 70.3 | 79.5 | 3.8 | 11.5 | 0.0 | 30.4 | ||
| 2013 | 30.2 | 4.605 | 41 | 40.2 | 70.4 | 79.2 | 3.6 | 11.1 | 0.0 | 29.4 | ||
| 2014 | 29.7 | 4.885 | 41.1 | 40.9 | 70.5 | 79.0 | 5.1 | 11.4 | 0.0 | 29.7 | ||
| 2015 | 29.9 | 5.041 | 41.6 | 41.2 | 70.6 | 78.6 | 5.2 | 11.6 | 0.0 | 30.6 | ||
| 2016 | 31.0 | 5.205 | 41.4 | 40.6 | 71.9 | 78.3 | 4.8 | 12.0 | 0.0 | 27.9 | ||
| 2017 | 30.2 | 5.405 | 42.8 | 40.7 | 70.8 | 78.3 | 3.8 | 12.4 | 0.0 | 28.7 | ||
| 2018 | 36.2 | 5.867 | 42.9 | 40.1 | 72.6 | 77.8 | 6.2 | 12.5 | 0.0 | 18.3 | ||
| 2019 | 38.2 | 6.175 | 42.8 | 41.3 | 76.5 | 77.3 | 6.8 | 13.2 | 0.0 | 28.9 | ||
| 2020 | 34.1 | 6.174 | 42.8 | 41.6 | 76.2 | 77.3 | 4.1 | 13.2 | 0.0 | 28.6 | ||
| Low | Madagascar | 2010 | 24.3 | 1.718 | 42.4 | 71.7 | 70.6 | 90.7 | 0.6 | 10.6 | 6.6 | 26.5 |
| 2011 | 21.2 | 1.727 | 42.3 | 70.7 | 70.4 | 89.9 | 1.6 | 9.7 | 7.1 | 30.7 | ||
| 2012 | 26.1 | 1.700 | 42.6 | 70.7 | 71.6 | 89.0 | 3.0 | 9.2 | 3.1 | 32.7 | ||
| 2013 | 23.4 | 1.715 | 42.6 | 70.2 | 72.4 | 89.2 | 2.3 | 9.5 | 4.3 | 36.5 | ||
| 2014 | 21.9 | 1.744 | 42.8 | 70.6 | 72.1 | 89.2 | 3.3 | 9.3 | 3.9 | 36.2 | ||
| 2015 | 20.1 | 1.731 | 42.7 | 70.1 | 73.6 | 89.4 | 3.1 | 9.8 | 3.8 | 34.4 | ||
| 2016 | 17.5 | 1.739 | 42.9 | 70.5 | 73.8 | 89.2 | 4.0 | 10.1 | 2.8 | 32.3 | ||
| 2017 | 16.8 | 1.761 | 42.5 | 70.7 | 73.4 | 89.0 | 3.9 | 10.9 | 3.0 | 40.2 | ||
| 2018 | 17.5 | 1.761 | 42.4 | 70.7 | 74.2 | 88.2 | 4.6 | 11.4 | 5.0 | 30.5 | ||
| 2019 | 18.4 | 1.749 | 42.1 | 70.7 | 74.8 | 87.8 | 4.9 | 11.6 | 4.1 | 37.1 | ||
| 2020 | 14.8 | 1748 | 42.8 | 70.7 | 74.8 | 87.1 | 1.7 | 11.6 | 4.2 | 37.1 | ||
Anexo 2. Tabla de datos de entrada y salida para el modelo dea
Source: Authors’ own work based on definitions from the International Labour Organization (ilo), the World Bank Group (wbg), and the World Health Organization (who).Notes
The authors declare no financial, professional, or personal conflicts of interest that could have inappropriately influenced the results or interpretations presented in this study.
All authors contributed significantly to the development of this article, including its design, conceptual framework, methodology, data analysis, and manuscript writing and revision.
Información adicional
How to cite: Espinal Piedrahita, J. J., Cabrera Jaramillo, R. S., Aguirre Ríos, A., Vélez Escobar, S. B., y Macias, H. A. (2025). From Fiscal Mechanisms to Economic Inequalities: A Comparative Analysis of Countries with Different Income Levels. Revista CEA, 11(27), e3284. https://doi.org/10.22430/24223182.3284
Información adicional
redalyc-journal-id: 6381