SUR-SUR
Evaluation on Mathematics Teachers’ Technological Pedagogical Content Knowledge (TPACK) Scale using Rasch Model Analysis
Evaluación de la Escala de Conocimiento de Contenido Pedagógico Tecnológico (TPACK) de los Maestros de Matemáticas usando el Análisis del Modelo Rasch
Evaluation on Mathematics Teachers’ Technological Pedagogical Content Knowledge (TPACK) Scale using Rasch Model Analysis
RELIGACIÓN. Revista de Ciencias Sociales y Humanidades, vol. 4, núm. 16, pp. 342-348, 2019
Centro de Investigaciones en Ciencias Sociales y Humanidades

Esta obra está bajo una Licencia Creative Commons Atribución-NoComercial-SinDerivar 4.0 Internacional.
Recepción: 14 Marzo 2019
Aprobación: 05 Junio 2019
Abstract: The purpose of this research was to evaluate the Technological Pedagogical Content Knowledge (TPACK) scale before being explicitly used to measure mathematics teachers’ knowledge of technology integration in teaching and learning. A Rasch model analysis was used to evaluate these mathematics teachers’ TPACK scale. In this research, 66 secondary mathematics teachers were chosen as a sample to answer these 28 items with 5 points Likert scale. The collected data were analyzed using Winsteps software to obtain the Rasch model analysis output. The findings expose that the item in this mathematics teachers’ TPACK scale has reliability value .94 and separation index was 3.90. For the person, the reliability value was .94, and separation index was 3.90 too. However, some misfit items were purified and eliminated according to the research purpose and discussion with an expert. Therefore, for future research, this evaluation of mathematics teachers’ TPACK scale has provided statistical evidence that can use in measuring teachers’ knowledge of technology integration.
Keywords: TPACK, Rasch Model Analysis, Mathematics Teachers, Technology Integration, Knowledge, Teaching and Learning.
Resumen: El propósito de esta investigación fue evaluar la escala de Conocimiento de Contenido Pedagógico Tecnológico (TPACK) antes de ser utilizada explícitamente para medir el conocimiento de los docentes de matemáticas sobre la integración de tecnología en la enseñanza y el aprendizaje. Se utilizó un análisis del modelo Rasch para evaluar la escala TPACK de estos profesores de matemáticas. En esta investigación, 66 maestros de matemáticas secundarios fueron elegidos como muestra para responder a estos 28 ítems con una escala Likert de 5 puntos. Los datos recopilados se analizaron utilizando el software Winsteps para obtener el resultado del análisis del modelo Rasch. Los resultados exponen que el ítem en la escala TPACK de este profesor de matemáticas tiene un valor de confiabilidad de .94 y un índice de separación de 3.90. Para la persona, el valor de confiabilidad fue de .94 y el índice de separación también fue de 3.90. Sin embargo, algunos elementos inadaptados se purificaron y eliminaron de acuerdo con el propósito de la investigación y la discusión con un experto. Por lo tanto, para futuras investigaciones, esta evaluación de la escala TPACK de los maestros de matemáticas ha proporcionado evidencia estadística que puede usarse para medir el conocimiento de los maestros sobre la integración de la tecnología.
Palabras clave: TPACK, Análisis De Modelo Rasch, Maestros De Matemáticas, Integración De Tecnología, Conocimiento, Enseñanza y Aprendizaje.
1. INTRODUCTION
Knowledge is the essential aim in the education of all over the world. Therefore, the main objective for any teachers in teaching and learning were spread knowledge. But before they started to spread knowledge, they also need to master content knowledge and need to have expertise in teaching that is pedagogy knowledge. The same ideas happened to any subject teachers, including mathematics teachers. It is because the teacher’s understanding of mathematics content and expertise in pedagogy shows how effective they are in their profession as a teacher (Hill et al., 2008).
Meanwhile, one of the most critical aspects that were looking forward to the teacher’s teaching nowadays was technology integration as the school looked as frontiers of any changes in technology trend (Danganan & Gamboa, 2019). Therefore, it’s pivotal for teachers to dominate knowledge of technology besides pedagogy and contents. The powerful predictor of teacher’s potential technology use in a classroom was their capability to use technology (Bilici, Yamak, Kavak, & Guzey, 2013). Hence, when teachers want to integrate technology in their classroom, they also need knowledge in technology and should expert in all knowledge necessary. The interaction of this primary knowledge for technology integration was called Technological Pedagogical Content Knowledge or TPACK (Koehler, Mishra, & Cain, 2013). The same situation happened for any subject teachers, including mathematics teachers. Therefore, it was essential to find out mathematics teachers’ knowledge when integrating technology in teaching and learning via this TPACK scale.
However, the TPACK scale should be evaluated first in providing a valid measurement of mathematics teachers’ knowledge of technology integration in teaching and learning. Likewise, the evaluation will establish the validity of this TPACK scale (Cavanagh & Koehler, 2013) that used explicitly for mathematics teachers. Rasch model analysis will be used to measure the validity of this scale. A Rasch model analysis will help the researcher to ensure the scale measure what it is intended to measure, purify, or eliminate item that did not fit (Singer, 2016). It was essential to evaluate this TPACK scale before being used as it can provide better information about mathematics teachers’ knowledge of technology integration in teaching and learning. Therefore, the evaluation of these TPACK scale using Rasch model analysis will include the following summary:
-
a) to determine the person and item reliability respectively
b) to determine the item separation index of person and item
c) to identify the person and item measurement (polarity item, misfit item, unidimensional, person item map)
2. METHODOLOGY
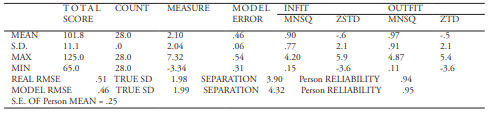
This study using a quantitative paradigm where 66 secondary mathematics teachers chosen by random sampling. A set of mathematics teachers’ TPACK Scale that adapted from Alshehri (2012) used in this study. The scale consists of 28 items that using a 5-point Likert scale ranging from one (strongly disagree) to five (strongly agree). After the cleaning process of the collected data, the data were analyzed using Winsteps software to evaluate the validity and reliability of the mathematics teachers’ TPACK scale. The person reliability, which is equivalent to Cronbach’s alpha (KR-20) show that it has an acceptable value that is .96. Besides, the person reliability of real RMSE was .94, and separation index was 3.90. The person reliability was defined as an important variable as it shows the consistency of a person when measuring the same items (Wright & Masters, 1982). For the person separation index, it shows four levels of person abilities in term of the item (Wright & Stone, 1999) that is mathematics teachers’ TPACK scale. The reliability and construct validity of 66 measure persons shown in Table 1.
For item reliability of real RMSE, it shows value .94 and separation index was 3.90 too. The item reliability shows sufficient item to measure what supposed to be measure (Azrilah, Mohd Saidfudin, & Azami, 2013). Besides, for item separation index, it shows how the person able to separate the item difficulty to four levels (Wright & Stone, 1999) and in this study, the item refers to mathematics teachers’ TPACK scale. The reliability and construct validity of 28 measure item shown in Table 2.
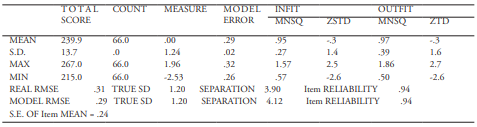
The high acceptable person and item reliability were .80 and above (Bond & Fox, 2007). The recommended separation indices for both person and item to be fair should be between two to three, and the excellent indices should be more than five (Fisher, 2007). Therefore, both person and item reliability and separation index of this study were acceptable.
3. RESULT AND DISCUSSION
Analysis of these mathematics teachers’ TPACK scale has done according to what had suggested for construct analysis through polarity item, misfit item, and unidimensional of this scale. Below was the analysis done for this evaluation.
Polarity item
According to Rasch model analysis, by referring to the study of the output, the validity of a questionnaire can be identified. The main output to be referred to is the polarity item. Polarity item was used to determine the construct validation by finding a correlation coefficient of measurement point through Point Measure Correlation Coefficient (PTMEA CORR) (Bond & Fox, 2007). A high PTMEA CORR value means that the item can distinguish between the abilities of a person. Besides, a positive value of PTMEA CORR validated that the item able to measure the construct (Linacre, 2018). A negative or zero values indicated that the time response conflict with the construct (Linacre, 2018). So, if the value were zero or negative, it means the item should be fixed or eliminated from the scale according to what the research purpose and discussion with an expert.
However, Table 3 shows the polarity item of mathematics teachers’ TPACK scale by PTMEA CORR values is more than .38. Therefore, it can conclude that the item contributes to the measurement of mathematics teachers’ TPACK scale. The TPACK scale can discriminate or differentiate between different type of knowledge held by the mathematics teachers.
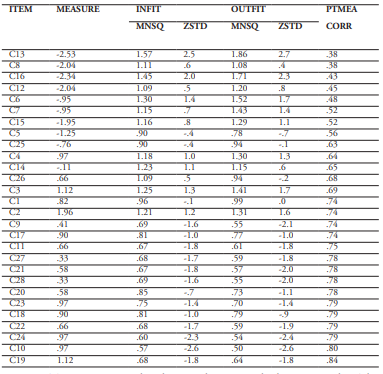
Fortunately, there was none PTMEA CORR value that equal to zero or had negative value. The minimum PTMEA CORR value was .38, and the maximum PTMEA CORR value was .84. Therefore, it shows that the item in this TPACK scale was in line with other items to evaluate mathematics teachers’ knowledge of technology integration in teaching and learning
Misfit Item
According to Rasch model analysis, the degree of suitability of items measuring variables was estimated and derived from each item. Therefore, the misfit item was measure by chi-square that is outfit and infit mean square (MNSQ). Usually, the outfit MNSQ index was check first before infit MNSQ index. For polytomous data that is a Likert scale instrument, a range between 0.6 to 1.4 usually used to identify misfit item (Bond & Fox, 2007). Therefore, the researcher decided to use the same range. Besides the MNSQ index, Z scores or ZSTD also essential to identify misfit item. The ZSTD value that accepted should be in range ±2.00. However, if the MNSQ index had agreed, the ZSTD value can be ignored (Linacre, 2018). Table 4 shows the misfit item according to the outfit and infit MNSQ index.
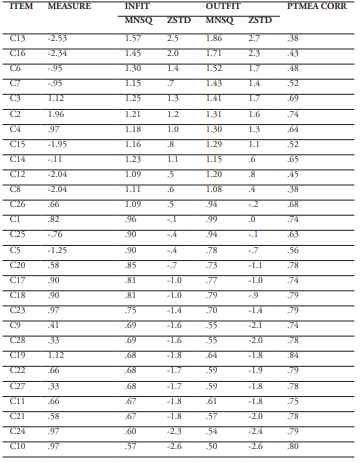
In this instrument, the analysis shows that the outfit MNSQ in range of .50 to 1.86 while infit MNSQ in range of .57 to 1.57. According to outfit MNSQ, there were 12 items outside the range .6 to 1.4. The items above 1.4 were C13(1.86), C16(1.71), C6(1.52), C7(1.43), and C3(1.41). While the items below .6 were C9(.55), C28(.55, C22(.59), C27(.59), C21(.57), C24(.54) and C10(.50). From 12 item that outside the range for outfit MNSQ, there were only three items outside the range for infit MNSQ. Two items above 1.4 were C13(1.57) and C16(1.45), while one item below .6 was C10(.57). Therefore, the researcher decided to eliminate three items that were C13, C16, and C10 as their outfit and infit MNSQ, respectively outside the range .6 to 1.4. For another nine items that were C6, C7, C3, C9, C28, C22, C27, C21, and C24, the researcher decided to purify that item. All decision to eliminate and purify item made after looking at the purpose of this study and discussion with experts.
Unidimensional
Residual Principal Component Analysis (PCA) was used to identify the instrument ability on one form dimension with noise that can be accepted. The variance of more than 20% was approved to measure the instrument dimension, but for Rasch model analysis, it needs more than 40% to show the unidimensional of the instrument (Reckase, 1979). It also agreed by Azrilah et al. (2013) that said minimum 40% raw variance explained by measures needed and variance more than 60% show as a good variance with unexplained variance in first contrast should not be more than 15%. Table 5 shows the standardized residual variance for this scale.
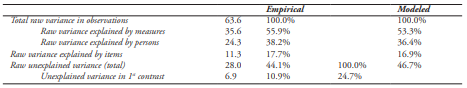
The raw variance explained by measures for this instrument was 55.9%, which was more 2.6% than the modeled percentage. Besides, the variance also more than 40% and it can be accepted to show unidimensional of this instrument. For the eigenvalue of unexplained variance in 1st contrast, it shows 6.9 units and represents 10.9%, which can be accepted as it less than 15%.
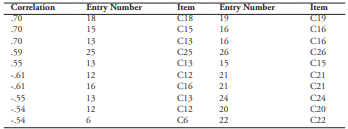
Continuously, besides the standardized residual variance, the standardized residual correlation also should be check to identify either the item depends on each other or not. The standardized residual correlation values that more significant than 0.7 indicate that the item is dependent on each other and not single (Linacre, 2018). It is because the person seeing that the item share the same character, and it is quite a conflict for them (Azrilah et al., 2013). Only one item has chosen with referring to MNSQ index if this happened (Linacre, 2018). The item that has MNSQ index approaching 1.00 should be maintained to have a good instrument. In this instrument, none items have a standardized residual correlation of more than 0.7. Table 6 shows the standardized residual correlation of this instrument.
Person map item
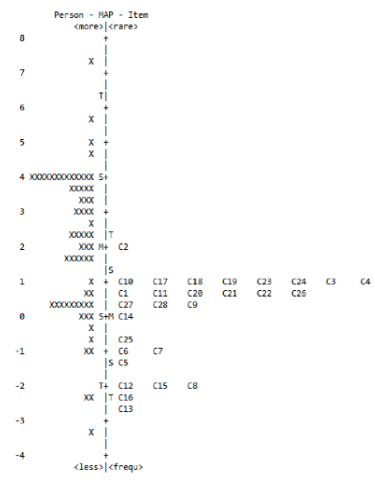
Figure 1 shows the Person-Item Map (PIDM) that indicate person ability and item difficulty. The top at left was allocated for the person with high ability in term of agreeable while the low ability person with less agreeable was place at the lower part of the scale. For the item difficulty, the most challenging item was C2 that refer to statement “I know how to solve my technical problems with digital technologies” and the less difficult was C13 that relate to statement “I have a good understanding of teaching mathematics so that students able to learn.” Meanwhile, the identical in measuring the same construct was the overlapping item at a different level of difficulty (Bond & Fox, 2007). The overlapping items were C10, C17, C18, C19, C23, C24, C3, and C4; C1, C11, C20, C21, C22, and C26; C27, C28 and C9; C6 and C7; and C12, C15, and C8. The item difficulty equally distributed among the person. The number of a person exceeds the mean of person abilities and below the mean are similarly. Most of the items were considered at a moderate level and match with person abilities.
4. CONCLUSION
The purpose of this study is providing an evaluation of the mathematics teachers’ TPACK scale via the validity of this scale had been accomplished, as suggested by Cavanagh and Koehler (2013). Although there were four levels of difficulty of items and ability of a person, the high consistency has respectively justified by the reliability of person and item. However, the misleading items should be purified or omit from this scale. For the future, this study can be discussed further based on gender and teaching experience. It can extend by different item functioning in Rasch model analysis. Besides given meaningful data, the Rasch model analysis also has created a paradigm in measuring person perception of the instrument.
BIBLIOGRAPHIC REFERENCES
Alshehri, K. A. (2012). The Influence of Mathematics Teachers’ Knowledge in Technology, Pedagogy and Content (TPACK) on Their Teaching Effectiveness in Saudi Public Schools. (Unpublished Ph.D. thesis), University of Kansas, Lawrence-Kansas.
Azrilah, A. A., Mohd Saidfudin, M., & Azami, Z. (2013). Asas Model Pengukuran Rasch: Pembentukan Skala & Struktur Pengukuran. Bangi: Penerbit Universiti Kebangsaan Malaysia.
Bilici, S. C., Yamak, H., Kavak, N., & Guzey, S. S. (2013). Technological Pedagogical Content Knowledge Self- Efficacy Scale (TPACK-SeS) for Pre-Service Science Teachers: Construction, Validation, and Reliability. Eurasian Journal of Educational Research, (52), 37–60.
Bond, T. G., & Fox, C. M. (2007). Applying the Rasch model: Fundamental measurement in the human sciences. (L. Erlbaum, Ed.) (2nd ed.). New Jersey: Mahwah.
Cavanagh, R. F., & Koehler, M. J. (2013). A Turn toward Specifying Validity Criteria in the Measurement of Technological Pedagogical Content Knowledge (TPACK). Journal of Research on Technology in Education, 46(2), 129–148.
Danganan, C. G., & Gamboa, A. G. (2019). Insight of Technology Generated Researchers: A Phenomenological Approach. Religacion Journal of Social Sciences and Humanities, 4(17), 393–409.
Fisher, W. P. J. (2007). Rating scale instrument quality criteria. Rasch Measurement Transactions, 21(1), 1095.
Hill, H. C., Blunk, M. L., Charalambous, C. Y., Lewis, J. M., Phelps, G. C., Sleep, L., & Ball, D. L. (2008). Mathematical Knowledge for Teaching and the Mathematical Quality of Instruction : An Exploratory Study. Cognition and Instruction, 26, 430–511. https://doi.org/10.1080/07370000802177235
Koehler, M. J., Mishra, P., & Cain, W. (2013). What is Technological Pedagogical Content Knowledge (TPACK)? Journal of Education, 193(3), 13–19.
Linacre, J. M. (2018). A User’s Guide to Winstep Ministep Rasch-Model Computer Programs. Beaverton, Oregon.
Reckase, M. D. (1979). Unifactor latent trait models applied to multifactor tests: Results and implications. Journal of Educational Statistics, 4(3), 207–230.
Singer, J. Z. (2016). A Rasch Analysis of a TPACK Assessment Instrument and Online K-12 Teachers in the United States. Tesis Dr. Fal, University of Toledo.
Wright, B. D., & Masters, G. N. (1982). Rating Scale Analysis Rasch Measurement. Chicago, IL: Mesa Press.
Wright, B. D., & Stone, M. (1999). Measurement Essentials.