Artículo
Eastern Caribbean Sea level rise in global context
Aumento del nivel del mar Caribe este en el contexto global
 Mark R. Jury mark.jury@upr.edu
Eastern Caribbean Sea level rise in global context
Revista de Ciencias Ambientales, vol. 60, no. 1, 21964, 2026
Universidad Nacional
Received: 02 May 2025
Revised document received: 03 November 2025
Accepted: 30 October 2025
Published: 15 November 2025
Resumen
(Introducción): El aumento del nivel del mar en el Caribe oriental se ha acelerado a 0.6 cm/año debido a los efectos globales de la acumulación de gases de efecto invernadero sobre la expansión térmica del agua de mar y el derretimiento de la nieve y el hielo terrestre.
(Objetivo): Este estudio cuantifica los procesos que impulsan el aumento del nivel del mar, incluyendo los cambios en el paisaje y la hidrología. Las mediciones del nivel del mar se contextualizan para facilitar orientaciones regionales.
(Metodología): La investigación utiliza técnicas avanzadas de asimilación de datos y modelado para analizar estadísticamente las tendencias en el tiempo y el espacio, tomando como referencia el nivel del mar en el Caribe oriental.
(Resultados): El análisis sugiere que para 2050 el nivel del mar estará 40 cm por encima del nivel de referencia de 1980, en concordancia con las proyecciones de modelos bajo el escenario de 8.5 W/m². La variabilidad interanual del nivel del mar y las tendencias parabólicas, impulsadas por el calentamiento del océano tropical y la reducción de la cobertura de nieve, son notorias. Un aumento en la expansión térmica y el escurrimiento superficial desde 2010 es evidente en los gráficos de profundidad-tiempo de las anomalías globales de temperatura y salinidad del mar.
(Conclusiones): Dado que es probable que ocurra erosión costera, se presentan medidas de adaptación locales que podrían aplicarse en otras regiones.
Palabras clave: Contexto global+ elevación del nivel del mar+ variabilidad interanual en el Caribe este.
Abstract
(Introduction): Sea level rise in the east Caribbean has accelerated to 0.6 cm/yr due to the global effects of accumulating greenhouse gases on the thermal expansion of seawater and terrestrial snow ice-melt.
(Objective): This study quantifies the processes driving sea level rise, including changes in landscape and hydrology. Sea level measurements are placed in context to facilitate regional guidance.
(Methodology): The research employs advanced data assimilation and modelling to statistically analyze trends in both time and space, using the east Caribbean Sea level as a metric.
(Results): The analysis suggests a 2050 sea level 40 cm above 1980 baseline, consistent with model projections in 8.5 W/m2 scenario. Inter-annual sea level variability and parabolic trends, driven by tropical ocean warming and depleted snow cover, are prominent. An uptick of thermal expansion and runoff since 2010 is evident from time-depth plots of global sea temperature and salinity anomalies.
(Conclusions): With beach erosion likely, local adaptative measures are outlined that could be employed elsewhere. Keywords: sea level rise; global context; east Caribbean inter-annual variability.
Keywords: Sea level rise, global context, east Caribbean inter-annual variability.
1. Introduction
Coastal zones are becoming increasingly vulnerable to rising sea level (SL), a shared consequence of radiatively forced global warming that leads to shoreline inundation (Hamlington et al., 2011; Brown et al., 2013). The combination of transient storm surge and long term SL rise from seawater expansion and terrestrial ice-melt, has over-topped sand dunes with harmful consequences. As greenhouse gases accumulate from socio-economic activities, SL trends have accelerated above 0.2 cm/year (Zhang et al., 2024). Regional variations occur because of the underlying geology and ocean currents (Yin et al., 2009; Hu et al., 2011), and low-frequency climate anomalies (Liu, 2012; Scafetta, 2013) such as the El Niño-Southern Oscillation (ENSO) that affect heat storage and runoff (Hamlington et al., 2020; Cha et al., 2021). Oceanic uptake of surplus heat contributed to a ‘hiatus’ in the 2000s (England et al., 2014), followed by renewed warming and SL rise.
Global greenhouse gas concentrations have been measured over many decades. Linear upward trends have recently accelerated (Liu & Shi, 2023), indicative of compounding effects from: (i) fossil fuel consumption (emissions ~ 30 Gt/yr), (ii) tropical forest loss (emissions and offset ~ 7 Gt/yr), (iii) snow and ice cover (albedo), (iv) rainfall intensification (runoff) and (v) ocean stratification (currents). Recent parabolic trends may align with the IPCC ‘worst case scenario’ 8.5 W/m2 radiative surplus by 2100 (Fox-Kemper et al., 2021). Climate change penetrates to local level in a variety of ways.
The eastern Caribbean is a bellweather of global change, located directly in the main path of the ocean thermohaline conveyor belt. Its densely populated Antilles Islands rely on coastal tourism and marine resources. Steady trade-winds entrain warm seawater into a westward Caribbean Current, that ultimately feeds the Yucatan Strait and Gulf Stream. Rising SL and storm surges have led to a ~ 2 m/yr retreat of beaches there, consistent with global trends (Thieler et al., 2007, Barrantes & Sandoval 2021; Winckler et al., 2023; Amrouni et al., 2024), that constrain engineered and ecological services. In response, many governments have promulgated new setback lines for coastal development based on projected inundation (O.E., 2023). Here, the following scientific questions are addressed: (i) where and when are parabolic trends in SL and inter-connected processes greatest, (ii) what are the key factors underlying parabolic trends from global warming, (iii) what are the regional inter-annual influences on Caribbean SL rise, (iv) are parabolic trends approaching the IPCC worst case scenario, and (v) what local adaptations can be made to cope with accelerating environmental change, that could be applied elsewhere?
2. Methodology
SL is analyzed from five sources around Puerto Rico: NOAA tide-gauges at (i) 18.5°N, 66.1°W and (ii) 18.0°N, 67.0°W (PSMSL 2024) and gridded sea surface height in the area 17.019.5°N, 68.0-64.0°W from (iii) multi-satellite altimeter (Copernicus Marine, 2023), (iv) global ocean data assimilation (GODAS, Penny et al., 2015) and (v) Hadley3 coupled model outputs (Andrews et al., 2020). The five monthly records are averaged to form a single time series 1980-2023 and annual cycle percentiles are calculated. A low-pass 36-month polynomial filter is applied to the continuous monthly record to focus on accelerating SL rise and inter-annual variability. Parabolic trends are compared to Hadley3 projections in 8.5 W/m2 scenario (Pascoe et al., 2020). The Caribbean study area and Puerto Rico SL time series are presented in Figure 1; Appendix 1 illustrates regional SL trends and upper ocean currents. Time-depth plots of global averaged monthly 1-500 m sea temperature and salinity anomalies are analyzed from GODAS 1980-2023.
The filtered Puerto Rico SL time series is regressed onto 1980-2023 monthly fields of: (i) 1-100 m depth averaged sea temperature (Levitus et al. 2012); multi-satellite interpolated (ii) net outgoing long-wave radiation (OLR, Lee et al., 2007), (iii) vegetation color fraction (Pinzon & Tucker 2014), (iv) tropospheric ozone (Van der A et al., 2015); and Merra2 reanalysis (Molod et al., 2015; Gelaro et al., 2017) (v) sea level air pressure, (vi) 850 hPa zonal wind and (vii) 850 hPa air temperature, (viii) terrestrial snow and ice depth, and (ix) long-wave absorption. The pointto-field regressions 1980-2023 (N=528) reveal the pattern of parabolic trends and inter-annual variability. The Merra2 product is preferred due to air chemistry and surface data assimilation, while the Hadley model is preferred for SL analysis because of validated trends (Jury, 2018).
Projections to 2050 by the CMIP6 model ensemble (Eyring et al., 2015) in 8.5 W/m2 scenario are compared with observed extrapolated parabolic trends from global annual time series of: (i) terrestrial snow and glacier mass, (ii) polar sea ice, (iii) carbon dioxide and (iv) methane concentrations, and (v) maximum rainfall (from Merra2), and (vi) primary tropical forest cover (Turubanova et al., 2018). Parabolic trends in all-time series are estimated by least squares regression, where the R2 fit accounts for explained variance. For annual interval with N=44, the required threshold is R2 > 0.21. Although SL measurements derive from Puerto Rico, most values reported here (for context) are representative of regional conditions.
It is necessary to motivate the choice of variables and model scenarios that underpin the research here. Many choices are obvious: combining in-situ gauge, multi-satellite altimetry and validated model outcomes to define sea surface height; and choosing scenarios (SSP8.5) that best match the observed parabolic sea level rise since 1980. But others are less obvious: maximum precipitation and runoff in lieu of changes in terrestrial water storage, and tropospheric ozone and vegetation fraction as indicators of secondary greenhouse gases and transpiration feedback. These offer credible new insights on the parabolic nature of global climate change, in addition to conventional variables such as terrestrial snow-ice depth and seawater temperature.
We can thus consider how these factors contribute to accelerating trends.
3. Results
3.1 East Caribbean Sea level rise
The study area map and multi-satellite dynamic topography (Figure 1a) show the Antilles Islands from Jamaica to Barbados surrounded by the Atlantic Ocean and Caribbean Sea. Puerto Rico is centrally located in the arc of islands that contain the east Caribbean Sea, but its SL data are representative of regional conditions, in areas having a stable geological base. There is a mean meridional SL gradient (0.76 m at 22°N / 0.36 m at 11°N) which draws seawater from the salty Atlantic and Amazon-Orinoco Rivers (cf. Figure 1a). The main infiltration is ~ 0.5 m/s at 13°N, 61°W, forming part of the global thermohaline conveyor which feeds the Gulf Stream via the Yucatan Strait. The annual cycle of east Caribbean SL rises and falls ~ 10 cm from September to March (Figure 1b) following the sea surface temperature (~ 3C) and steric response of air pressure (~ 5 hPa). Upper and lower SL percentiles identify inter-annual variability of similar amplitude.
The monthly SL record and its filtered time series (Figure 1c) reflects seasonal and inter-annual oscillations and an accelerating upward trend reaching ~ 0.6 cm/yr since 2010. The parabolic trend covers 85.6% of observed SL variance and follows the Hadley3 projection in 8.5 W/m2 ‘worst case’ scenario > 1.0 cm/yr by 2050. The time-depth plot of global sea temperature anomalies (Figure 1d) illustrates values of -0.3 °C in the 1-500 m layer from 1985 to 1998, followed by anomalies of +0.2 ºC from 2003 to 2012. Since 2015 warm anomalies of +0.4 ºC have deepened.
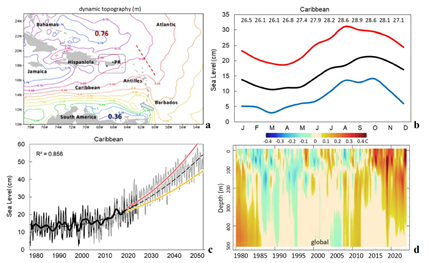
Figure 1
(a) Sea surface height (contours) in the east Caribbean, place names and long-term tide gauges (dots) within SL box; arrow represents inflow, ridge (dashed). (b) SL long-term annual cycle: 17 / 50 / 83 percentiles, with SST annual cycle listed. (c) Monthly combined SL data (thin) filtered record (thick) used in regression maps with parabolic trend (dashed), Hadley3 projected with 8.5 W/m2 scenario (grey) and annual CMIP6 ‘worst case’ 50 / 83 percentiles (yellow, red), adapted from IPCC (2021). (d) Hovmoller plot of global averaged GODAS sea temperature anomalies with depth, warming since 2010.
3.2 Point-to-field regression analysis
Field regression maps with respect to the filtered Caribbean SL time series are presented in Figure 2 and highlight inter-annual and parabolic influences. For 1-100 m sea temperature (Figure 2a) the regression pattern reflects warming of the east Pacific and west Indian Ocean, consistent with global El Niño. The surface air pressure regression map (Figure 2b) is low over the southeast Pacific, and high over the south Atlantic, the Maritime Continent, and polar regions. The 850 hPa air temperature regression map (Figure 2c) exhibits warming over the east Pacific and Africa, while 850 hPa zonal winds (Figure 2d) reveal weakening of trade winds across the west Pacific and global sub-tropics. Significantly, 1-100 m sea temperature field regressions are positive in the tropics where the thermal expansion coefficient is ~ 3 10-4 /°C, about double the global average (Roquet et al., 2022).
The multi-satellite net OLR regression map (Figure 2e) is indicative of global El Niño, exhibiting reduced cloudiness over the Maritime Continent and equatorial Atlantic, and increased cloudiness over the central Pacific. Multi-satellite tropospheric ozone (Figure 2f) reflects wet scavenging across the Pacific and west Atlantic along two equatorially symmetric axes, consistent with standing Rossby wave patterns associated with El Niño. Ozone concentrations show upward trends in polar zones consistent with sinking motions induced by higher pressure. These features are associated with inter-annual variability and parabolic trends in the filtered Caribbean SL record.
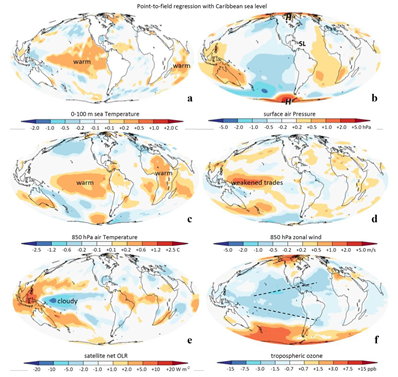
Figure 2
Parabolic regression of Caribbean Sea level with fields of: (a) 0-100 m sea temperature, (b) Surface air pressure, (c) 850 hPa air temperature, (d) 850 hPa zonal wind, (e) net outgoing longwave radiation, (f) tropospheric ozone, wet scavenging (dashed). Field significance exceeds 98% confidence, neutral zones unshaded, all values are per cm of SL rise.
3.3 Hydrological and terrestrial trends
Global variables associated with parabolic SL rise are featured in Figure 3 (a, b) via filtered time series. Snow depth over land declined rapidly 1980-2005 then leveled off. Sea ice cover crested in the 1990s (5.4%) then dropped since 2015 (4.8%) with a parabolic trend covering 82% of variance. Global albedo declined from 14.8% in the 1980s to 14.5 % most recently, as noted by Nikolov & Zeller (2024). In addition to landscape effects on global albedo, cloud fraction declined 2 % while rainfall became more concentrated (Karlsson et al., 2023). Global runoff was relatively steady (0.45 mm/day) in the period 1980-2000, then rose to 0.49 mm/day with a parabolic trend covering 69% of variance. Enhanced runoff is expected from: (i) the poleward spread of tropical convection (Lucas et al. 2014), (ii) intensified floods, (iii) highland ice-melt, and (iv) land degradation (Miao et al., 2023; Zhou et al., 2023; Muller et al., 2024). This has led to a 0.4 ppt decline of global salinity (Figure 3c) since 2005, with consequences for the meridional overturning thermohaline circulation (Hu et al., 2011). A scatterplot comparing monthly Caribbean SL and snow depth over land is presented in Figure 3d. We note two regimes: minor SL rise above 3.2 m and major SL rise below 3.1 m of terrestrial snow depth. Its parabolic regression covers 30% of variance.
Point-to-field regression maps with respect to Caribbean SL (Figure 3 e, f) highlight northern latitude responses. Snow depth has depleted across northern Canada, Alaska, Siberia, and the Eurasia highlands from Alps to Himalayas. Minor gains are seen over the Tibet Plateau and southern Canada 1980-2023. The vegetation color fraction exhibits ‘greening’ across the northern hemisphere except the polar fringe. Naturally, photosynthesis is stimulated by longer summers and higher CO2 concentrations. Note that point-tofield regression maps for southern latitudes are omitted to due weak trends.
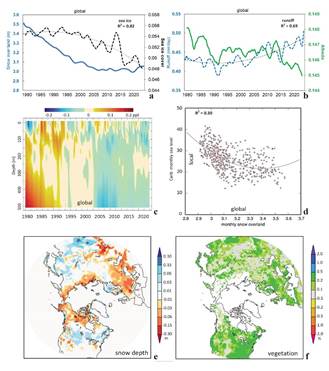
Figure 3
(a) Global monthly time series of snow depth over land and sea ice cover with parabolic trend, (b) global monthly time series of Merra2 albedo and runoff with parabolic trend. (c) Hovmoller plot of global averaged GODAS salinity anomalies with depth, freshening since 2005. (d) Scatterplot of monthly Caribbean Sea level vs. global snow depth over land, with parabolic fit. Parabolic regression of Caribbean Sea level time series onto: (e) snow depth over land, and (f) vegetation color fraction in northern latitudes, values per cm of SL rise.
3.4 Observed versus projected trends
Figure 4 compares CMIP6 ensemble projected trends with global observations extrapolated to 2050. For methane a 3rd order trend fits the 2000s hiatus, while for CO2 a 2nd order trend suffices (Figure 4a). Greenhouse gas concentrations show a parabolic increase over the next 25 years that is slightly below the CMIP6 projection in 8.5 W/m2 scenario. Snow and glacier mass and (primary) tropical forest cover (Figure 4b) shows steady declines amid multi-year fluctuations and nearly linear trends that account for ~ 86% of variance. Extrapolated trends lie above the CMIP6 ensemble projection for terrestrial ice melt, but near the 0.05% per annum decline in tropical forests due to farming and logging (Feng et al., 2022). Global terrestrial rainfall mean and maximum trends (Figure 4c) climb upward with substantial fluctuations. In contrast, the CMIP6 projection exhibits little inter-annual variability due to ensemble dispersion. The extrapolated trend for observed rainfall fits a 3rd order trend, again reflecting the 2000s hiatus. Flood intensity is projected to rise sharply after 2030 in the 8.5 W/m2 scenario. The insulating effect of rising greenhouse gases is evident from long-wave absorption (Figure 4d) wherein observed values have increased ~ 6 W/ m2. Parabolic trends extrapolate above the CMIP6 projection and offer a warning of future consequences for SL and associated variables.
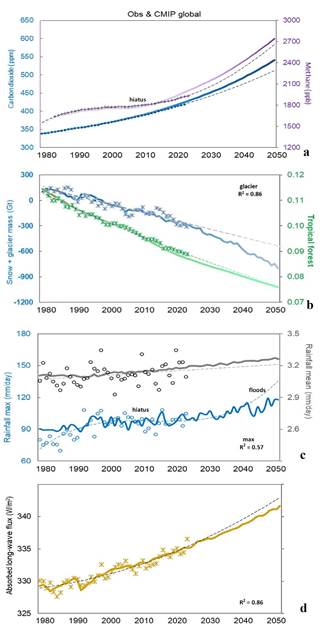
Figure 4
Global observed (symbol) and CMIP6 8.5 W/m2 scenario (line) annual: (a) carbon dioxide (blue) and methane (purple) concentrations. (b) terrestrial snow and glacier mass anomalies (blue) and tropical forest cover (green), (c) terrestrial rainfall maximum (blue) and global mean (black), and (d) surface absorbed long-wave flux. Observed parabolic trends extrapolated to 2050 (dashed) with R2 listed.
4. Conclusions
Global sea level rise has accelerated due to the inter-connectedness of oceans and accumulating effects of atmospheric greenhouse gases, land degradation, warmer sea temperatures, ice melt and runoff. The current rate of 0.6 cm/yr may reach 1.0 cm/yr by 2050, according to extrapolated observations and CMIP6 projections in 8.5 W/m2 scenario. Apportioning SL rise, there are multiple contributors (Farinotti et al., 2019; Daves, 2024): (i) seawater thermal expansion (~ 37%), (ii) highland and polar ice-melt (~ 50%), (iii) tropical forest loss and (iv) intensified runoff (~ 13%). We infer a compounding effect by global albedo, whereby lost snow cover yields a growing radiation surplus rivaling that of greenhouse gases (Pistone et al., 2014; Nikolov & Zeller, 2024). The consequences for 2050 sea level is a height ~ 40 cm above 1980 baseline, consistent with CMIP6 ensemble projections with a global surface air temperature increase of +3°C (Hermans et al. 2021).
Among the drivers of inter-annual SL variability specific to the Caribbean record, we found: (i) warming of the tropical Pacific, west Indian Ocean, and Africa, (ii) higher air pressure and reduced snow depth in polar zones, (iii) weakened trade winds over the west Pacific, (iv) a standing Rossby wave in cloud and ozone patterns, and (v) enhanced vegetation greenness from shorter winters and CO2 uptake. The relaxation of trade-winds across the subtropics (Figure 2d) means that evaporative cooling has diminished as the Hadley Cell spreads poleward (Grise & Davis 2020). Most of these factors saw an uptick in amplitude since 2010, consistent with time-depth plots of sea temperature and salinity.
While most results suggest coastline regression, an increase of runoff (cf. Figure 3b) could promote sedimentation near rivermouths (Barrantes & Sandoval 2021). Adaptative management of eroding beaches (O.E., 2023) includes engineering works and sand replenishment to sustain: (i) critical infrastructure, (ii) cultural icons, and (iii) recreational venues. If a ‘retreat’ from the coast is inevitable, then future development should be set-back above 3 m elevation behind naturally vegetated dunes, capable of withstanding inundation by storm surge and rising SL. This will necessitate: (i) abandoning structures below the designated set-back, (ii) local government reparation to private owners, (iii) restoration of beaches via soft engineering, (iv) dedicated external funding, and (v) accounting oversight (cf. CRFG, 2019; DRNA, 2022; US.gov, 2024). These actions will (i) lead to conflict (Yale, 2023) and require (ii) public awareness campaigns and (iii) gradual implementation to accommodate alternatives. Diversifying to renewable (hydro, solar, wind) energy will enable the Caribbean to join global mitigation efforts and cut greenhouse gas emissions from current levels (~ 4 T yr-1/person). Further research will consider the compounding influences on SL rise, and the out-sized role of changes at the end of record on parabolic trends. A final concern is that global mitigation efforts are being undone by emissions from regional conflicts (Scientific American, 2024), keeping extrapolated parabolic trends near the 8.5 W/m2 scenario.
5. Acknowledgements
Websites employed for data analysis include: Climate Explorer KNMI, IRI Climate Library, NASA-Giovanni, Univ. Hawaii APDRC. Outcome-based support from the South African Dept of Higher Education and Training is noted. Special thanks to the editorial team and the anonymous reviewers for the final revision feedback.
6. Ethics and conflict of interest
The author declares that he has fully complied with all pertinent ethical and legal requirements, during the study and production of the manuscript; that there are no conflicts of interest of any kind; that all financial sources are fully and clearly mentioned in the Acknowledgments section; and I hereby fully agree with the final edited version of the present article. A data spreadsheet is available by request.
7. References
Amrouni O., Heggy E., Hzami A.2024Shoreline retreat and beach nourishment are projected to increase in southern CaliforniaNature Comm. Earth Environ.5274https://doi.org/10.1038/s43247-024-01388-6
Andrews M.B., Ridley J.K., Wood R.A., et al2020Historical simulations with Hadley3-GEM for CMIP6J. Adv. Mod. Earth Sys.12e2019MS001995https://doi.org/10.1029/2019MS001995
Brown S., Nicholls R.J., Woodroffe C.D., et al2013Sea-level rise impacts and responses: a global perspectiveSpringer117-149https://doi.org/10.1007/978-94-007-5234-4
Cha H., Moon J-H., Kim T., Song Y.T.2021Underlying drivers of decade-long fluctuation in the global mean sea-level riseEnviron. Res. Lett.16124064https://doi.org/10.1088/1748-9326/ac3d58
Barrantes-Castillo G., Sandoval-Murillo F.L.2021Changes in the shoreline on South Caribbean of Costa Rica during the period 2005-2016Rev. Cienc. Amb. (Trop. J. Environ. Sci.)55111-140https://doi.org/10.15359/rca.55-2.6
Copernicus Marine2023Global ocean gridded sea surface height L4 product, European Union data storehttps://doi.org/10.48670/moi-00280
CRFG2019Coastal Resiliency Funding Guide: a tool for municipalities to recover from the impacts of hurricanes Irma and Mariawww.drna.pr.gov/wp-content/uploads/2019/02/Puerto-Rico-Coastal-Resiliency
Daves, B.2024Sea level equivalent calculationwww.antarcticglaciers.org/glaciers-and-climate/estimating-glacier-contribution-to-sea-level-rise/
DRNA2022The Puerto Rico program and coastal zone management act, appendixwww.drna.pr.gov/wp-content/uploads/2022/06/PRCZMP2009-Appendix-B
England M.H., McGregor S., Spence P., et al2014Recent intensification of wind-driven circulation in the Pacific and the ongoing warming hiatusNature Clim. Change4222-227https://doi.org/10.1038/nclimate2106
Eyring V., Sandrine B., Meehl G., et al2015Overview of the CMIP6 experimental design and organizationGeosci. Mod. Devl. Disc.810539-10583https://doi.org/10.5194/gmd-9-1937-2016
Farinotti D., Huss M., Furst J.J., et al2019A consensus estimate for the ice thickness distribution of all glaciers on EarthNature Geosci.12168-173https://doi.org/10.1038/s41561-019-0300-3
Feng Y., Zeng Z., Searchinger T.D., et al2022Doubling of annual forest carbon loss over the tropics during the early twenty-first centuryNature Sustain.5444-451https://doi.org/10.1038/s41893-022-00854-3
Fox-Kemper B., Hewitt H.T., Xiao C., et al2021Ocean, cryosphere and sea level changeIn Climate Change 2021: The Physical Science Basis, WG-1 6th Assessment of the IPCC, Masson-Delmotte, V., et al. (eds) Cambridge Univ Press, UK1211-1362
Gelaro R., McCarty W., Suárez M.J., et al2017The Modern-Era Retrospective Analysis for Research and Applications, Version 2 (MERRA-2)Journal of Climate30145419-5454https://doi.org/10.1175/JCLI-D-16-0758.1
Grise K.M., Davis S.M.2020Hadley cell expansion in CMIP6 modelsAtmos. Chem. Phys.205249-5268https://doi.org/10.5194/acp-20-5249-2020
Hamlington B. D., Leben R., Nerem R., et al2011Reconstructing sea level using cyclostationary empirical orthogonal functionsJ. Geophys. Res.116C12015https://doi.org/10.1029/2011JC007529
Hamlington B.D., Piecuch C.G., Reager J.T., et al2020Origin of inter-annual variability in global mean sea levelProc. Natl Acad. Sci.11713983-13990https://doi.org/10.1073/pnas.1922190117
Hermans T. H. J., Gregory J.M., Palmer M.D., et al2021Projecting global mean sea-level change using CMIP6 modelsGeophys. Res. Letters48e2020GL092064https://doi.org/10.1029/2020GL092064
Hu A., Meehl G. A., Han W., Yin J.2011Effect of the potential melting of the Greenland ice sheet on the meridional overturning circulation and global climate in the futureDeep Sea Res. II581914-1926doi:10.1016/j.dsr2.2010.10.069
IPCC. 2021AR6 sea level rise projections from WG-1 Ch.9, (editor) Fox-Kemper, B. et al., (curator) Garner, G. , et. al. https://doi.org/10.5281/zenodo.5914709
Jury M.R.2018Puerto Rico sea level trend in regional contextJ. Ocean Coastal Manag.163478-484https://doi.org/10.1016/j.ocecoaman.2018.08.006
Karlsson K-G., Stengel M., Meirink J.F., et al2023CLARA-A3: the third edition of the AVHRR-based CM-SAF climate data record on clouds, radiation and surface albedo covering the period 1979 to 2023Earth Syst. Sci. Data154901-4926https://doi.org/10.5194/essd-15-4901-2023
Lee H-T., Gruber A., Ellingson R.G., Laszlo I.2007Development of the HIRS outgoing longwave radiation climate datasetJ. Atmos. Oceanic Technol.242029-2047https://doi.org/10.1175/2007JTECHA989.1
Levitus S., Antonov J.I., Boyer T.P., et al2012World Ocean heat content and thermosteric sea level change 1955-2010Geophys. Res. Lett.39L10603https://doi.org/10.1029/2012GL051106
Liu Z.2012Dynamics of inter-decadal climate variability: A historical perspectiveJ. Climate251963-1995https://doi.org/10.1175/2011JCLI3980.1
Liu Y., Shi Y.2023Estimates of global forest fire carbon emissions using FY-3 active fires productAtmos. MDPI141575https://doi.org/10.3390/atmos14101575
Lucas C., Timbal B., Nguyen H.2014The expanding tropics: a critical assessment of the observational and modeling studiesWIREs Climate Change589-112https://doi.org/10.1002/wcc.251
Miao C., Wu Y., Fan X., Su J.2023Projections of global land runoff changes and their uncertainty characteristics during the 21st centuryEarth’s Future11e2022EF003286https://doi.org/10.1029/2022EF003286
Molod A., Takacs L., Suarez M., Bacmeister J.2015Development of the GEOS-5 atmospheric general circulation model: evolution from MERRA to MERRA2Geosci. Model Dev.81339-1356https://doi.org/10.5194/gmd-8-1339-2015
Muller O.V., McGuire P.C., Vidale P.L., Hawkins E.2024River flow in the near future: a global perspective in the context of a high-emission climate change scenarioHydrol. Earth Syst. Science282179-2201https://doi.org/10.5194/hess-28-2179-2024
Nikolov N., Zeller K.F.2024Roles of earth’s albedo variations and top-of-the-atmosphere energy imbalance in recent warming: new insights from satellite and surface observationsGeomatics MDPI4311-341https://doi.org/10.3390/geomatics4030017
O. E.2023Declaration on the effects of coastal erosion, Executive order #9, government of Puerto Ricowww.docs.pr.gov/files/Estado/OrdenesEjecutivas/2023/OE-2023-009%20English.pdf
Pascoe C., Lawrence B.N., Guilyardi E., et al2020Documenting numerical experiments in support of CMIP6Geosci. Model Devel.132149-2167https://doi.org/10.5194/gmd-13-2149-2020
Penny S.G., Behringer D.W., Carton J.A., Kalnay E.2015The hybrid global ocean data assimilation system at NCEPMon. Wea. Rev.1434660-4677https://doi.org/10.1175/MWR-D-14-00376.1
Pinzon J.E., Tucker C.J.2014A non-stationary 1981-2012 AVHRR NDVI3g time seriesRemote Sens.66929-6960https://doi.org/10.3390/rs6086929
Pistone K., Eisenman I., Ramanathan V.2014Observational determination of albedo decrease caused by vanishing Arctic sea iceEarth Atmos. Planet. Sciences1113322-3326https://doi.org/10.1073/pnas.1318201111
PSMSL2024Permanent Service for Mean Sea Level, tide gauge datawww.psmsl.org/data/obtaining/reference.php
Roquet F., Ferreira D., Caneill R., et al2022Unique thermal expansion properties of water key to the formation of sea ice on earthScience Adv.8eabq0793https://doi.org/10.1126/sciadv.abq0793
Scafetta N.2013Multi-scale dynamical analysis of sea level records versus PDO, AMO and NAO indicesClimate Dyn.43175-192https://doi.org/10.48550/arXiv.1304.6148
ScientificAmerican2024Warfare’s climate emissions are huge but uncountedwww.scientificamerican.com/article/warfares-climate-emissions-are-huge-but-uncounted/
Thieler E.R., Rodriguez R.W., Himmelstoss E.A.2007Historical shoreline changes at Rincon, Puerto Rico, 1936-2006USGS survey report, Woods Hole32 pphttps://doi.org/10.3133/ofr20071017
Turubanova S., Potapov P.V., Tyukavina A., Hansen M.C.2018Ongoing primary forest loss in Brazil, Democratic Republic of the Congo, and IndonesiaEnviron. Res. Lett.13074028https://doi.org/10.1088/1748-9326/aacd1c
US.gov2024Coastal flood risk and coastal erosionwww.toolkit.climate.gov/topics/coastal-flood-risk/coastal-erosion
Van der A R., Allaart M., Eskes H.2015Extended and refined multi sensor reanalysis of total ozone for the period 1970-2012Atmos. Meas. Tech.83021-3035https://doi.org/10.5194/amt-8-3021-2015
Winckler P., Martín R.A., Esparza C., et al2023Projections of beach erosion and associated costs in ChileSustain. MDPI155883https://doi.org/10.3390/su15075883
Yale2023Who will save Puerto Rico’s beaches from rising seas, storms, and developers?www.yaleclimateconnections.org/2023/04/who-will-save-puerto-ricos-beachesfrom-rising-seas-storms-and-developers-the-people/
Yin J., Schlesinger M.E., Stouffer R.J.2009Model projections of rapid sea-level rise on the northeast coast of the United StatesNature Geosci.2262-266https://doi.org/10.1038/ngeo462
Zhang L., Delworth T.L., Yang X., et al2024Causes and multiyear predictability of the rapid acceleration of US southeast sea level rise after 2010Nature Clim. Atmos. Sci.7113https://doi.org/10.1038/s41612-024-00670-w
Zhou S., Yu B., Lintner B.R., et al2023Projected increase in global runoff dominated by land surface changesNature Clim. Chg.13442-449https://doi.org/10.1038/s41558-023-01659-8
Appendix
suppl1.pdf (pdf) Appendix
Notes