Originales
Evaluation of morphometric measures of tendons and metacarpal ligaments by ultrasonography in Colombian creole horses
Evaluación de medidas morfométricas de tendones y ligamentos metacarpales palmares por ultrasonografía en caballos criollos colombianos
 Bernardo Reyes-Bossa breyesbossa@correo.unicordoba.edu.co
Hernán Medina-Ríos hernanmedinarios@gmail.com
José A Cardona-Álvarez cardonalvarez@hotmail.com
Bernardo Reyes-Bossa breyesbossa@correo.unicordoba.edu.co
Hernán Medina-Ríos hernanmedinarios@gmail.com
José A Cardona-Álvarez cardonalvarez@hotmail.com
Evaluation of morphometric measures of tendons and metacarpal ligaments by ultrasonography in Colombian creole horses
Revista MVZ Córdoba, vol. 25, no. 2, pp. 1-16, 2020
Universidad de Córdoba

This work is licensed under Creative Commons Attribution-NonCommercial-NoDerivs 4.0 International.
Received: 04 November 2019
Accepted: 04 May 2020
Published: 06 July 2020
Abstract: Objective. To determine the ultrasonographic morphometric parameters of the palmar metacarpal tendons and ligaments of clinically healthy Colombian creole horses. Materials and methods. Thirty clinically healthy Colombian creole horses of 6.4 ± 2.5 years were evaluated in different areas of the department of Córdoba (Colombia). The variables cross-sectional area (cm.), medial lateral width (ALM) (cm) and dorsal palmar thickness (EDP) (cm) in the structures of the metacarpal region in the two anterior members were measured by means of ultrasound. Results. Ultrasonography revealed that the transverse area of the suspensory ligament was the structure with the largest area in the proximal regions (1A, 1B and 2A), for both the left and right limbs. On the other hand, there was no significant difference (p>0.05) between left and right limb for measurements of structures in any area, and there was no significant difference between age groups and body mass index (BMI) of horses. Conclusions. Reference values for tendons and ligaments in the palmar metacarpal region were obtained in equines providing a reference guide when metacarpal pathological conditions in equines are suspected.
Keywords: Horses, anatomy, tendon, ligament, metacarpus, forelimb .
Resumen: Objetivo. Determinar los parámetros morfométricos ultrasonográficos de los tendones y ligamentos metacarpales palmares de caballos criollos colombianos clínicamente sanos. Materiales y m.todos. Treinta caballos criollos colombianos clínicamente sanos de 6.4 ± 2.5 años se evaluaron en diferentes zonas del departamento de Córdoba (Colombia). Se midieron las variables área transversal (cm.), ancho latero medial (ALM) (cm) y espesor dorso palmar (EDP) (cm) en las estructuras de la región metacarpiana en los dos miembros anteriores mediante ultrasonografía. Resultados. La ecografía reveló que el área transversal del ligamento suspensorio fue la estructura de mayor área en las regiones proximales (1A, 1B y 2A), tanto para la extremidad izquierda como para la derecha. Por otro lado, no hubo una diferencia significativa (p>0.05) entre la extremidad izquierda y derecha para las mediciones de las estructuras en cualquier zona, y no hubo una diferencia significativa entre los grupos de edades e índice de masa corporal (IMC) de los caballos. Conclusiones. Se obtuvieron valores de referencia para los tendones y ligamentos en la región metacarpiana palmar en equinos proporcionando una guía de referencia cuando se sospechan condiciones patológicas metacarpo en equinos.
Palabras clave: Caballos, anatomía, tendón, ligamento, metacarpo, extremidad anterior .
INTRODUCTION
Ultrasonography is a medical technique that has been widely used in equines and was introduced in 1982 by Rantanen (1). This technique helps in the diagnosis of lesions in tissues of the animal and human organism, revealing the site, size and degree of structural compromise, being necessary for the veterinarian to differentiate between normal and abnormal ultrasound patterns (2).
Examination of tendon and ligament structures in horses using ultrasound has quickly become a standard procedure, where it is used in the equine routine practice for the purposes of diagnosis and evaluation of some series of injuries or monitoring of treatments (3).
Lameness in horses caused by disorders in the soft tissues usually appear in the forelimbs, especially in the tendons and ligaments of the palmar metacarpal area. Ultrasound diagnosis has proven to be safe and non-invasive to detect these lesions, which allows their morphological evaluation and, more importantly, their observation over time (5).
Changes in the cross-sectional area of ligaments and tendons of the palmar metacarpal region in horses (Thoroughbred, Qarter horse, Arabs, Spanish thoroughbred) Clinically healthy have been reported. Similarly, the influence of age, sex, limb and body mass index (BMI) in ultrasound parameters such as the cross-sectional area of the tendons have been studied (2,6,7).
In the Colombian creole horse, there is a lack of reported evidence in relation to this topic. According to this, the aim of this study was to determine the ultrasonographic morphometric parameters of palmar metacarpal tendons and ligaments of clinically healthy Colombian creole horses. and likewise study the effect of age, sex, limb and BMI on these morphological parameters of these structures in these animals.
MATERIALS AND METHODS
Ethical guidelines. Manipulation and measurements in the animals were approved by the Animal Ethics Committee of the Faculty of Veterinary Medicine and Animal Husbandry of the University of Córdoba (Colombia) (minute: 013 March 2022).
Animals. 30 clinically healthy Colombian creole horses were used in the study, 10 stallions and 20 mares, with ages ranging between 4 and 14 years and corroborated by dental chronometry (8), A body weight ranging between 250 and 450 kg, the height at withers ranging between 1.29 and 1.46 meters. BMI is calculated as: (Weight (kg)/[Height at the withers (m)] 2) (6). All the animals in the study were of training age (9).
The forelimbs of the individuals under study were clinically evaluated (inspection, palpation and dynamic examination), with inclusion criteria of: animals with full weightbearing, horses with no lame, the inspection will not present an enlarged tendons or ligaments and without painful responses to palpation of the tendons or ligaments (2,10).
Ultrasonographic evaluation. Preparation of the animals for the ultrasound examination was carried out as follows: hair of the region between the distal aspect of accessory carpal bone (os carpis accesorium) and the proximal aspect of proximal sesamoids (11), was clipped with an electronic Whall Series Pro machine (Whall, 2018, USA), as well as medially and laterally above the fetlock. Then the region was measured with a measure tape and divided into 5 equal parts (7). Starting from 4 cm below the most palmar aspect of Os carpisaccesorium, the areas were delimited based on the previous calculation and the points were indicated with white watercolor on the lateral aspect of the region. Following this, a wash with surgical soap and warm water was applied to the studied area and a surgical spirit was applied to degrease the skin (4,11). Finally, ultrasound gel was applied in the studied area (Figure 1).
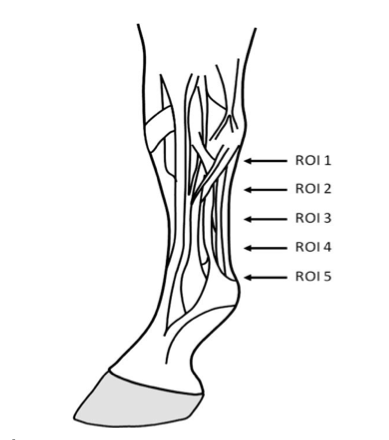
Figure 1
Scheme of the delimitation of the study areas (ROI: region of interest), taken from Boehart et al (7).
In all the animals, the ultrasound evaluation was performed by the same operator to avoid possible inter-operator variations (12). Transverse ultrasound images (dorsal anatomical plane) of the metacarpal region were obtained in the palmar aspect (Zone 1A, 1B, 2A, 2B and 3A). The ultrasound examination was performed with a mobile ultrasound equipment (Mindray M6, 2018, USA) in combination with a linear probe (Mindray) from 8 to 10 MHz and standoff pad. 2 scans in each zone were taken in both limbs, in the last zone 6 scans were taken (palmar, medial and lateral). Structures studied from palmar to dorsal were the tendo musculi flexor digitalis superficialis (Superficial Digital Flexor Tendon SDFT), tendo musculi flexor digitalis profundus (Deep Digital Flexor Tendon DDFT), ligamentum accessorium (accessory ligament DDFT AL) and the body of the musculus interosseus medius (Suspensory Ligament SL), and also the medial and lateral branches of the SL (6).
Constant focus, brightness, contrast and gain settings were used during the ultrasound sessions, being the same for all the tendons and ligaments under study (3).
Measurements. Measurements were made of the images obtained using the equipment’s measurement software. The following variables were measured for each structure in each zone: Cross sectional Area (CSA) cm., Latero medial widht (LM), Dorso palmar width (DP). Cross sectional area was obtained by delimiting the borders of each structure, the LM from the most lateral to the most medial point of each structure and the DP from the most dorsal to the most palmar point in all areas equally. The final value for each variable was the mean between the two scans that were taken for each structure; if the coefficient of variation (CV) was> 10%, two new measurements were made (3).
All ultrasound evaluations were performed at night, with the animal bearing full weight on all 4 limbs. Animals were sedated with 10% xylazine (Erma, 10% xylazine, 2019, Colombia), at a dose of 1 mg/kg, using a 5ml disposable syringe and 18 Gauges needles per animal (13).
Adquisition of data. All the data were tabulated on an electronic sheet (Microsoft Excel, 2010), and descriptive statistics were performed. Assumptions of normality and variance homogeneity were validated. A 4-factor linear mixed model was made where the “animal” was included as a random factor and “structure”, “measure” and “area” as fixed factors. Regarding age, 3 groups were formed: group 1 (n=13) included horses ≤5 years old, group 2 (n=12) included horses from 5 to 10 years old and group 3 (n=5) included horses ≥10 years. For sex, 2 groups were formed: group 1 (n=13) included stallions and geldings and group 2 (n=17) included mares. Two groups were formed for the BMI: group 1 (n=7) includes horses with a BMI ≤178 kg/m2 and group 2 (n=23) includes horses with a BMI>178 kg/m2.
One-way anova (for age) was used to determine the influence of different variables on tendon size and the student’s t-test (for sex, BMI, and limb) for each combination of zones and structures. Differences between zones and differences between structures were observed, but no substantial differences were found between the other subgroups. For all tests, a value of p≤0.05 was considered significant.
RESULTS
Values of the morphometric measurements of the metacarpal flexor tendons and ligaments of the study animals are described in table 1. The structures observed in the ultrasound can be seen in figure 2, as well as in figure 3,4,5,6, which describes the behavior of the measurements of the tendons and ligaments studied in each area according to the variables in the 30 horses of the study.
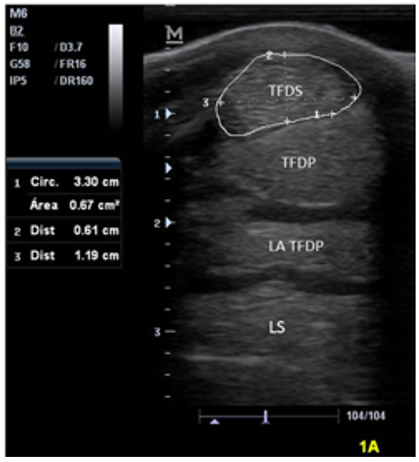
Figure 2
Ultrasonographic image of zone 1A of the palmar aspect of the metacarpus of a Colombian Creole equine (SDFT: superficial digital flexor tendon, DDFT: deep digital flexor tendon, AL: accessory ligament, SL: suspensory ligament).
| ST | Zone | Left forelimb | Right forelimb | ||||
| CSA(cm2) | LM (cm) | DP (cm) | CSA | LM | DP | ||
| SDFT | 1A | 0.518 ±0.086 | 1.054 ±0.098 | 0.519 ±0.072 | 0.507 ±0.085 | 1.042 ±0.101 | 0.512 ±0.075 |
| 1B | 0.494 ±0.067 | 1.123 ±0.099 | 0.432 ±0.061 | 0.467 ±0.074 | 1.091 ±0.114 | 0.427 ±0.043 | |
| 2A | 0.503 ±0.089 | 1.185 ±0.113 | 0.377 ±0.055 | 0.499 ±0.089 | 1.203 ±0.132 | 0.372 ±0.055 | |
| 2B | 0.556 ±0.092 | 1.335 ±0.112 | 0.364 ±0.060 | 0.536 ±0.087 | 1.344 ±0.139 | 0.341 ±0.043 | |
| 3A | 0.602 ±0.085 | 1.693 ±0.157 | 0.293 ±0.037 | 0.609 ±0.093 | 1.655 ±0.215 | 0.296 ±0.046 | |
| DDFT | 1A | 0.769 ±0.121 | 1.092 ±0.112 | 0.732 ±0.071 | 0.756 ±0.108 | 1.078 ±0.101 | 0.733 ±0.086 |
| 1B | 0.617 ±0.083 | 0.947 ±0.081 | 0.718 ±0.061 | 0.642 ±0.085 | 0.955 ±0.064 | 0.725 ±0.076 | |
| 2A | 0.576 ±0.053 | 0.904 ±0.076 | 0.701 ±0.062 | 0.592 ±0.068 | 0.918 ±0.082 | 0.728 ±0.075 | |
| 2B | 0.626 ±0.086 | 1.021 ±0.109 | 0.688 ±0.068 | 0.638 ±0.107 | 1.024 ±0.124 | 0.701 ±0.071 | |
| 3A | 0.925 ±0.112 | 1.318 ±0.140 | 0.793 ±0.078 | 0.956 ±0.137 | 1.269 ±0.199 | 0.833 ±0.092 | |
| AL | 1A | 0.535 ±0.112 | 1.054 ±0.119 | 0.436 ±0.085 | 0.498 ±0.103 | 1.022 ±0.121 | 0.414 ±0.090 |
| 1B | 0.423 ±0.082 | 0.885 ±0.110 | 0.390 ±0.059 | 0.429 ±0.093 | 0.899 ±0.134 | 0.392 ±0.072 | |
| 2A | 0.379 ±0.082 | 0.818 ±0.126 | 0.336 ±0.068 | 0.371 ±0.092 | 0.828 ±0.104 | 0.355 ±0.087 | |
| 2B | 0.329 ±0.066 | 0.843 ±0.10 | 0.307 ±0.049 | 0.310 ±0.062 | 0.845 ±0.095 | 0.277 ±0.053 | |
| SL | 1A | 0.840 ±0.133 | 1.171 ±0.118 | 0.705 ±0.069 | 0.871 ±0.134 | 1.170 ±0.114 | 0.726 ±0.064 |
| 1B | 0.826 ±0.117 | 1.135 ±0.104 | 0.722 ±0.055 | 0.834 ±0.119 | 1.144 ±0.116 | 0.725 ±0.054 | |
| 2A | 0.820 ±0.118 | 1.104 ±0.130 | 0.721 ±0.064 | 0.847 ±0.116 | 1.133 ±0.115 | 0.734 ±0.063 | |
| 2B | 0.959 ±0.188 | 1.183 ±0.146 | 0.780 ±0.142 | 0.916 ±0.150 | 1.194 ±0.121 | 0.716 ±0.157 | |
| MB | 3A | 0.631 ±0.131 | 0.638 ±0.076 | 1.011 ±0.123 | 0.630 ±0.128 | 0.621 ±0.067 | 1.027 ±0.116 |
| LB | 3A | 0.652 ±0.159 | 0.645 ±0.085 | 1.026 ±0.114 | 0.662 ±0.089 | 0.655 ±0.048 | 1.042 ±0.088 |
| ST: Structure; SDFT: Superficial digital flexor tendon, DDFT: Deep digital flexor tendon, AL: Accesory ligament, SL: Suspensory ligament, MB: Medial branch of the suspensory ligamet, LB: Lateral branch of the suspensory ligament CSA: Cross sectional area, LM:latero medial width, DP: dorso palmar width. | |||||||
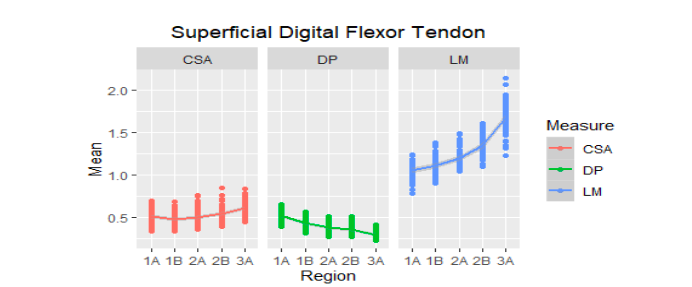
Figure 3
Mean of the ultrasound values of the superficial digital flexor tendon of the metacarpal region (1A-3A) of 30 Colombian creole horses. AT: cross-sectional area, D: dorsopalmar width and LM: lateromedial width
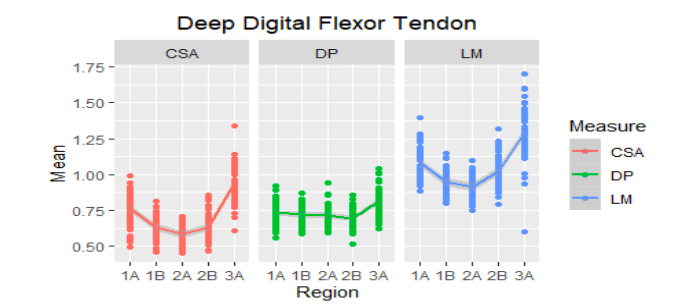
Figure 4
Mean ultrasound values of the deep digital flexor tendon of the metacarpal region (1A-3A) of 30 Colombian creole horses. AT: cross-sectional area, D: dorsopalmar width and LM: lateromedial width.
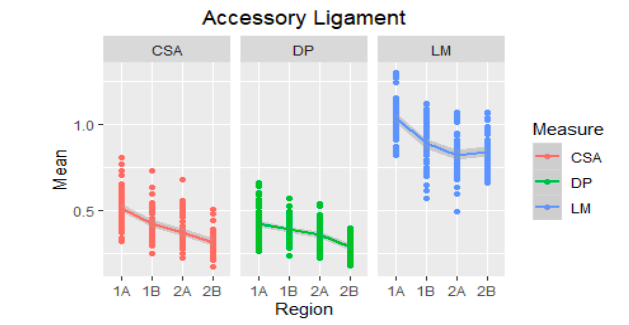
Figure 5
Mean of the ultrasound values of the accessory ligament of the DDFT of the metacarpal region (1A-2B) of 30 Colombian creole horses. AT: cross-sectional area, D: dorsopalmar width and LM: lateromedial width. DDFT: Deep Digital Flexor Tendon.
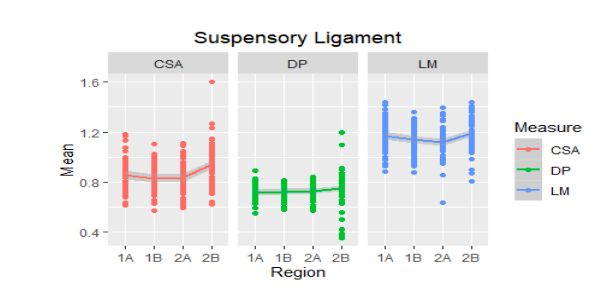
Figure 6.
Mean ultrasound values of the suspensory ligament of the metacarpal region (1A-2B) of 30 Colombian creole horses. AT: cross-sectional area, D: dorsopalmar thickness and LM: lateromedial width.
Differences in the measurements of the palmar metacarpal tendons and ligaments between groups. In the conformed groups, no significant difference (p> 0.05) was found between the measurements of the left limb compared to the right limb. Similarly, no significant difference (p> 0.05) was found between the age groups and BMI. In the case of sex, there was a significant difference (p <0.05) in the DDFT LM in zones 1A and 2B (p=0.039 and p=0.033); as well as the CSA of the AL in zones 1A and 2A (p=0.012 and p=0.043) and the LM of the same in zone 1A (p=0.027).
When evaluating each zone, it was found that there was a difference between the structures in the same zone (Table 2).
To the LM, it was found that in these animals this variable behaves very similar in the SDFT and LS in the proximal region, being the two largest structures in this regard, followed by the DDFT and the AL of the DDFT was the smallest structure in the proximal regions. The SDFT in the distal areas presented higher values followed by the DDFT that is already attached to its accessory ligament and the lowest value structure of LM were the branches of the SL.
Differences of the structures in the different zones. In the case of the tendon CSA, in the Colombian creole horses in the study, the suspensory ligament was the structure with the largest area in the proximal regions (1A, 1B, and 2A), followed by the DDFT, but the SDFT presented higher values than the DDFT accessory ligament. In the distal zones (2B and 3A), the structures with the largest area were the suspensory ligament (body and branches) and the DDFT.
| Zone | St | CS | CSA | LM | DP |
| 1A | SDFT | DDFT | < 0.001 *** | 0.254 | < 0.001 *** |
| AL | 0.998 | 0.964 | < 0.001 *** | ||
| SL | < 0.001 *** | < 0.001 *** | 0.075 | ||
| DDFT | AL | < 0.001 *** | 0.095 | < 0.001 *** | |
| SL | < 0.001 *** | < 0.001 *** | 0.646 | ||
| AL | SL | < 0.001 *** | < 0.001 *** | < 0.001 *** | |
| 1B | SDFT | DDFT | < 0.001 *** | < 0.001 *** | 0.165 |
| AL | 0.006 ** | < 0.001 *** | < 0.001 *** | ||
| SL | < 0.001 *** | 0.337 | 0.037 * | ||
| DDFT | AL | < 0.001 *** | 0.012 * | < 0.001 *** | |
| SL | < 0.001 *** | < 0.001 *** | 0.865 | ||
| AL | SL | < 0.001 *** | < 0.001 *** | < 0.001 *** | |
| 2A | SDFT | DDFT | < 0.001 *** | < 0.001 *** | 0.859 |
| AL | < 0.001 *** | < 0.001 *** | < 0.001 *** | ||
| SL | < 0.001 *** | 0.001 ** | 0.178 | ||
| DDFT | AL | < 0.001 *** | < 0.001 *** | < 0.001 *** | |
| SL | < 0.001 *** | < 0.001 *** | 0.564 | ||
| AL | SL | < 0.001 *** | < 0.001 *** | < 0.001 *** | |
| 2B | SDFT | DDFT | < 0.001 *** | < 0.001 *** | 0.991 |
| AL | < 0.001 *** | < 0.001 *** | < 0.001 *** | ||
| SL | < 0.001 *** | < 0.001 *** | 0.697 | ||
| DDFT | AL | < 0.001 *** | < 0.001 *** | < 0.001 *** | |
| SL | < 0.001 *** | < 0.001 *** | 0.845 | ||
| AL | SL | < 0.001 *** | < 0.001 *** | < 0.001 *** | |
| 3A | SDFT | DDFT | < 0.001 *** | < 0.001 *** | 0.32 |
| St=Structure; SDFT: Superficial digital flexor tendon, DDFT: Deep digital flexor tendon, AL: Accesory ligament, SL: Suspensory ligament; CS=Compared structure; CSA: Cross sectional area, LM:latero medial width, DP: dorso palmar width. *=p< 0.05, **=p<0.01, ***=p<0.001. | |||||
Differences were found in the values of the same structure according to the area, the differences in the values of the tendons and ligaments between the different areas, as can be seen in table 3.
| St | Zone | CZ | CSA | LM | DP |
| SDFT | 1A | 1B | 0.230 | 0.100 | 0.999 |
| 2ª | 0.943 | <0.001*** | 1.000 | ||
| 2B | 0.196 | <0.001*** | 0.831 | ||
| 3ª | <0.001*** | <0.001*** | 0.009** | ||
| 1B | 2ª | 0.673 | 0.003** | 0.998 | |
| 2B | <0.001*** | <0.001*** | 0.712 | ||
| 3ª | <0.001*** | <0.001*** | 0.004** | ||
| 2A | 2B | 0.031 | < 0.001 *** | 0.854 | |
| 3ª | <0.001*** | <0.001*** | 0.010* | ||
| 2B | 3ª | 0.001** | <0.001*** | 0.162 | |
| DDFT | 1A | 1B | <0.001*** | <0.001*** | 0.030 * |
| 2ª | <0.001*** | <0.001*** | 0.001** | ||
| 2B | <0.001*** | 0.025* | 0.262 | ||
| 3ª | <0.001*** | <0.001*** | <0.001 | ||
| 1B | 2ª | 0.084 | 0.316 | 0.881 | |
| 2B | 0.999 | 0.006 ** | 0.895 | ||
| 3ª | <0.001*** | <0.001*** | <0.001 | ||
| 2A | 2B | 0.061 | <0.001*** | 0.349 | |
| 3ª | <0.001*** | <0.001*** | <0.001 | ||
| 2B | 3ª | <0.001*** | <0.001*** | <0.001 | |
| AL | 1A | 1B | <0.001*** | <0.001*** | 0.377 |
| 2ª | <0.001*** | <0.001*** | 0.035* | ||
| 2B | <0.001*** | <0.001*** | 0.001** | ||
| 1B | 2ª | 0.008** | 0.005** | 0.686 | |
| 2B | <0.001*** | 0.098 | 0.147 | ||
| 2A | 2B | 0.003** | 0.747 | 0.738 | |
| SL | 1A | 1B | 0.731 | 0.486 | 1.000 |
| 2ª | 0.813 | 0.090 | 0.999 | ||
| 2B | 0.005** | 0.839 | 0.818 | ||
| 1B | 2ª | 0.998 | 0.792 | 1.000 | |
| 2B | <0.001*** | 0.112 | 0.760 | ||
| 2A | 2B | <0.001*** | 0.009** | 0.749 | |
| St=Structure; CZ= Compared zone; SDFT=Superficial digital flexor tendon, DDFT: Deep digital flexor tendon, AL: Accesory ligament, SL: Suspensory ligament; CSA: Cross sectional area, LM:latero medial width, DP: dorso palmar width. *= p< 0.05, **= p<0.01, ***= p<0.001. | |||||
When analyzing DP, it was found that DDFT was the structure with the highest values in the most proximal areas (1A, 1B and 2A), followed by SL and SDFT. Similarly, in the distal areas, the structures with the highest values were the branches of the suspensory ligament and it is worth mentioning that it was the highest DP value of all the regions (1 cm on average).
Confidence intervals. When determining that the only factor that significantly influenced the size of the palmar metacarpal tendons and ligaments of the 30 CCC was the area, table 4 shows the reference ranges as 95% confidence intervals for each measurement (CSA, LM and DP) of each structure in the different areas.
| Zone | Left forelimb | Rigth forelimb | |||||
| CSA | LM | DP | CSA | LM | DP | ||
| SDFT | 1A | 0.484 –0.550 | 1.020 –1.090 | 0.492 –0.545 | 0.475 –0.539 | 1.000 –1.080 | 0.484 -0.539 |
| 1B | 0.469 –0.519 | 1.090 –1.160 | 0.409 –0.455 | 0.439 –0.494 | 1.050 –1.130 | 0.411 –0.442 | |
| 2A | 0.470 –0.537 | 1.140 –1.230 | 0.357 –0.398 | 0.466 –0.532 | 1.150 –1.250 | 0.351 –0.392 | |
| 2B | 0.522 – 0.591 | 1.290 –1.380 | 0.342 –0.387 | 0.503 –0.569 | 1.290 –1.400 | 0.325 –0.357 | |
| 3A | 0.571 -0.634 | 1.630 –1.750 | 0.279 –0.306 | 0.574 - 0.644 | 1.580 –1.740 | 0.279 –0.313 | |
| DDFT | 1A | 0.724 -0.815 | 1.050 –1.130 | 0.706 –0.759 | 0.716 –0.796 | 1.040 –1.120 | 0.700 –0.765 |
| 1B | 0.586 -0.648 | 0.917 –0.977 | 0.695 –0.741 | 0.610 –0.674 | 0.937 –0.978 | 0.696 –0.753 | |
| 2A | 0.556 –0.595 | 0.876 –0.932 | 0.678 –0.725 | 0.567 –0.618 | 0.887 –0.948 | 0.700 –0.756 | |
| 2B | 0.594 –0.658 | 0.980 –1.060 | 0.663 –0.714 | 0.598 –0.678 | 0.977 –1.070 | 0.675 –0.727 | |
| 3A | 0.883 –0.967 | 1.270 –1.370 | 0.763 –0.822 | 0.905 –1.010 | 1.200 –1.340 | 0.799 –0.867 | |
| AL | 1A | 0.493 –0.576 | 1.010 –1.100 | 0.404 –0.468 | 0.460 –0.537 | 0.977 –1.070 | 0.381 –0.448 |
| 1B | 0.393 –0.454 | 0.844 –0.926 | 0.368 –0.412 | 0.394 –0.463 | 0.849 –0.949 | 0.365 –0.418 | |
| 2A | 0.348 –0.410 | 0.771 –0.865 | 0.340 –0.391 | 0.336 –0.405 | 0.789 –0.867 | 0.322 –0.387 | |
| 2B | 0.304 –0.353 | 0.804 –0.881 | 0.287 –0.320 | 0.286 –0.333 | 0.809 –0.880 | 0.257 –0.297 | |
| SL | 1A | 0.790 -0.890 | 1.130 –1.210 | 0.680 –0.731 | 0.821 –0.921 | 1.130 –1.210 | 0.702 –0.750 |
| 1B | 0.782 –0.869 | 1.100 –1.170 | 0.702 –0.742 | 0.790 –0.879 | 1.100 –1.190 | 0.705 –0.745 | |
| 2A | 0.776 –0.864 | 1.060 –1.150 | 0.697 –0.745 | 0.804 –0.891 | 1.090 –1.180 | 0.711 –0.758 | |
| 2B | 0.889 –1.030 | 1.130 –1.240 | 0.727 –0.833 | 0.860 –0.972 | 1.150 –1.240 | 0.658 –0.775 | |
| MB | 3A | 0.582 –0.679 | 0.610 –0.667 | 0.965 –1.060 | 0.582 –0.678 | 0.596 –0.646 | 0.983 –1.070 |
| LB | 3A | 0.592 –0.711 | 0.613 –0.676 | 0.984 –1.070 | 0.629 –0.696 | 0.636 –0.673 | 1.010 –1.070 |
| SDFT=Superficial digital flexor tendon, DDFT: Deep digital flexor tendon, AL: Accesory ligament, SL: Suspensory ligament; CSA: Cross sectional area, LM:latero medial width, DP: dorso palmar width; MB: Medial branch of the suspensory ligamet, LB: Lateral branch of the suspensory ligament | |||||||
DISCUSSION
In Icelandic horses, Boehart et al (7) reported that the suspensory ligament showed the highest values for the transverse area in the first three zones, followed by the deep digital flexor tendon accompanied by its accessory ligament and finally the superficial digital flexor tendon. In the Colombian creole horses in this study, the behavior of this measure was similar; the suspensory ligament was the structure with the largest area in these zones, followed by the DDFT, but in this case the SDFT obtained higher values than the accessory ligament of the DDFT.
Kasashima et al (14) reported that there is no significant difference in the TFDS cross-sectional area between the left and right forelimb in PSI foals growing under an exercise regimen as well as those that were not exercising. This agrees with what was found in the present study, where there was no difference between both members for said structure.
Avella et al (15) in national race horses reported that there was a significant difference (p=0.007), when comparing the cross-sectional area of the SDFT of region 2B between Stallions and mares, with mares being 8 mm. less than stallions, this agrees with what was found in the present study since in these animals there was also a significant difference between stallions and mares.
There are various factors that could influence this result such as the length of the pastern, the conformation of the hooves due to the stress that this can produce in the flexor tendons or even the difference between the intensity of training between stallions and mares, however, it is a point to investigate further.
It was reported in Haflingert mares (6) that according to age there were some significant differences in the values studied, as in the case of the DP of zone 1B and 3B of the superficial digital flexor tendon, mainly, where this measurement was significantly higher in animals younger than 7 years, and in the same way greater in the case of the deep digital flexor in animals older than 7 years. The AL DDFT LM had higher values in zone 1B of animals younger than 7 years. This differs from the CCC, where there was no significant difference for the variables in relation to age.
Celimli et al (11) reported that the area of the superficial digital flexor tendon in zone 1A is 0.62 cm. for Arabian horses, this value being greater than that found in Colombian creole horses (0.51 cm.). In the same zone, Smith et al (4) reported that this value is 1.28 cm., being more than double that found in the CCC. In most of the rest of the evaluated areas, it was observed that this relationship between the measurements of the structures for these races is conserved. Thus, here is born the importance of knowing the proper values of each structure. Finally, it can be affirmed that said values are specific to each race.
Studies evaluating the relationship between tendon size and body mass index are scarce in the literature, however, Boehart et al (6), in haflingert mares reported that there is a significant difference between the SDFT LM in the Zone 1A (p=0.04) and 1B (p=0.04) according to BMI, being higher in animals with a BMI equal to or less than 186.99 kg / m.. Similarly, for the DDFT in zone 1B where it was found that there was a significant difference p=0.032 for the LM, being greater in animals with a BMI less than or equal to 186.99 kg/m.. This differs from the animals in the present study where no difference was found when CSA, DP and LM were compared between the groups formed according to BMI, which means that the influence of this variable on morphometric measurements of tendons and ligaments Palmar metacarpals vary Between breed and could be justified in that a leaner animal will surely exert different biomechanical stress on a structure compared to a more fatty animal.
In Icelandic horses and haflingert mares, Boehart et al (6,7) reported that, as found in the CCCs of this study, there was a significant difference between the values of the same tendon or ligament between the different areas. This is to be expected due to the great changes that the structures undergo throughout their route. Therefore, it is necessary to clarify that the measurement of a structure in the different areas does not have the same diagnostic value and obligatorily, all the structures must be fully evaluated in the different areas of the palmar metacarpal region taking into account their anatomical and histological characteristics for the interpretation of the ultrasound image.
In conclusion, the suspensory ligament and the DDFT were the largest structures in the proximal areas as well as in the distal areas. There is no significant difference between members and no relationship was found between BMI and morphometric measurements for these structures. In each region the values vary according to their anatomical path and it is important to consider the area and structure that is being evaluated in order to make a correct interpretation. These values are of great importance in the practice of veterinary medicine since they are specific measures of the CCC and will allow a better development of veterinary practice in this breed.
Conflict of interests
The authors declare that there are no conflicts of interest in this publication.
Acknowledgements
The authors thank the University of Córdoba and the different hatcheries. Additionally, the first author thanks the veterinary Mateo Velásquez, Juan Pablo Martínez and Iván Avalos for their professional contributions.
REFERENCES
1. Rantanen NW. The use of diagnostic ultrasound in limb disorders of the horse: a preliminary report. J Equine Vet Sci. 1982; 2(2):62–64. https://doi.org/10.1016/S0737-0806(82)80021-X
2. Agut A, Martinez M, Sanchez A, Soler M, Rodriguez M. Ultrasonographic characteristics (cross-sectional area and relative echogenicity) of the digital flexor tendons and ligaments of the metacarpal region in Purebred Spanish horses. Vet J. 2009; 180(3):377–383. https://doi.org/10.1016/j.tvjl.2008.01.012
3. Van schie H, Bakker E, Jonker M, Van weeren P. Ultrasonographic tissue characterization of equine superficial digital flexor tendons by means of gray level statistics. AJVR. 2000; 61(2):210-219. https://doi.org/10.2460/ajvr.2000.61.210
4. Smith R, Jones R, Webbon P. The cross-sectional areas of normal equine digital flexortendons determined ultrasonog raphicaly. Equine Vet J. 1994; 26(6):460-465.https://doi.org/10.1111/j.2042-3306.1994.tb04050.x
5. Cuesta I, Riber C, Pinedo M, Gata J, Castejon F. Ultrasonographic measurement of palmar metacarpal tendon and ligament structures in the horse. Vet Radiol Ultrasound. 1995; 36(2):131-136. https://doi.org/10.1111/j.1740-8261.1995.tb00232.x
6. Boehart S, Arndt G, Carstanjen B. Ultrasonographic morphometric measurements of digital flexor tendons and ligaments of the palmar metacarpal region in haflinger horses. Anat. Histol. Embryol. 2010; 39(4):366–375. https://doi.org/10.1111/j.1439-0264.2010.01003.x
7. Boehart S, Arndt G, Rindermann G, Gmachl M, Carstanjen B. Assessment of ultrasonographic morphometric measurements of digital flexor tendons and ligaments of the palmar metacarpal region in Icelandic Horses. AJVR. 2010; 71(12):1425-1431. https://doi.org/10.2460/ajvr.71.12.1425
8. Cardona J, Reyes B, Martínez M. Cronometría dentaria en equinos. Primera edición. Fondo editorial Universidad de Córdoba. 2019. https://repositorio.unicordoba.edu.co/handle/ucordoba/2204
9. Docking S, Daffy J, Van Schie H, Cook J. Tendon structure changes after maximal exercise in the Thoroughbred horse: Use of ultrasound tissue characterization to detect in vivo tendon response. Vet J. 2012; 194(3):339-342. https://doi.org/10.1016/j.tvjl.2012.04.024
10. Cardona J, Reyes B, Martínez M. Semiología y propedéutica clínica del aparato locomotor en grandes animales. Primera edición. Fondo editorial Universidad de Córdoba: Colombia; 2019. https://repositorio.unicordoba.edu.co/handle/ucordoba/2203
11. Çelimli N, Seyrek D, Kaya M. Morphometric measurements of flexor tendons and ligaments in Arabian horses by ultrasonographic examination and comparison with other breeds. Equine Vet Educ. 2004; 16(2):81-85. https://doi.org/10.1111/j.2042-3292.2004.tb00271.x
12. Pickersgill C, Marr C, Reid S. Repeatability of diagnostic ultrasonography in the assessment of the equine superficial digital flexor tendon. Equine Vet J. 2001; 33(1):33-37. https://doi.org/10.2746/042516401776767494
13. Whitcomb M. Ultrasonographic evaluation of the distal extremity. J. Equine Vet.Scie. 2009; 29(1):47-59. http://dx.doi.org/10.1016/j.jevs.2008.11.010
14. Kasashima Y, Smith R, Birch H, Takahashi T, Kusano K, Goodship A. Exercise-induced tendon hypertrophy: cross-sectional area changes during growth are influenced by exercise. Equine Vet. J. 2002; 34(S34):264-268. https://doi.org/10.1111/j.2042-3306.2002.tb05430.x
15. Avella C, Ely E, Verheyen K, Price J, Wood J, Smith R. Ultrasonographic assessment of the superficial digital flexor tendons of National Hunt racehorses in training over two racing seasons. Equine Vet J. 2009; 41(5):449-454. https://doi.org/10.2746/042516409x3910
Additional information
How to cite (Vancouver).: Reyes-Bossa B, Medina-Ríos H, Cardona-Álvarez JA. Evaluation of morphometric measures of tendons and metacarpal ligaments by ultrasonography in Colombian creole horses. Rev MVZ Cordoba. 2020; 25(2):e1863. https://doi.org/10.21897/rmvz.1863