Article
Use of Generative Adversarial Network Algorithm in Super-Resolution Images to Increase the Quality of Digital Elevation Models Based on ALOS PALSAR Data
Uso de Algoritmo de Rede Adversarial Generativa em Super-Resolução de Imagens para o Aumento da Qualidade de Modelos Digitais de Elevação Baseados em Dados ALOS PALSAR
 Leonardo Assumpção Moreira Leonardoamoreira@gmail.com
Livia Moreira Poelking livia.poelking@gmail.com
Alan José Salomão Graça alan.salomao@eng.uerj.br
Hideo Araki haraki@ufpr.br
Leonardo Assumpção Moreira Leonardoamoreira@gmail.com
Livia Moreira Poelking livia.poelking@gmail.com
Alan José Salomão Graça alan.salomao@eng.uerj.br
Hideo Araki haraki@ufpr.br
Use of Generative Adversarial Network Algorithm in Super-Resolution Images to Increase the Quality of Digital Elevation Models Based on ALOS PALSAR Data
Anuário do Instituto de Geociências, vol. 46, 55296, 2023
Universidade Federal do Rio de Janeiro
Received: 31 October 2022
Accepted: 04 February 2023
Abstract: Digital elevation models are responsible for providing altimetric information on a surface to be mapped. While global models of low and medium spatial resolution are available open source by several space agencies, the high-resolution ones, which are utilized in scales 1:25,000 and larger, are scarce and expensive. Here we address this limitation by the utilization of deep learning algorithms coupled with Single Image Super-Resolution techniques in digital elevation models to obtain better spatial quality versions from lower resolution inputs. The development of a GAN-based (Generative Adversarial Network-based) methodology enables the improvement of the initial spatial resolution of low-resolution images. In the geospatial data context, for example, these algorithms can be used with digital elevation models and satellite images. The methodological approach uses a dataset with digital elevation models SRTM (Shuttle Radar Topography Mission) (30 meters of spatial resolution) and ALOS PALSAR (12.5 meters of spatial resolution), created with the objective of allowing the study to be carried out, promoting the emergence of new research groups in the area as well as enabling the comparison between the results obtained. It has been found that by increasing the number of iterations the performance of the generated model was improved and the quality of the generated image increased. Furthermore, the visual analysis of the generated image against the high- and low-resolution ones showed a great similarity between the first two.
Keywords: Deep learning, Neural networks, Digital image processing.
Resumo: Os modelos digitais de elevação são responsáveis por fornecer informações altimétricas sobre uma superfície a ser mapeada. Enquanto modelos globais de baixa e média resolução espacial estão disponíveis em código aberto por diversas agências espaciais, os de alta resolução, que são utilizados em escalas 1:25.000 e maiores, são escassos e onerosos. Neste trabalho, foi abordada essa limitação pela utilização de algoritmos de aprendizado profundo acoplados a técnicas de Super-Resolução de Imagem Única em modelos digitais de elevação para obter versões de melhor qualidade espacial a partir de entradas de resolução mais baixa. O desenvolvimento de uma metodologia baseada em GAN (Generative Adversarial Network) permite melhorar a resolução espacial inicial de imagens de baixa resolução. No contexto de dados geoespaciais, por exemplo, esses algoritmos podem ser usados com modelos digitais de elevação e imagens de satélite. A abordagem metodológica utiliza um conjunto de dados com modelos digitais de elevação SRTM (Shuttle Radar Topography Mission) (30 metros de resolução espacial) e ALOS PALSAR (12,5 metros de resolução espacial), criados com o objetivo de permitir a realização do estudo, promovendo o surgimento de novas pesquisas na área, além de possibilitar a comparação entre os resultados obtidos. Verificou-se que ao aumentar o número de iterações o desempenho do modelo gerado foi melhorado e a qualidade da imagem gerada aumentou. Além disso, a análise visual da imagem gerada contra as de alta e baixa resolução mostrou uma grande semelhança entre as duas primeiras.
Palavras-chave: Deep learning, Neural networks, Digital image processing.
1 Introduction
Society's search for access to geospatial data is increasing. Such data is used to carry out different activities, whether professional, recreational or leisure. The emergence and development of new technologies and methodologies make it possible for professionals in the field of geosciences to meet this growing demand. Considering factors associated with the cost and limitations of devices aimed at acquiring spatial data, Super Resolution (SR) techniques are a viable alternative to increase the resolution and improve the psychovisual quality of the images (Azarang & Kehtarnavaz 2021; Rézio, Schwartz & Pedrini 2011).
Essentially, it starts from the premise that the quality of the resulting image will be superior to their source image, such a technique is called super-resolution (Azarang & Kehtarnavaz 2021). It is based on the idea that Low Resolution (LR) images of a given scene can generate a High Resolution (HR) image. In this way, it tries to reconstruct the image of the original scene with high resolution, given a set of images observed in lower resolution (Capel & Zisserman 2003). The SR aims to improve the resolution of an image and increase its spatial resolution by increasing its number of pixels and seeking to reduce the occurrence of effects due to the acquisition itself, such as details loss, quality loss, lack of sharpness, occurrence of smudges, among others.
According to Capel and Zisserman (2003), Telles Junior (2008), Yang et al. (2015) and Ma et al. (2017) in super-resolution techniques, one or more low spatial resolution images of the same scene may be combined in order to produce one or several high spatial resolution images. The LR and HR images represent the same area but have differences between them, which can be characterized by: different acquisition dates, different projections, small variations in spatial resolution and displacements of pixels or subpixels.
In order to make SR viable, a solution regularly sought is the adoption of upscaling techniques, where mathematical interpolation operations, such as bilinear or bicubic, are applied to create a higher spatial resolution version of the original image (Lei, Shi & Zou 2017; Romano, Isidoro & Milanfar 2017; Shao et al. 2019). Such techniques usually present satisfactory results for cases in which the desired resolution increase is up to twice the value of the original image. For increases above the scale value, the results obtained are worse, and often not acceptable for the desired purposes, making it necessary the use of more robust techniques. This work addresses this limitation by applying deep learning techniques, such as algorithms adapted from Enhanced Super-Resolution Generative Adversarial Network (ESRGAN), to achieve such resolution improvements (Wang et al. 2018; Wu & Ma 2020).
Single Image Super-Resolution (SISR), as used in the research, is a relevant processing technique in the field of computer vision and it presents itself as a methodological alternative to the more usual SR processes, which combine images obtained in subpixel misalignments or those based on learning correspondences between patches of high-resolution images from a database (Glasner, Bagon & Irani 2009). Currently, concepts of Artificial Intelligence (AI) and Deep Learning (DL) integrate the state of the art of methodologies addressing SR images challenges.
A number of academic works in the scientific literature address multiple aspects of the techniques used in the achievement of Digital Surface Models (DSM) and Digital Terrain Models (DTM), with regard to obtaining altitudes above the Earth's surface for the construction of topographical and thematic maps (Li et al. 2022; Wilson 2012; Galin et al. 2019; Li, Zhu & Gold 2004). Such applications are widely used in different spheres of science, such as geodesy, photogrammetry, remote sensing, cartography, hydrology, topography, among others.
Among these fields of action, the following activities can be cited as an example: monitoring of structural deformations; the integration of satellite images and auxiliary data for the delimitation of physiognomic and geological units; digital processing of satellite images for monitoring natural resources; numerical modeling of terrain on bases; gravitational anomaly prediction; the transformation between geodetic reference systems, among others (Wilson 2012; Galin et al. 2019; Li, Zhu & Gold 2004).
Several studies have demonstrated that using high resolution DTM as inputs it is possible to build more accurate flood maps compared to low resolution DTM. Despite the importance of high resolution DTM, many areas in the United States and the world do not have access to high resolution DTM due to technological limitations or the data collection cost (Demiray, Sit & Demir 2021).
Currently, there are some DEM (Digital Elevation Models) of global or regional scope that provide a number of applications. This work uses data from two sources: the Shuttle Radar Topography Mission (SRTM) and the ALOS data. The SRTM was a mission carried out jointly by the North American Space Agency (NASA), the United States Department of Defense (US DOD), represented by the National Geospatial-Intelligence Agency (NGA), the Space Agency German (Deutsches Zentrum für Luft- und Raumfahrt eV - DLR) and the Italian Space Agency (Agenzia Spaziale Italiana - ASI). In general, the SRTM has an absolute vertical accuracy of about 16 meters for the C band and 6 meters for the X band, the absolute planimetric accuracy is of the order of 20 meters for the C band and 15 meters for the X band, using a 90% confidence level, according to the National Map Accuracy Standard (NMAS) (Farr et al. 2007).
The ALOS satellite was launched on January 24th, 2006 by the Japan Aerospace Exploration Agency (JAXA), and entered the operational and data delivery phase to the public on October 24th, 2006, having completed its operation on May 12th, 2011. On May 24th, 2014, ALOS-2 was launched as a continuation of the ALOS mission, featuring enhanced capabilities for wider observation and high resolution (10 m resolution). Two other missions are under development: ALOS-3 from ALOS-4 (EMBRAPA 2021).
In brief, this research aims to contribute to the academic environment through new approaches to the generation of information from orbital altimetry data, a subject closely related not only to geodesy, but also to several other related areas such as cartography, remote sensing, photogrammetry, among others. Among the benefits to the area of geodetic sciences that the proposed methodology may bring, are the reduction of costs in the production of high spatial resolution DEM as well as the generation of high-resolution DEM for regions where only low spatial resolution models are available.
1.1 Super-Resolution Methods Based on Neural Network
A Generative Adversarial Network (GAN) is a class of machine learning systems invented by Ian Goodfellow in 2014 where two neural networks compete with each other in a game - in the game theory sense, in the form of a zero-sum game (Goodfellow et al. 2014). This technique generates new data with the same statistics as the training set. Training a GAN involves a “generator” and a “discriminator” networks together, where the first network synthesizes realistic images at input, and the second architecture classifies input data as synthetic or real (Azarang & Kehtarnavaz 2021).
Following up the original GAN, the Super-Resolution Generative Adversarial Network (SRGAN) algorithm has been developed. The SRGAN combines deep neural networks with a GAN to learn how to generate upscaled images (Figure 1). During training, a high-resolution image is first downsampled into a lower resolution image and input into a generator. The generator then tries to upsample that image into a super-resolution image. The discriminator is used to compare the generated super-resolution image to the original high-resolution image. The GAN loss from the discriminator is then back propagated into both the discriminator and generator. The discriminator is mainly composed of convolution, batch normalization and parameterized ReLU (PRelU) layers (Ledig et al. 2017).
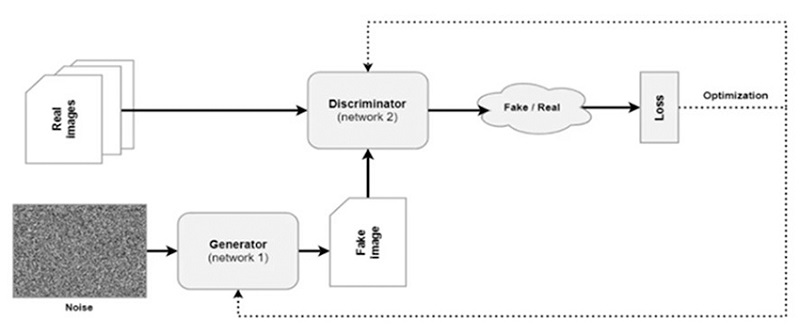
Figure 1
Schematicof a generative adversarial network: Looking back at the original vanilla GAN and its evolution over time (Perera 2021).
Although the SRGAN has stimulated new creations and brought new ideas capable of generating realistic textures during the super-resolution of a single image, undesirable artifacts were often observed. To further improve the visual quality, three main components were added to the SRGAN, namely (i) network architecture, (ii) adversarial loss, and (iii) perceptual loss, to derive an Enhanced Super-Resolution Generative Adversarial Networks (ESRGAN). In addition, two modifications were made to the generator structure: the removal of all Batch Normalization (BN) layers and the replacement of the original basic block with the proposed Residual-in-Residual Dense Block (RRDB), which combines multilevel residual network and dense connections (Wang et al. 2018; Chen et al. 2020).
The idea of relativistic GAN was also introduced to let the discriminator predict the relative realness instead of the absolute value. However, GANs usually take only random noise as input samples, which leads to an ambiguous meaning of the generated results (Li et al. 2022). Unlike the standard discriminator in SRGAN, which estimates the probability that an input image is real and natural, the relativistic discriminator attempts to predict the probability that a real image is relatively more realistic than a fake one (Wang et al. 2018).
Furthermore, ESRGAN presents a more effective loss of perception (L percep) by restricting resources before activation rather than after activation as practiced in SRGAN (Chen et al. 2020). Based on the idea of being closer to the perceptual similarity, the perceptual loss extended to the SRGAN has been proposed. The perceptual loss has been previously defined in the activation layers of a pre-trained deep network, where the distance between two activated features is minimized. Contrary to convention, resources were used before the activation layers, which overcome two disadvantages of the original design (Wang et al. 2018).
Perceptual loss was also improved using the features before activation which provided stronger supervision for gloss consistency and texture recovery. Benefiting from these improvements, the ESRGAN achieved consistently better visual quality with more realistic and natural textures than SRGAN (Wang et al. 2018). ESRGAN is able to generate more detailed structures in construction, while other methods fail to produce sufficient detail (SRGAN) or add unwanted textures (EnhanceNet). Also, earlier GAN-based methods sometimes introduce distortions into the image.
Single Image Super-Resolution has attracted increasing attention in the AI research community. Since the pioneering work of single image Super-Resolution deep Convolutional Neural Network (SRCNN), deep Convolutional Neural Network (CNN) approaches have brought a prosperous development. Various network architecture projects and training strategies have continuously improved super-resolution performance, especially the peak signal-to-noise ratio (PSNR) value. However, these PSNR-driven approaches tend to produce over-smoothed results without sufficient high-frequency detail, as the PSNR metric fundamentally disagrees with the subjective assessment of human observers (Wang et al. 2018).
This work aims to develop an alternative for the generation of a digital elevation model with better spatial resolution using single image super-resolution technique through Generative Adversarial Network. The model proposed here to produce a digital elevation model with super-resolution has been used to obtain super-resolution color photographs (Goodfellow et al. 2014).
2 Methodology and Data
This section describes the methodology used in this work to achieve the results presented. The work proposed here is based in the ESRGAN with modifications described in subsection 3.4 to adapt the algorithm to DEMs. The proposed algorithm is referred to as DEM-ESRGAN. The programming language used in the developments carried out in this work was the Python 3.7 interpreter.
2.1 Synthesis of the Pipeline
In order to synthesize the adopted procedures, a flowchart with the used pipeline has been produced (Figure 2). In the pipeline, the generation of the digital elevation model with the DEM-ESRGAN algorithm is called "data processing". The sub-sections 3.2 to 3.5 describe the elements presented in this flowchart.
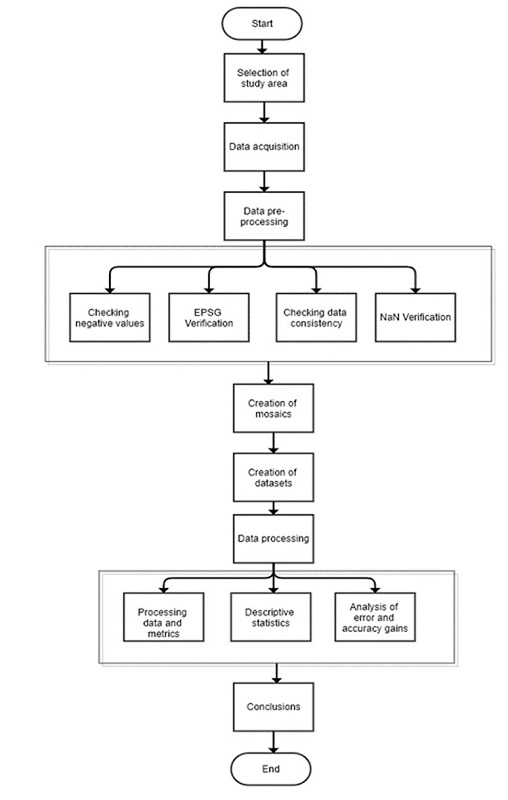
Figure 2
Synthesis flowchart of the pipeline followed in this work.
2.2 Study Area
The selection of the study area for this work follows two-fold criteria: it should not only allow the use of several digital elevation models, but also provide a qualitative evaluation of different types of terrain models. In this context, the study area selected for the present work is the municipality of Monte Castelo in the State of Santa Catarina, Brazil, due to the variations of its relief features. The State of Santa Catarina covers an area of 95,346 km² in the south of Brazil and has recently had its territory mapped at a scale of 1:50,000, producing digital terrain models of 1-meter spatial resolution, available for free to download on the internet, which will be used later in the DEM-ESRGAN algorithm evaluation.
2.3 Data
To carry out this research, the following data has been selected: DEM SRTM of 30 meters (https://earthdata.nasa.gov) and DEM ALOS PALSAR of 12.5 meters. All these selected digital models are available for download and use on the internet and have global coverage.
2.3.1 Dataset
For the accomplishment of the present work, the following dataset has been created: DEM SRTM of 30 meters (as LR images) and DEM ALOS PALSAR of 12.5 meters (as HR images or ground truth), with 50 pairs of training images and 20 pairs of validation images (Figure 3 and 4). The criterion used to partition the 70 image pairs was the proportion of 70% of the samples for training the algorithm and 30% of the samples for its validation. The images used were cropped in the following dimensions: 156 pixels by 156 pixels.
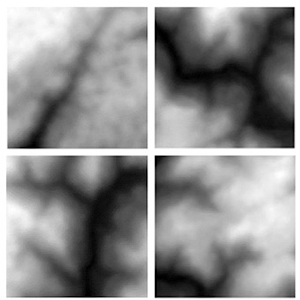
Figure 3
Demonstations of 4 low resolution samples generated for the dataset used to perform the DEM-ERSGAN training.
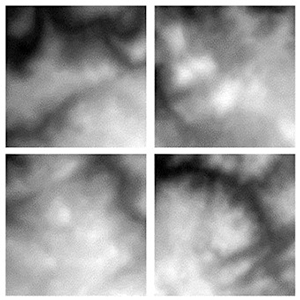
Figure 4
Illustration of 4 low resolution samples generated for the dataset used to perform the DEM-ERSGAN validation.
In relation to the dataset built with samples from DEM SRTM 30 meters and DEM ALOS PALSAR 12.5 meters, considering the region with the respective images selected for their construction, it has been found that using the resampled LR image to calculate the average difference between the LR and HR images, a discrepancy value of 5.6909 meters was obtained and the difference of standard deviation presented is 0.3483 meters.
2.4 Processing with the DEM-ESRGAN Algorithm
The pairs of images generated for the dataset will be used to perform the processing in the DEM-ESRGAN algorithm. The DEM-ESRGAN algorithm has been developed adapting the ESRGAN algorithm by changing the inputs and outputs. ESRGAN uses files with extension .PNG colored images with 3 bands (RGB) as input and output. To run files with altimetric information, it was necessary to change the input and output to .TIF images with only 1 band. Another necessary modification was the image scaling (spatial and radiometric resolution), so that the DEM-ESRGAN algorithm could receive different combinations of digital models.
The ESRGAN algorithm offers the possibility to upscale the image by 2x, 4x or 8x. In order to adapt the ESRGAN into DEM-ESRGAN, the scaling factor had to be defined. Thus, a scaling factor of 4x between low- and high-resolution images has been set for the DEM-ESRGAN.
2.5 Evaluation Metrics
The measures used to perform quality control of the results from the experiments here reported are: Peak Signal-to-Noise Ratio (PSNR), Structural Similarity Index Measure (SSIM), Mean Squared Error (MSE), Naturalness Image Quality Evaluator (NIQE), and Root Mean Squared Error (RMSE).
The PSNR is a measure defined as the ratio between the maximum energy of a signal and the noise that affects its faithful representation (SCIKIT-IMAGE 2022. A higher PSNR means smaller noise and because of that, it generally indicates that the reconstruction is of higher quality.
The SSIM is a metric used to measure the similarity between two images. The resulting SSIM index is a decimal value between -1 and 1, with a value of 1 occurring only when the two data sets are identical and therefore indicating perfect structural similarity (IMATEST 2022; SCIKIT-IMAGE 2022).
The NIQE is an image quality score. It compares a given image to a standard model calculated from images of natural scenes, where a lower score obtained indicates better perceptual quality (GITHUB 2022).
The MSE is a measure of the quality of a given estimator. The MSE values of two statistical models can be used to measure how well they explain a given set of observations. The value of MSE is always positive or greater than zero. A value close to zero represents a better quality of the regression model. In the absence of noise, the MSE is zero. The RMSE is the square root of the MSE and allows the results of the metric to be analyzed in the same dimension as the data (SCIKIT-IMAGE 2022).
2.6 Evaluation of the Generated Products
To carry out the evaluation of the generated products, different analyzes were carried out, such as: analysis of automatically generated contour lines, altimetry cartographic pattern analysis, visual evaluation of drainage networks, critical points evaluation, DEMs slope evaluation, DEMs aspect evaluation and visualization of the generated DEMs together with the high and low resolution DEMs.
2.7 Hardware Resources
To perform the DEM-ESRGAN runs, the following hardware equipment has been used (not required) (Table 1):

3 Results
3.1 Processing Runs
In this work, three processing runs were performed with a variation in the number of iterations among them. The first run was performed with 10,000 iterations and is referred to as Run 1. The second run has 50,000 iterations and is referred to as Run 2. And the third run has 100,000 iterations and is referred to as Run 3. Such conformation of runs has been selected so that it is possible to observe the behavior of the algorithm in relation to the parameter iteration number, as well as to understand the model in the variation of the results of each run.
The 50 training sets are used to define the model parameters as well as to perform in-sample analysis of the models generated in each run. The 15 validation sets are used to perform the Peak Signal to Noise Ratio (PSNR) metric calculations of the runs and to perform the losses calculations. The method used to partition the dataset in this work is the Holdout Method, considering p = 70%.
For the analysis of the processing metrics, it has been found that the implementation of five different metrics for evaluating the generated images added greater analysis power to the research. It is noteworthy that among the metrics used, the first two (PSNR and SSIM) are directly proportional values, while the last three (NIQE, MSE and RMSE) are inversely proportional values.
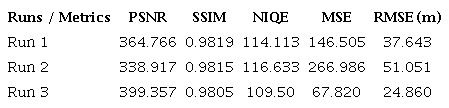
At the end of the runs with the validation dataset, the values of the PSNR metrics were calculated leading to a PSNR of 48.779 for the Run 1, a PSNR of 49.172 for the Run 2, and a PSNR of 51.511 for the Run 3. So that the PSNR decreases with an increasing number of iterations, and the Run 3 with 10,000 iterations performed best, with the highest PSNR value. Nevertheless, if one follows the PSNR as the iterations progress, one observes an oscillatory variation of the PSNR values, thus not occurring a continuous growth or decline over time.
3.2 Quantitative Evaluation
The images generated by the Run 3 are superior in practically all the metrics used in the evaluation, with the exception of SSIM (Table 2).
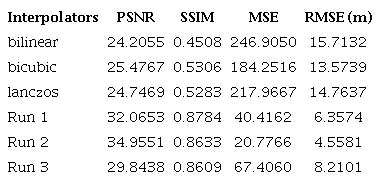
To enable the comparison of the DEM-ESRGAN algorithm with other typical interpolation methods, and to verify how each scores in this problem, a benchmark was carried out with such methods, making it possible to obtain results from different metrics (PSNR, SSIM, MSE and RMSE) (Table 3). The DEM-ESRGAN algorithm with 100,000 epochs (Run 3) showed the best result among all other typical interpolation methods used in this evaluation.
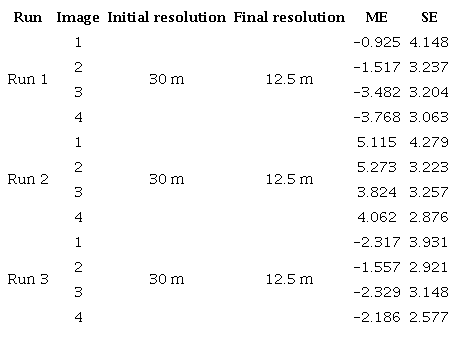
The altimetric positional accuracy assessment is based on the analysis of residuals between the coordinates taken from a cartographic product and their counterparts observed in another product. To perform the Altimetric Cartographic Accuracy Pattern analysis, a matrix of difference of pixels of each pair of images, ground truth and generated, is used. The Mean Error (ME) and the Standard Error (SE) are then calculated, in order to verify the appropriate scales to be used by the evaluated product (Table 4).
3.3 Visual Evaluation
Figure 5 presents the structural lines results (drainage channels) in the high resolution DEMs and in the DEMs generated by the processing under analysis. Firstly, it can be seen that Run 3 can get the best matching rate of drainage channel characteristics. So, Run 3 outperforms Run 1 and Run 2 in preserving the characteristics of drainage channels. This result can be verified by comparing the similarities found between the processing lines and the true ground drainage lines.
One may notice that in the second image of Run 1 as well as in the third image of Runs 1, 2 and 3, there is a difference in the thickness of the drainage channels in relation to the high-resolution image, with lower points generating longer channels.
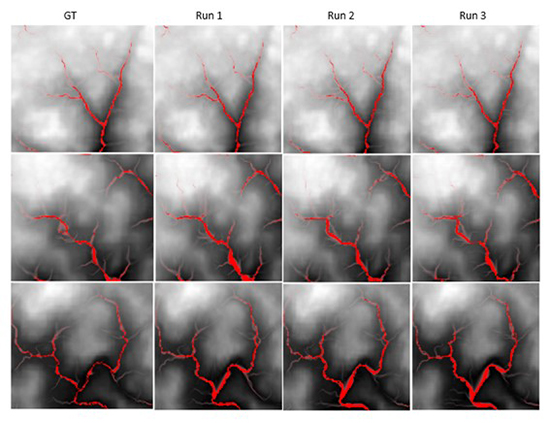
Figure 5
DEMs containing the drainage channels results for the images generated by the Runs 1, 2 and 3 in comparison to the high-resolution images. GT: Ground Truth.
In the present section, an investigation was carried out regarding the effectiveness of the methods used in the critical points recovery. From previous evaluations, it can be observed that the DEM-ERSGAN algorithm generates better results in relation to the generation of SR than the other methods. Thus, this evaluation focuses only on the ground truth results and on the interpolations of the Runs 1, 2 and 3.
Figure 6 presents a set of images of the pixels visual analysis containing maximum and minimum altitudes of high-resolution images versus the images generated by Runs 1, 2 and 3, where the maximum altitude pixels are represented by the color red and the pixels of minimum altitude are represented by the color blue. Such pixels represent critical points for the DEMs generated by the method used in the present work.
As for the preservation of the critical points (Figure 6), no obvious rules were observed in the three runs. In this sense, the statistical results can be the best approach to evaluate the critical points preservation, and the main conclusions can be obtained from a metrics analysis obtained from the respective images. Therefore, to summarize, in this regard, the Run 3 outperforms the other runs in preserving most of the terrain features in the DEM super-resolution.
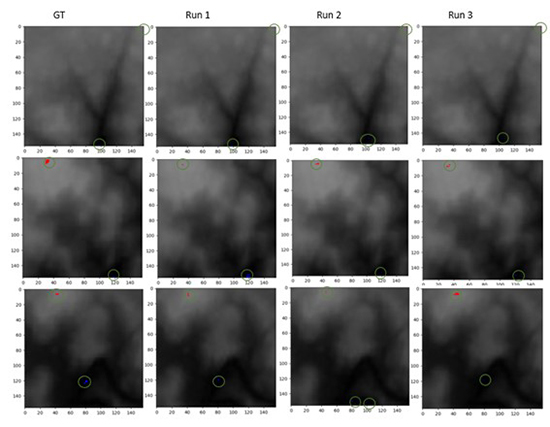
Figure 6
High resolution DEMs versus the generated DEMS for Runs 1, 2 and 3 with the validation set of dataset 3 containing their respective maximum and minimum altitudes. The minimum altitude pixels are in blue and the maximum altitude in red. The values indicate altitude in meters. GT: Ground Truth.
Figure 7 presents the terrain slope results of the original high resolution DEMs and the DEMs generated by Runs 1, 2 and 3. Considering the terrain slope assessment, the intuitive perception is that the results of Run 3 are much smoother than those of Runs 1 and 2, and some textures are more reinforced in the Run 1 interpolation results, but are retained in Runs 2 and 3.
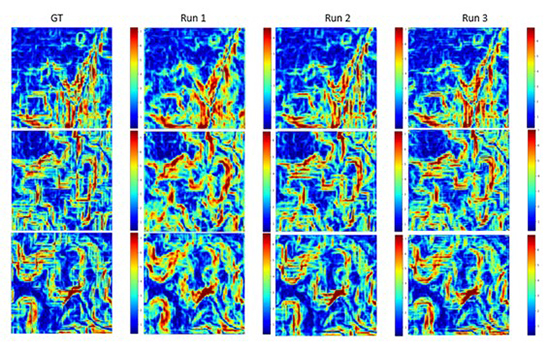
Figure 7
DEMs containing the terrain slope results of the high-resolution images versus the images generated by Runs 1, 2 and 3. Slope values are in percentage. GT: Ground Truth.
Figure 8 presents the appearance results of the original high resolution DEMs versus the DEMs generated by Runs 1, 2 and 3. As for the aspect, intuitively, it appears that the distortions in the results of Run 1 are greater compared to the results of Runs 2 and 3. However, the terrain slope results from Run 3 show a better balance between global accuracy and local features, which may be the reason why Run 3 outperforms the other methods. So, considering the aspect evaluation, the three processes generate comparable results, and such a conclusion is consistent with the statistical evaluations.
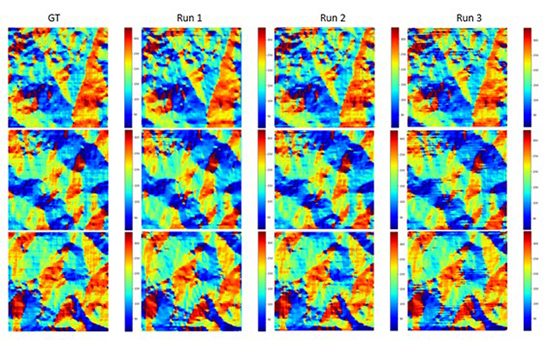
Figure 8
DEMs containing the appearance results of the high-resolution images versus the images generated by Runs 1, 2 and 3. nits are in degrees. GT: Ground Truth.
4 Conclusions
The present work sought to create datasets for the effective insertion of digital elevation models in image super-resolution studies, to create learning machines using Generative Adversarial Network in order to obtain an increase in spatial resolution of such models, and to generate new models from the learning machines. In addition, it presented an analysis of the increased spatial resolution effectively obtained in the experiments performed, verifying the potential of using digital elevation models generated using the Generative Adversarial Network algorithm in cartographic production for altimetric data extraction.
Considering the analysis and statistical comparisons presented in this work, it has been found that increasing the number of iterations is favorable to the performance of the generated model and to the quality of the generated image. This indicates that the proposed methodology is constructive and fulfills the SISR task by generating a high-resolution DEM image departing from a single low resolution DEM image.
The only indicator which does not corroborate this tendency was the PSNR for the validation dataset, where the run with fewer iterations had a higher PSNR value than the runs with more iterations. Even though, an oscillatory variation for the PSNR over time has been observed, this conflicting result may also be an indication that, despite the PSNR being the scoring metrics in the GAN algorithm, the PSNR alone may not be a sufficient quality indicator, justifying the search for alternatives to the traditional PSNR-driven approaches.
Also, the DEM-ESRGAN showed a substantial improvement in the quality metrics compared to the traditional interpolation methods in the benchmark. Hence the development of super-resolution digital elevation models is timely, given the technological advances in the areas of artificial intelligence, orbital sensors, and computational resources. In this context, future research is planned to further the investigations presented here, including studies with DEMs of different spatial resolutions.
From the visual analysis of the generated images, low resolution images and high-resolution images used in this work, it is noticeable the great similarity between the generated images and their respective high-resolution images.
Finally, it is believed that the concepts and methodology presented here made it possible to explore the use of geospatial data in artificial intelligence environments with image super-resolution techniques, contributing to the advancement of the discussion on the subject. In the computational field, the methodological innovations presented here are original in the field of geodetic sciences and present solutions that can be used by specialists in the areas of photogrammetry, remote sensing, cartography, geodesy, with the possibility of extension to other different contexts.
5 References
Azarang, A. & Kehtarnavaz, N. 2021, Image Fusion in Remote Sensing: Conventional and Deep Learning Approaches, Morgan & Claypool Publishers, Austin.
Capel, D. & Zisserman, A. 2003, 'Computer vision applied to super resolution', IEEE Signal Processing Magazine, vol. 20, no. 3, pp. 75-86, DOI:10.1109/MSP.2003.1203211.
Chen, Y., Zhao, Y., Jia, W., Cao, L. & Liu, X. 2020, 'Adversarial-learning-based image-to-image transformation: A survey', Neurocomputing, vol. 411, pp. 468-86, DOI:10.1016/j.neucom.2020.06.067.
Demiray, B.Z., Sit, M. & Demir, I. 2021, 'D-SRGAN: DEM Super-Resolution with Generative Adversarial Networks', SN Computer Science, vol. 2, pp. 1-11. DOI:10.1007/s42979-020-00442-2.
EMBRAPA Empresa Brasileira de Pesquisa Agropecuária 2021, ALOS - Advanced Land Observing Satellite, viewed 04 Julho 2021, <EMBRAPA Empresa Brasileira de Pesquisa Agropecuária 2021, ALOS - Advanced Land Observing Satellite, viewed 04 Julho 2021, http://www.Embrapa.Br/Satelites-De-Monitoramento/Missoes/Alos >
Farr, T.G., Rosen, P.A., Caro, E., Crippen, R., Duren, R., Hensley, S., Kobrick, M., Paller, M., Rodriguez, E., Roth, L., Seal, D., Shaffer, S., Shimada, J., Umland, J., Werner, M., Oskin, M., Burbank, D. & Alsdorf, D. 2007, 'The Shuttle Radar Topography Mission', Reviews Of Geophysics, vol. 45, no. 2, pp. 1-33, DOI:10.1029/2005RG000183.
Galin, E., Guérin, E., Peytavie, A., Cordonnier, G., Cani, M.P., Benes, B. & Gain, J. 2019, 'A Review of Digital Terrain Modeling', Computer Graphics Forum, vol. 38, no. 2, pp. 553-77, DOI:10.1111/cgf.13657.
GITHUB 2022, GitHub, viewed 4 May 2022, <GITHUB 2022, GitHub, viewed 4 May 2022, https://github.com//>.
Goodfellow, I., Pouget-Abadie, J., Mirza, M., Xu, B., Warde-Farley, D., Ozair, S., Courville, A. & Bengio, Y., 2014, 'Generative Adversarial Nets', in Z. Ghahramani, M. Welling, C. Cortes, N. Lawrence & K.Q. Weinberger, Advances in Neural Information Processing Systems 27 (NIPS 2014), pp. 2672-80.
Glasner, D., Bagon, S. & Irani, M. 2009, 'Super-Resolution from a Single Image', 2009,IEEE12thInternational Conference on Computer Vision, viewed 29 September 02, pp. 349-56, DOI:10.1109/ICCV.2009.5459271.
IMATEST 2022, imatest®, viewed 6 May 2022, <IMATEST 2022, imatest®, viewed 6 May 2022, https://www.imatest.com/>.
Ledig, C., Theis, L., Huszár, F., Caballero, J., Cunningham, A., Acosta, A., Aitken, A., Tejani, A., Totz, J., Wang, Z. & Shi, W. 2017, 'Photo-Realistic Single Image Super-Resolution Using A Generative Adversarial Network', Proceedings of the IEEE Conference on Computer Vision and Pattern Recognition (CVPR 2017), Honolulu , pp. 4681-90, DOI:10.48550/arXiv.1609.04802.
Lei, S., Shi, Z. & Zou, Z. 2017, 'Super-Resolution for Remote Sensing Images Via Local-Global Combined Network',IEEE Geoscience and Remote Sensing Letters, vol. 14, no. 8, pp. 1243-7, DOI:10.1109/LGRS.2017.2704122.
Li, Z., Zhu, Q. & Gold, C. 2004, Digital Terrain Modeling: Principles and Methodology, CRC Press, Boca Raton.
Li, S., Hu, G., Cheng, X., Xiong, L., Tang, G. & Strobl, J., 2022, 'Integrating topographic knowledge into deep learning for the void-filling of digital elevation models', Remote Sensing of Environment, vol. 269, e112818. DOI:10.1016/j.rse.2021.112818.
Ma, C., Yang, C., Yang, X. & Yang, M. 2017, 'Learning a No-Reference Quality Metric for Single-Image Super-Resolution', Computer Vision and Image Understanding, vol. 158, pp. 1-16, DOI: 10.1016/J.Cviu.2016.12.009.
Perera, A.S. 2021, 'Looking back at the original vanilla GAN and its evolution over time', Towards AI, viewed 24 August 2021, < 2021, 'Looking back at the original vanilla GAN and its evolution over time', Towards AI, viewed 24 August 2021, https://pub.towardsai.net/looking-back-at-the-original-vanilla-gan-and-its-evolution-over-time-3d441cedbd05>.
Rézio, A. C. C., Schwartz, W. R. & Pedrini, H. 2011, 'Super-Resolução De Imagens Baseada Em Aprendizado Utilizando Descritores De Características', Anais do X Congresso Brasileiro De Inteligência Computacional (CBIC’2011), Fortaleza, viewed 24 August 2021, < 2011, 'Super-Resolução De Imagens Baseada Em Aprendizado Utilizando Descritores De Características', Anais do X Congresso Brasileiro De Inteligência Computacional (CBIC’2011), Fortaleza, viewed 24 August 2021, https://www.researchgate.net/profile/William-Schwartz-3/publication/303772981_Super-Resolucao_De_Imagens_Baseada_Em_Aprendizado_Utilizando_Descritores_De_Caracteristicas/links/5834752b08ae004f74c8791e/Super-Resolucao-De-Imagens-Baseada-Em-Aprendizado-Utilizando-Descritores-De-Caracteristicas.pdf >.
Romano, Y., Isidoro, J. & Milanfar, P. 2017, 'RAISR: Rapid and Accurate Image Super Resolution',IEEE Transactions on Computational Imaging, vol. 3, no. 1, pp. 110-25, DOI:10.1109/TCI.2016.2629284.
SCIKIT-IMAGE 2022, scikit-image: Image processing in Python, viewed 20 July 2022, <SCIKIT-IMAGE 2022, scikit-image: Image processing in Python, viewed 20 July 2022, https://scikit-image.org/>.
Shao, Z., Wang, L., Wang, Z. & Deng, J. 2019, 'Remote Sensing Image Super-Resolution Using Sparse Representation and Coupled Sparse Autoencoder',IEEE Journal of Selected Topics in Applied Earth Observations and Remote Sensing, vol. 12, no. 8, pp. 2663-74, DOI:10.1109/JSTARS.2019.2925456.
Telles Junior, M.A.B.G. 2008, 'Super-Resolução de Imagens de Sensoriamento Remoto', Tese de Doutorado, Universidade de Brasília.
Yang, D., Li, Z., Xia, Y. & Chen, Z. 2015, 'Remote Sensing Image Super-Resolution: Challenges and Approaches', 2015IEEE International Conference on Digital Signal Processing (DSP), IEEE Singapore, pp. 196-200, DOI:10.1109/ICDSP.2015.7251858.
Wang, X., Yu, K., Wu, S., Gu, J., Liu, Y., Dong, C., Qiao, Y. & Loy, C.C. 2018, 'ESRGAN: Enhanced Super-Resolution Generative Adversarial Networks', Proceedings of the European conference on computer vision (ECCV) workshops, pp. 1-16, viewed 6 May 2022, < 1-16, viewed 6 May 2022, https://openaccess.thecvf.com/content_ECCVW_2018/papers/11133/Wang_ESRGAN_Enhanced_Super-Resolution_Generative_Adversarial_Networks_ECCVW_2018_paper.pdf>.
Wilson, J. P. 2012, 'Digital Terrain Modeling', Geomorphology, vol. 137, no. 1, pp. 107-21, DOI:10.1016/j.geomorph.2011.03.012.
Wu, Z. & Ma, P. 2020, 'ESRGAN-based DEM super-resolution for enhanced slope deformation monitoring in Lantau island of Hong Kong', The International Archives of Photogrammetry, Remote Sensing and Spatial Information Sciences, vol. 43, pp. 351-6, DOI:10.5194/isprs-archives-XLIII-B3-2020-351-2020.
Funding information
Data availability statement
Author notes
E-mail: Leonardoamoreira@gmail.comE-mail:livia.poelking@gmail.comE-mail:alan.salomao@eng.uerj.brE-mail:haraki@ufpr.br
Conflict of interest declaration