Article
Classification of Urban Solid Waste Collected with the Use of Ecobarriers in Watercourses in the Municipality of Caçapava do Sul, RS
Classificação dos Resíduos Sólidos Urbanos Coletados com o Uso de Ecobarreiras em Cursos de Água no Município de Caçapava do Sul, RS
 Pedro Daniel da Cunha Kemerich pedrokemerich@unipampa.edu.br
Gabriel D’Avila Fernandes enggabrielfernandes@gmail.com
Gabriel Forgiarini gabrielforgiarini.aluno@unipampa.edu.br
Leonardo Rosa da Silva leonardorosa.esa@gmail.com
Douglas Bitencourt Vidal bitencourt_douglas@hotmail.com
Pedro Daniel da Cunha Kemerich pedrokemerich@unipampa.edu.br
Gabriel D’Avila Fernandes enggabrielfernandes@gmail.com
Gabriel Forgiarini gabrielforgiarini.aluno@unipampa.edu.br
Leonardo Rosa da Silva leonardorosa.esa@gmail.com
Douglas Bitencourt Vidal bitencourt_douglas@hotmail.com
Classification of Urban Solid Waste Collected with the Use of Ecobarriers in Watercourses in the Municipality of Caçapava do Sul, RS
Anuário do Instituto de Geociências, vol. 46, 53888, 2023
Universidade Federal do Rio de Janeiro
Received: 28 October 2022
Accepted: 07 May 2023
Abstract: Urban solid waste is a serious problem in cities when disposed in inappropriate places or when there is a deficiency in its collection, which can cause several environmental problems. In periods of rain, these problems become more evident when these residues are transported to drainage networks and water courses, accumulating and creating obstacles to the flow, causing floods, floods, etc. In this regard, this work aimed to collect and classify urban solid waste in two water courses in the municipality of Caçapava do Sul, an ecological barrier made with recyclable materials called Ecobarrier, placed across water courses in order to retain floating waste that is transported by water. As a result, the vast majority of residues retained in the eco-barriers correspond to the category of organic matter, this is due to the vegetation around the water bodies studied, followed by the plastic, metal and textile category respectively. Thus, it can be seen that the presence of floating garbage in the water courses of the municipality partially reflects the lack of concern on the part of the population and governments with its effects on human and environmental health. It is in this context, to avoid the generation of floating waste, that the integration of public policies can play a fundamental role, with the help of environmental education.
Keywords: NBR 10004/2004, Recycling, Water Resources.
Resumo: Os resíduos sólidos urbanos são um sério problema nas cidades quando dispostos em lugares inadequados ou quando há deficiência em sua coleta, podendo ocasionar diversos problemas ambientais. Em períodos de chuva, esses problemas se tornam mais evidentes quando esses resíduos são transportados para as redes de drenagem e cursos de água, acumulando-se e gerando obstáculos ao escoamento ocasionando enchentes, inundações etc. A esse respeito, este trabalho teve o objetivo de coletar e classificar os resíduos sólido urbanos em dois cursos de água do Município de Caçapava do Sul uma barreira ecológica feita com materiais recicláveis denominada Ecobarreiras, colocada transversalmente em cursos d’água com a finalidade de reter os resíduos flutuantes que são transportados pela água. Como resultado, a grande maioria dos resíduos retidos nas Ecobarreiras correspondem a categoria de matéria orgânica, isso se deve a vegetação no entorno dos corpos hídricos estudados, seguido da categoria plástico, metal e têxtil respectivamente. Assim percebe-se que a presença do lixo flutuante nos cursos d’água do município reflete, parcialmente, a despreocupação por parte da população e dos governos com seus efeitos na saúde humana e ambiental. É neste contexto, de evitar a geração de lixo flutuante, que a integração de políticas públicas pode exercer um papel fundamental, com auxílio da educação ambiental.
Palavras-chave: NBR 10004/2004, Reciclagem, Recursos Hídricos.
1 Introduction
Faced with urbanization and population growth, the generation of urban solid waste (MSW) has been gradually increasing (Al-Salem et al. 2018). However, a correct final destination for this generated waste is necessary. Improper disposal of solid waste in water bodies is a growing concern around the world, especially due to the negative effects that this practice can have on aquatic ecosystems and the sea. The pollution of rivers by urban solid waste, mainly plastic, can affect marine fauna, cause damage to fishing and tourism and contribute to the worsening of the global environmental crisis. According to research carried out by Santos et al. (2018), the gravimetric composition of solid urban waste collected by floating ecobarriers on the Tucunduba River, in Belém, showed that plastic was the material most present in the waste, representing 58% of the total collected, which is one of the main types of waste. waste reaching the sea.
The impact of waste thrown into rivers on sea pollution is even more worrying when we consider the fact that plastic can take hundreds of years to decompose in the environment. The persistence of this material in the environment contributes to the formation of large patches of garbage in the oceans, such as the well-known "Plastic Island" in the Pacific. Studies like the one by Santos et al. (2018) emphasize the importance of using eco-barriers in urban rivers to collect and classify solid waste, allowing the development of more effective management and treatment actions for these materials. Thus, Borba (2019) cites recycling, final disposal in landfills and heat treatment as the main ways of treating MSW.
As a response to the growing generation of MSW causing negative environmental impacts and cases of inadequate disposal, in 2010 the National Solid Waste Policy No. 12305/2010 was implemented in Brazil (Brasil 2010). In this way, Law No. 12305/2010 (Brasil 2010) in its article 3, defines as adequate final disposal of Solid Waste the “orderly distribution of tailings in landfills, observing specific operational rules in order to avoid damages or risks to public health and safety and to minimize adverse environmental impacts”.
Furthermore, Khan et al. (2016) and Al-Salem et al. (2018) highlight that the increase in MSW generation directly impacts negatively on factors such as urbanization, quality of life of the population, public health and the environment. Therefore, it can be said that the inadequate final destination of MSW can reach surface water resources directly affecting the aquatic fauna and flora.
With the inadequate final destination of MSW, problems can occur in urban drainage in addition to their presence in rivers and tributaries, found as floating waste. The authors Bernardino and Franz (2016) highlight in their studies that the identification of floating garbage is easily visualized on water resources (beaches, mangroves, lagoons, canals, rivers), causing negative environmental impacts. Forgiarini (2018) also point out that once floating garbage is present in the drainage system, it can reach coastal areas, especially in events of intense precipitation and strong winds that accelerate the transport of these materials.
As a low-cost alternative for the retention of floating waste, eco-barriers appear, with the aim of retaining waste transported by water courses that could reach downstream rivers and later the oceans causing cumulative environmental impacts. Fernandes et al. (2020) mentions the containment of waste transported by watercourses as the objective of eco-barriers and subsequently the forwarding of collected waste to an appropriate final destination. Thus, mitigating the negative environmental and visual impacts arising from floating garbage.
Therefore, the present work aims to quantify and classify urban solid waste retained in eco-barriers installed in two water courses in the municipality of Caçapava do Sul, Rio Grande do Sul.
2 Methodology
2.1 Characterization of the Study Area
The study area is located in the south-central region of the State of Rio Grande do Sul (Figure 1), at latitude 30º30'44" S and longitude 53º29'29" W, with an altitude of 450 meters above mean sea level, covers an area of 3,047.1 km² with a population of 33,650 inhabitants (IBGE 2010).

Figure 1
Ecobarrier Location Map: Modified from CPRM (2010) and IBGE (2010).
The climate data refer to the climate monitoring station located in the municipality of Encruzilhada do Sul, which offers physical characteristics similar to those of the municipality, in addition to being located close to the municipality of study. The data correspond to the years 1961 to 1990 (EMBRAPA 2010) and show an average temperature, in the analyzed period, of 17.1 °C. The average annual rainfall recorded is 1280 mm. In the month of July the highest rainfall occurs (157 mm), in the month of April the lowest rainfall is recorded (97 mm). According to the Köppen system, Caçapava do Sul falls into the temperate fundamental zone or "C" and the fundamental type "Cf" or humid temperate.
The places where the ecobarriers were installed were chosen because they have different characteristics of land occupation, with ecobarrier 1 in the rural area, with a contribution area of 4.22 km² and ecobarrier 2 in the urban area of the municipality with a contribution area of 1 .09 km² (Figure 1).
Ecobarrier 1 is located in an area in the rural area of the municipality of Caçapava do Sul-RS, in the locality of Rincão dos Godinho, approximately 2 km from the central region of the municipality. It was installed at a point located at UTM coordinates 259440.77mE and 6621494.50mN and a terrain elevation of 306 m.
Ecobarrier 2 is located in the urban area of the municipality of Caçapava do Sul-RS, in Bairro Persa, approximately 2 km from the central region of the municipality. It was installed at a point on the coordinates UTM 261469.59mE and 6620113.25mN and a terrain elevation of 395 m.
The delimitation of the hydrographic sub-basins, areas of contribution of the ecobarriers, was carried out in the software QGIS 2.18.20 from SRTM (Shuttle Radar Topography Mission) images and shapefile data with the coordinates of the outlets (ecobarriers). Data were processed using the r.watershed and r.water.outlet algorithms, both from GRASS GIS, to create the watersheds.
2.2 Construction of Ecobarriers
In order to retain the solid waste carried by the water courses, a rectangular structure with 15 cm high and 4.0 to 6.0 m in length depending on the size of the course was designed and installed, made of steel mesh, installed transversely to the axis of the stream, making it possible to retain and later analyze solid waste (Figure 2).

Figure 2
Ecobarrier example.
Polyethylene terephthalate - PET bottles were placed at the top of the ecobarrier so that it was above the water level and it was also attached to the existing vegetation on the banks of the stream, by means of 5 mm thick galvanized steel strips (Figure 3), in order to prevent intense flows from blocking the passage of rainwater, which could lead to flooding upstream.

Figure 3
Ecobarriers in water bodies: A. Ecobarrier 1; B. Ecobarrier 2.
2.3 Quantification and Classification of Solid Waste
The collections took place from August 22, 2018 to November 21, 2018, totaling 10 weeks, performing weekly monitoring where each rainfall event was accompanied by an observer to ensure that the water was not above the ecobarrier.
Regarding the criterion for dividing the floating residue into categories, the classification proposed by Franz (2011) was used, considering the following studies and characteristics:
A criterion for dividing floating garbage into categories, according to Ribic (1990) is its size: mega-garbage (>2-3cm); macro-waste (5mm to 2-3cm); meso-waste (<5mm, grain size); micro-waste (dust, usually unnoticed). For medium and large size garbage, Ribic et al. (1992) recommend that they organize a list of items first by composition (plastic, styrofoam, glass, metal, rubber, fiber, wood, paper) and from them, secondary categories are created according to their function or manufactured product (for e.g. fishing net, bottles, hospital, glass).
In relation to its size, according to the categories suggested by Ribic (1990), all waste retained along the eco-barriers was quantified and analyzed as “mega-garbage”, that is, larger than 2-3 cm. In this study, it was then decided to define that the primary categories of waste items would be classified according to their composition: plastic, paper, carton packaging, metal, glass, styrofoam, textile, diapers + absorbents.
First, all dry residues were weighed, separated into their classes, after which the percentages of items quantified according to their primary category in relation to the total were calculated. This calculation was made for each ecobarrier separately, in order to compare them and determine what type of waste each one managed to retain, having been classified according to ABNT 10004/2004 (ABNT 2004).
Waste Estimates in the Zone of Influence of Water Bodies
To obtain the total contribution of waste generated (Q) in the two sub-basins where the ecobarriers were placed, the Equation Q = L.H.D was used, where Q = Total Generation of Waste per Sub-basin (Kg), L = Value Average that each person produces garbage daily, according to IBGE (2010) this value is 0.9 kg/inhabitant/day, H = Number of Residences and D = Average value of people per residence, according to IBGE (2010) this value is of 3.3 people per household.
In order to obtain the exact number of residences that can cause impacts in the area of influence of the water bodies studied, a field survey was carried out with the help of the Google Earth program (2018), counting the housing units present in the delimited sub-basins.
3 Results and Discussion
3.1 Total Waste Collected
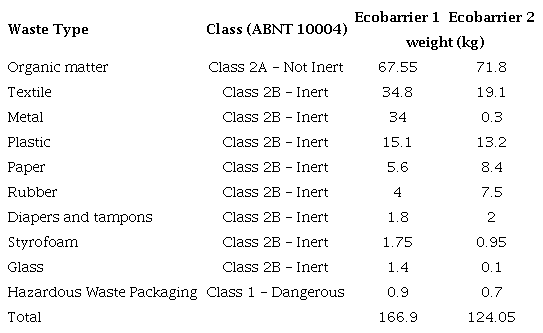
During the 10 weeks of collection, a total of 166.9 kg of waste was retained in Ecobarrier 1, and 124.5 kg in Ecobarrier 2 (Table 1).
The percentages obtained from all waste collected in Ecobarriers 1 and 2 are shown in Figures 4 respectively.
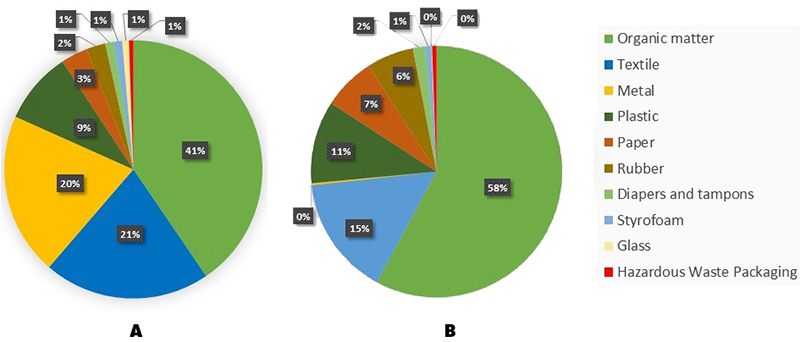
Figure 4
Percentage graph of solid waste collected during the monitoring period at: A. Ecobarrier 1; B. Ecobarrier 2.
In qualitative and quantitative terms, the variation between the values collected from the residues between the two Ecobarriers was not very significant, resulting in a higher percentage of organic class residues in all events, analyzing the ten precipitation events recorded during the period.
The largest amounts obtained in relation to the inorganic class were textile residues (Class II B- Inerts) with 53.0 kg collected, highlighting varied clothes, towels, blankets, among others, followed by metal residues (Class II B- Inerts) with 34.3 kg collected, highlighting an old washing machine housing composed only of metal without a motor and, still, plastic waste (Class II B- Inerts) of 32.2 kg collected they occurred in a very varied way as bottles of rigid plastic, bags, among others, and finally paper (Class II A - Non-Inert), 14 kg were collected, highlighting a greater volume of cardboard.
A large amount of collected plant debris (organic matter) was also noted, mainly as a result of the high presence of vegetation around the edges of water bodies, so that in ecobarrier 1 it corresponded to 44% of all collected waste and in ecobarrier 2 corresponded to 58% of the collected residue. Figure 5 represents the waste collected in one week in ecobarrier 1 (Figure 5A) and ecobarrier 2 (Figure 5B).

Figure 5
Waste collected at: A. Ecobarrier 1; B. Ecobarrier 2.
3.2 Total Waste Collected
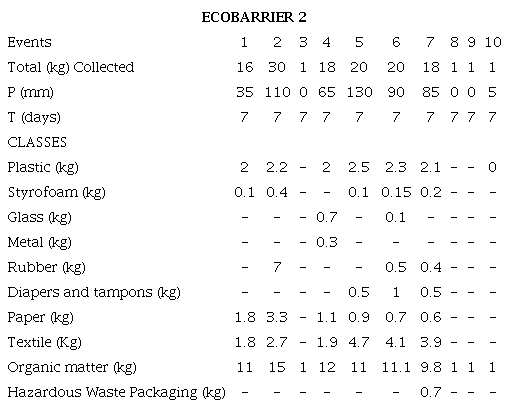
During the period in which there were events of greater precipitation, the accumulation of residues was relatively higher, with variation in terms of quantity as shown in Tables 2 and 3, which also occurred in the work developed by Wolff et al. (2016) in the municipality of Santa Maria-RS, where a greater accumulation of waste was also observed during the most intense rainfall.
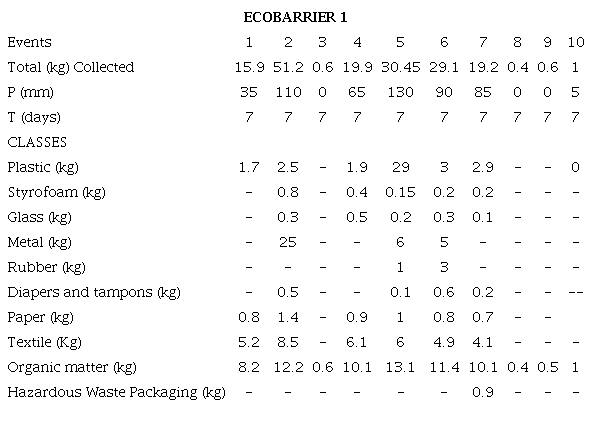
The highest amounts of accumulated solid waste were 51.2 kg in Ecobarrier 1 and 30.1 kg in Ecobarrier 2 for registered rainfall of 110 mm, precipitation influenced the transport of readily available materials on the surface of the contribution area to the water course. However, as stated by Wolff et al. (2016), for a better analysis, more events with similar characteristics would be needed, allowing a multiple correlation between the parameters, since the transport of solid waste through drainage is related to more than one parameter, such as maximum intensity of precipitation. , volume drained, flow of the water body and availability of residues on the surface in the studied surroundings and its margins.
Events with intense precipitation, in addition to generating an increase in river flows, tend to generate surface runoff with significant drag tension, causing materials improperly discarded in areas with higher topographic levels to tend to be carried to places with lower topographical levels and, consequently reaching water courses. This growing trend between precipitation and the volume of solid waste collected was also found by Neves and Tucci (2008) who analyzed an urban area in the city of Porto Alegre (RS), and by Gava and Finotti (2012), in an urban area in Rio do Meio watershed in Florianópolis (SC).
In Brazil and internationally, data on the quantity and quality of waste in the drainage network are scarce, due to the fact that monitoring is expensive and requires time for data collection.
3.3 Estimation of Residues in the Influence Zones of Water Bodies
To estimate the generation of solid waste in the studied region, Equation 1 was used, where it was established that the number of residences in the zone of influence of Ecobarrier 1 was 625 households and in the zone of influence of Ecobarrier 2 it was 220 households, this number if arrived through field work and also analyzing the topographic quotas for the delimitation of the sub-basins in which the residences were inserted. The data obtained are shown in Table 4.
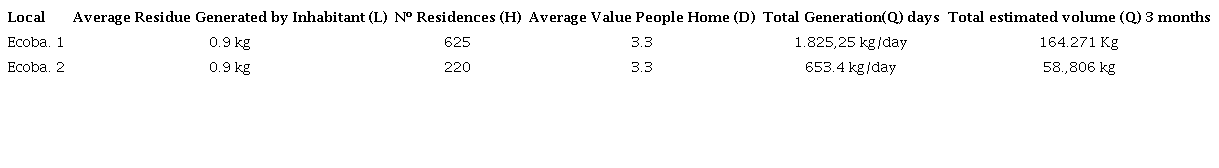
The estimated quantification of solid waste in the area of influence of Ecobarrier 1 was 1,825.25 kg/day, and in the area of influence of Ecobarrier 2 it was 653.4 kg/day.
This proves that the data obtained in the monitoring of the Ecobarriers are coherent with reality, as the ecobarrier 1 was collected 166.9 kg, a value close to the estimated 164.271, a value higher than the ecobarrier 2, which collected 124.05 kg, estimating that 58.806 kg were collected (Table 1).
The result was that all waste produced in the zone of influence of ecobarrier 1, only 0.1% reaches the studied watercourse. Only 0.22% of the waste produced in the area of influence of ecobarrier 2 reaches the studied watercourse. A very low number can be noted, which means that the collection is being efficient and that a large part of the population is making the correct final destination of the waste.
3.4 Case Study of the Watercourse Where Ecobarrier 2 was Placed
One fact observed in the study was that, in the water body where Ecobarrier 2 is located, the residences are 10 meters away from the water body. According to Law nº 12.651/12, of the Brazilian Forest Code (Brasil 2012), for works to be carried out close to natural, perennial and intermittent water courses, which are considered Permanent Preservation Areas (APP), there is a minimum distance of 30 meters for water courses less than 10 meters wide; 50 meters, for water courses that are 10 to 50 meters wide; 100 meters, for water courses that are 50 to 200 meters wide; 200 meters, for water courses that are 200 to 600 meters wide; and 500 meters for water courses that are more than 600 meters wide.
As the water body studied is small, less than 10 meters wide, it can be observed that there is a large invasion of areas that would be Permanent Preservation Areas. However, this law makes an exception in cases of pre-existing constructions and consolidated areas on the banks of natural watercourses, which are not considered APPs. Thus, works close to rivers are legal, if they have already suffered human intervention, as long as there is a minimum distance of 15 meters from their course, according to Law 6,766/79, which provides for the subdivision of urban land, which affirms as a fundamental requirement the obligation of a non-buildable strip of 15 meters on each side, along the current and dormant waters.
4 Conclusion
According to the characteristics of the composition of the waste found next to ecobarrier 1, textiles were the predominant component (34.4 kg), Metal (34.0 kg) and Plastics (15.1 kg) represent the second and third predominant components, respectively. In ecobarrier 2, textiles were the predominant component (19.1 kg), Plastic (13.2 kg) and Paper (8.4 kg) represent the second and third predominant components, respectively. A large amount of plant debris was also observed, mainly due to the high presence of riparian forest along the edges of the water body.
There was an increasing trend between precipitation and the volume of solid waste collected. The differences found between the water bodies are related to their own characteristics, such as: land use and occupation, efficiency of urban cleaning services, population awareness, rainfall characteristics.
The presence of floating garbage in the water courses of the municipality partially reflects the lack of concern on the part of the population and governments with its effects on human and environmental health. It is in the context of avoiding the generation of floating waste that the integration of public policies can play a fundamental role with the help of environmental education.
The presence of litter in rivers is a serious environmental problem that requires urgent action to minimize its negative effects on aquatic ecosystems and the sea. The inadequate disposal of urban solid waste is one of the main causes of river pollution and its consequent contamination. In addition, the population's lack of awareness about the importance of correct waste disposal and the lack of adequate infrastructure and technology for the treatment of these materials contribute to aggravating the problem. There needs to be a joint effort between the public and private sectors, as well as society in general, to face the challenge of litter pollution in rivers and ensure the preservation of aquatic ecosystems and marine biodiversity.
Another challenge to be faced is the absence of public policy aimed at not generating floating garbage and deconstructing the perception that the income opportunity arising from the presence of this garbage in aquatic environments is a major part of the perception of the risks it represents.
The release of solid waste into rivers is a matter of concern in Brazil and has consequences for human health and biodiversity. The lack of effective public policies for waste management and the lack of public awareness of the importance of correct disposal of materials have contributed to aggravating the problem. It is important to point out that river jets can affect the quality of water used for human consumption and affect fauna and flora, compromising the sustainability of aquatic ecosystems. Therefore, the adoption of measures aimed at the preservation and recovery of rivers is essential to guarantee the quality of life of communities that depend on these water resources and to ensure long-term environmental sustainability.
5 Acknowledgments
The second author thanks CAPES/FAPERGS for the financial support granted through the PPGEC/UFSM postgraduate scholarship.
6 References
ABNT - Associação Brasileira de Normas Técnicas 2004, NBR 1004: Resíduos Sólidos: Classificação, Rio de Janeiro, ABNT.
Al-Salem, S.M., Al-Nasser, A. & Al-Dhafeeri, A.T. 2018, ‘Multi-variable regression analysis for the solid waste generation in the State of Kuwait’, Process Safety and Environmental Protection, vol. 119, pp. 172-80, DOI:10.1016/j.psep.2018.07.017.
Bernardino, D. & Franz, B. 2016, ‘Lixo flutuante na Baía de Guanabara: Passado, presente e perspectivas para o futuro’, Desenvolvimento e Meio Ambiente, vol. 38, pp. 231-52, DOI:10.5380/dma.v38i0.47024.
Borba, W.F. 2019, ‘Avaliação da contaminação ambiental em um aterro sanitário de pequeno porte, sem utilização de geomembrana, na região noroeste do Estado do Rio Grande do Sul’, PhD thesis, Universidade Federal de Santa Maria, Santa Maria.
Brasil 2010. Lei nº. 12.305, de 2 de agosto de 2010, Institui a Política Nacional de Resíduos Sólidos, Presidência da República, viewed 15 October 2018, <305, de 2 de agosto de 2010, Institui a Política Nacional de Resíduos Sólidos, Presidência da República, viewed 15 October 2018, http://www.planalto.gov.br/ccivil_03/_ato2007-2010/2010/lei/l12305.htm>.
Brasil 2012, Lei nº 12.651, de 25 de maio de 2012, Institui Novo Lei Código Florestal, Ministério do Meio Ambiente e Mudança do Clima, viewed 20 November 2018, <651, de 25 de maio de 2012, Institui Novo Lei Código Florestal, Ministério do Meio Ambiente e Mudança do Clima, viewed 20 November 2018, https://www.planalto.gov.br/ccivil_03/_ato2011-2014/2012/lei/l12651.htm.>
CPRM - Companhia de Pesquisa de Recursos Minerais 2010, Companhia de Pesquisa de Recursos Minerais, viewed 20 May 2018, <CPRM - Companhia de Pesquisa de Recursos Minerais 2010, Companhia de Pesquisa de Recursos Minerais, viewed 20 May 2018, http://geosgb.cprm.gov.br/>.
EMBRAPA - Empresa Brasileira de Pesquisa Agropecuária 2010, Empresa Brasileira de Pesquisa Agropecuária, viewed 8 June 2018, <EMBRAPA - Empresa Brasileira de Pesquisa Agropecuária 2010, Empresa Brasileira de Pesquisa Agropecuária, viewed 8 June 2018, http://www.cnpsa.embrapa.br/meteor/>.
Franz, B. 2011, ‘O lixo flutuante em regiões metropolitanas costeiras no âmbito de políticas públicas: O caso da cidade do Rio de Janeiro’, PhD thesis, Universidade Federal do Rio de Janeiro, Rio de Janeiro.
Forgiarini, G. M. 2018. ‘Classificação dos resíduos sólidos urbanos coletados com o uso de ecobarreira em cursos de água no município de Caçapava do Sul, RS’, viewed 24 October 2023, < ‘Classificação dos resíduos sólidos urbanos coletados com o uso de ecobarreira em cursos de água no município de Caçapava do Sul, RS’, viewed 24 October 2023, https://dspace.unipampa.edu.br/bitstream/riu/4123/1/Gabriel%20Melo%20Forgiarini%202018.pdf>.
Gava, T. & Finotti, A.R. 2012, ‘Resíduos sólidos urbanos na rede de drenagem da bacia hidrográfica do rio do meio, Florianópolis/SC’, Revista de Gestão Ambiental e Sustentabilidade, vol. 1, no. 2, pp. 80-102, DOI:10.5585/geas.v1i2.24.
GOOGLE EARTH PRO 2018, Software Google Earth, versão 7.1.8.3036.
IBGE - Instituto Brasileiro de Geografia e Estatística 2010, Censo 2010, viewed 20 November 2018, <IBGE - Instituto Brasileiro de Geografia e Estatística 2010, Censo 2010, viewed 20 November 2018, https://ww2.ibge.gov.br/home/estatistica/populacao/censo2010/familias_e_domicilios/default_familias_e_domicilios.shtm>.
Khan, D., Kumar, D. & Samadder, S. R. 2016, ‘Impact of socioeconomic status on municipal solid waste generation rate’, Waste Management, vol. 49, pp. 15-25, DOI:10.1016/j.wasman.2016.01.019.
Neves, M.G.F.P. & Tucci, C.E.M. 2008, ‘Resíduos sólidos na drenagem urbana: estudo de caso’, Revista Brasileira de Recursos Hídricos, vol. 13, no. 4, pp. 43-53, DOI:10.21168/rbrh.v13n4.p43-53.
Ribic, C.A. 1990, ‘Report of the working group on methods to assess the amount and types of marine debris’, in R.S. Shomura & M.L. Godfrey (eds), Proceedings of the second international conference on marine debris, HI, Honolulu, pp. 1201-6.
Ribic, C.A., Dixon, T.R. & Vining, I. 1992, Marine Debris Survey Manual, NOAA Technical Report, US Department of Commerce, Washington, DC.
Santos, B.M. et al. 2018, ‘Eficiência de ecobarreiras em rio dominado por maré’, viewed 18 October 2023, < 2018, ‘Eficiência de ecobarreiras em rio dominado por maré’, viewed 18 October 2023, https://bdm.ufpa.br:8443/jspui/bitstream/prefix/2111/1/Tcc_EficienciaEcobarreirasRio.pdf>.
Wolff, D.B., Gonçalves, I.H., Gastaldini, M.C.C. & Souza, M.M. 2016, ‘Resíduos sólidos em um sistema de drenagem urbana no município de Santa Maria (RS)’, Engenharia Sanitária e Ambiental, vol. 21, no. 1, pp. 151-8, DOI:10.1590/S1413-41520201600100132089.
Data availability statement
Funding information
Author notes
Corresponding author: Douglas Bitencourt Vidal; bitencourt_douglas@hotmail.com
Conflict of interest declaration