Article
Classification of 2007 Winter Mist and Fog in São Paulo City, Brazil
Classificação de Névoas e Nevoeiros do Inverno de 2007 na Cidade de São Paulo, Brasil
 Brenda Almeida Santos bre.alm.san@gmail.com
Rita Yuri Ynoue rita.ynoue@iag.usp.br
Brenda Almeida Santos bre.alm.san@gmail.com
Rita Yuri Ynoue rita.ynoue@iag.usp.br
Classification of 2007 Winter Mist and Fog in São Paulo City, Brazil
Anuário do Instituto de Geociências, vol. 46, 52695, 2023
Universidade Federal do Rio de Janeiro
Received: 30 May 2022
Accepted: 26 September 2022
Funding
Funding source: CAPES
Contract number: 88887.334460/2019-00
Funding statement: CAPES, Process Nº 88887.334460/2019-00
Abstract: Mist and fog observed at the Meteorological Station of the Institute of Astronomy, Geophysics and Atmospheric Sciences of the University of São Paulo (EM/IAG) in the southeastern part of São Paulo city in the winter of 2007 were classified according to its formation processes: advection or radiation. Meteorological data from EM/IAG, Congonhas Airport and reanalysis from the European Center for Medium-Range Weather Forecast, as well as radiosondes from Campo de Marte Airport were used. In the 1981-2015 climatology, it was observed that these phenomena are more frequent in the winter, with an average of 11 events per month. For the winter of 2007, 21 advection and 28 radiation events were detected, with radiation fog occurring more frequently in June (13) and advection fog, in August (12). The South Atlantic Subtropical High favored the formation of radiation events in 24 cases; 15 of which had the contribution of humidity advected by the sea breeze. Post-frontal anticyclone was associated with the remaining 25 cases, of which 15 were classified as advection. Four cases were chosen for a more detailed analysis. On July 2, 2007, radiation mist occurred, with the injection of moisture by the sea breeze; the next day, there was also radiation mist, however, with no sea breeze. On the 20th of July, fog was caused by advection of humidity with north/northeast winds coming from the Serra da Cantareira and on the 27th, advection mist developed due to the intensification of winds associated with the movement of a post-frontal anticyclone.
Keywords: Advection Fog, Synoptic Scenario, Sea Breeze.
Resumo: Névoa e nevoeiro registrados na Estação Meteorológica do Instituto de Astronomia, Geofísica e Ciências Atmosféricas da Universidade de São Paulo (EM/IAG) no sudeste da cidade de São Paulo foram classificados com relação aos processos de formação: advectivo ou radiativo, para o inverno de 2007. Para isso, foram utilizados dados meteorológicos da EM/IAG, do Aeroporto de Congonhas e das reanálises do Centro Europeu de Previsões Meteorológicas de Médio Prazo, bem como radiossondas do Aeroporto de Campo de Marte. Na climatologia de 1981-2015, observou-se que esses fenômenos são mais frequentes no inverno, com uma média de 11 eventos por mês. Para o inverno de 2007, foram detectados 21 eventos advectivos e 28 radiativos, sendo que os radiativos ocorreram com maior frequência em junho (13) e os advectivos, em agosto (12). A Alta Subtropical do Atlântico Sul favoreceu a formação dos eventos por radiação, sendo o sistema sinótico atuante em 24 casos; 15 dos quais tiveram a contribuição da umidade trazida pela brisa marítima. A alta pós-frontal esteve associada aos 25 casos restantes, dentre estes, 15 foram classificados como advectivos. Quatro casos foram escolhidos para uma análise mais detalhada. No dia 02 de julho de 2007, ocorreu névoa, com injeção de umidade pela brisa marítima; no dia seguinte, houve também névoa radiativa, entretanto, sem a presença da brisa. No dia 20 de julho, o nevoeiro foi provocado por advecção de umidade com ventos de norte/nordeste vindos da Serra da Cantareira e no dia 27, névoa se formou devido à intensificação dos ventos associados à alta pressão pós-frontal.
Palavras-chave: Nevoeiro por Advecção, Situação Sinótica, Brisa Marítima.
1 Introduction
Fog is an atmospheric phenomenon that forms near or close to the earth's surface and is made up of water droplets or ice crystals suspended in the atmosphere. Fog reduces horizontal visibility - defined by the greatest distance at which an object can be seen and identified (WMO 2010) - to less than one kilometer and can be considered as a Stratus cloud (St) (CPTEC 2022; WMO 2010).
Two basic physical mechanisms usually occur for development: incorporation of water vapor into the air and its cooling to the dew point temperature (Willett 1928). Although one of them is predominant, in most cases there is a combination of these two mechanisms. There are several types of fog that are classified according to the geographic region in which they are established, the synoptic system and their evolution processes (Croft et al. 1997). The main ones are:
-
Radiation fog: occurs on nights with clear skies (few or no clouds), light or absent winds and high relative humidity. This absence of cloud cover and calm winds favor the radiation cooling of the air layer near the surface, which can be accompanied by a thermal inversion. In an atmosphere with sufficient humidity, this cooling leads to air saturation and condensation, producing fog.
-
Advection fog: occurs when a mass of relatively warm and humid air moves over a cooler surface. Thus, this air cools due to contact or mixing with the cooler air near the surface, until it reaches the dew point temperature. A deeper layer of fog may develop with some turbulence.
São Paulo is one of the most populous cities in the world (more than 12 million inhabitants, according to Brazilian Institute of Geography and Statistics, IBGE, 202 population estimates). Due to its location, on the plateau of the Brazilian Highlands and about 60 km from the Atlantic Ocean, the mountain-valley circulation contributes to the advance of the sea breeze (SB). Perez and Silva Dias (2017) showed that SB frontal passage at the Meteorological Station of the Institute of Astronomy, Geophysics and Atmospheric Sciences of the University of São Paulo (EM/IAG) is observed, on average, on half days of a year.
Machado (1993) studied fog formation and performed numerical simulations for February 1989 in greater São Paulo and surroundings, verifying that: i) When the SB circulation reaches the plateau where São Paulo city is located and under favorable synoptic conditions, persistent fogs develop on the following dawn; ii) There is no fog when the SB does not reach the plateau; and iii) Topographic/Uplift fog occurs as a second type of fog in the simulations. Conde and Silva Dias (2000) presented the atmospheric conditions for the occurrence of fog in São Paulo for a case in June of 1999: convergence of humidity in the surface due to local circulations, development of thermal inversion and relatively weak winds. Armani, Funari and Haaegely (2010), using data from the EM/IAG, from 1958 to 2007, detected a decrease in the number of occurrences over these 50 years and in the three years with extreme patterns - 1995 (lowest number of days with fog), 1996 (minimum duration) and 2007 (largest number of days with fog and maximum duration) identified that the most frequent duration of the phenomenon was one hour and the longest lasted ten hours in 2007. Da Silva (2018), using surface observations, satellite data and numerical modeling for several Brazilian airports, concluded that i) Fog duration increased from lower to higher latitudes; ii) Most of the time, the phenomenon was preceded by an inversion of temperature and the first few hundred meters above the surface became colder and wetter.
To improve fog forecasting, it is essential to understand fog formation mechanisms. This work proposes, therefore, a classification of mist/fog types registered in the EM/IAG in the winter of 2007, analyzing the synoptic and meso-scale conditions in the state of São Paulo.
2 Material and Methods
2.1 Study Area
São Paulo city is located on a plateau of the Brazilian Highlands with an average elevation of 800 m being surrounded by the Serra da Mantiqueira to the North and Serra do Mar mountain range to the East, being about 60 km from the Atlantic Ocean. The EM/IAG is located in the Parque do Estado, in the Southeastern region of São Paulo (Lat.: 23.651161° S, Lon.: 046.622399° W, Alt.: 800 m), as shown in Figure 1
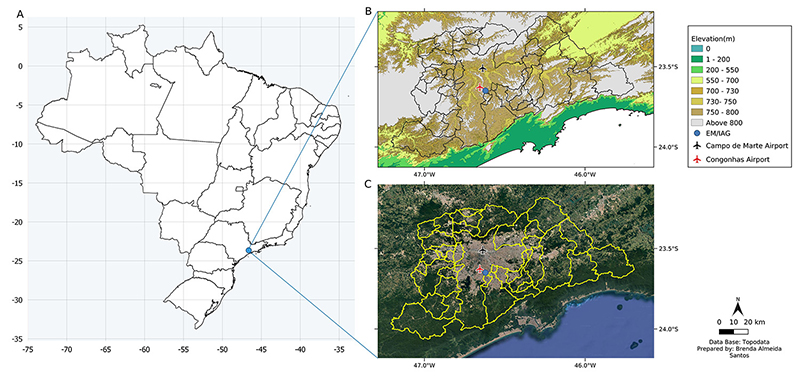
Figure 1
A. Brazilian States; B. Topography (in meters. Source: EMBRAPA); C. Google Satellite (Source: Google Earth); Location of EM/IAG (blue circle), Congonhas Airport (red airplane) and Campo de Marte Airport (black airplane) inside the city of São Paulo, and the limits of other cities of the Metropolitan Area.
2.2 Data
Usually, Universal Time Coordinated (UTC) is used for meteorological analysis, but, since fog is a local phenomenon, Local Time (LT = UTC - 3) was used as a time convention.
The weather observers of EM/IAG work between 07-24 LT, so atmospheric phenomena - such as fog, mist, dew, types of cloud and cloud cover - that occur between 24 and 07 LT are not registered. The criteria adopted for the identification of mist and fog by the EM/IAG are: horizontal visibility less than or equal to 3000 m (divided into mist, fog and dense fog as described in Table 1) and relative humidity (RH) greater than 70%.
Other EM/IAG data, some automatically others manually collected, used in this study were: visibility, clouds, wind direction and speed, atmospheric pressure, dry bulb (Tbs) and wet bulb (Tbu) air temperature, dew point temperature (Td), relative humidity (RH) and specific humidity (q).
The atmospheric soundings of Campo de Marte Airport were obtained through the website of the University of Wyoming, whose primary data source is REDEMET1. The Meteorological Aerodrome Reports (METAR) from Congonhas Airport (SBSP), located 4.9 km from EM/IAG (REDEMET) were also considered due to its availability from 00 to 07 LT.
Fog in METAR is reported as FG (visibility is less than 1 km), and mist, as BR (visibility between 1 and 5 km).
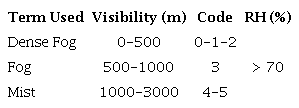
The codes used by EM-IAG are associated with horizontal visibility. Dense Fog is defined for visibility less than 500 meters (m) and, within this category, code 0 is used for visibility up to 50 m; code 1, between 50 and 200 m and code 2, between 200 and 500 m. Fog is defined for visibility between 500 and 1000 m, with code 3. Mist occurs when the horizon is blurred and for visibility between 1000 and 2000 m code 4 is used, and code 5 for visibility between 2000 and 3000 m (Source: Master Engineer Mario Festa, EM/IAG laboratory specialist, in personal communication, February 3, 2021).
The atmospheric variables used to analyze the synoptic conditions were mean sea level pressure, geopotential height and zonal and meridional wind components, obtained from the European Center for Medium-Range Weather Forecasts (ECMWF) ERA-Interim reanalysis (Dee et al. 2011; https://www.ecmwf.int/en/research/climate-reanalysis/era-interim), with a spatial resolution of 2.5°, at 9 LT at atmospheric levels of 1000, 850, 500 and 250 hPa.
For the identification and analysis of mesoscale circulations, hourly data of temperature and dew point temperature at 2 m, and zonal and meridional wind components at 10 m from the the fifth generation of reanalysis (ERA5) from ECMWF (Hersbach et al. 2020; https://www.ecmwf.int/en/forecasts/datasets/reanalysis-datasets/era5), with a spatial resolution of 0.25° were used. Data from the ERA-Interim and ERA5 models were extracted from the grid point closest to the EM/IAG.
3 Results and Discussion
Figure 2 shows the mean number of days with occurrence of fog in EM/IAG in the period 1981-2015, and it can be observed that fog is more frequent in the winter, with a peak in June (11 days), similar to results obtained by Da Silva (2018) who identified that in the Southeast Region of Brazil, between 2003-2012, fog was more frequent in autumn-winter, with a peak of occurrence also in the month of June. Machado (1993) reported that the local circulations associated with the formation of fog in greater São Paulo did not present considerable changes in its seasonal behavior between the periods analyzed (1933-37; 1981-90), with the highest fog occurrence rates in May to August, indicating that fog is more likely to develop in late autumn and winter. It was also found that the phenomenon is quite common in the summer, however, less frequent.
The highest number of days with fog in winter occurred on 1981 and 2007 (La Niña years) with 45 and 43 days, respectively. Thus, the winter of 2007 was selected for a more detailed study, as it is more recent and with greater data availability than 1981.
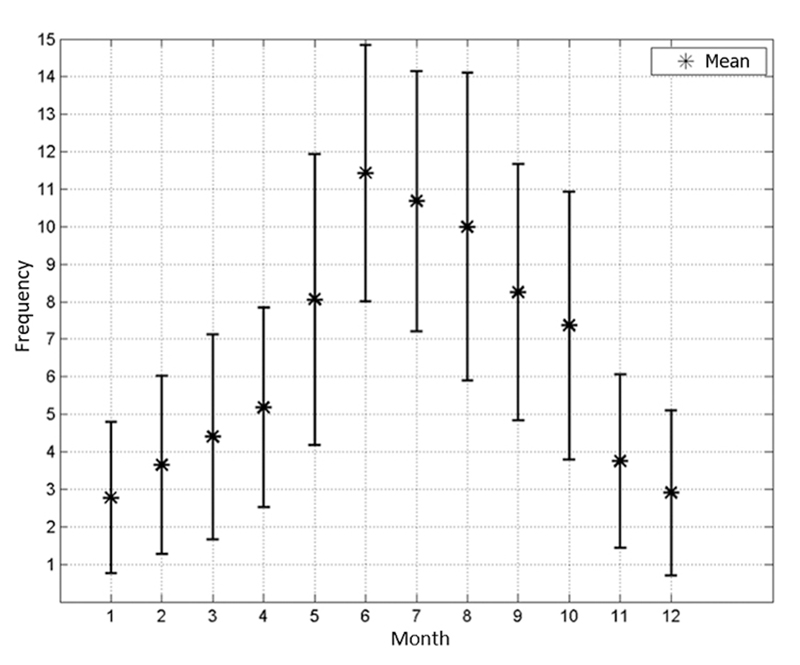
Figure 2
Monthly mean and standard deviation of days with fog recorded in EM/IAG in the period from 1981 to 2015.
Table 2 summarizes the days with fog recorded in the EM/IAG in the winter of 2007, as well as the category, the meteorological systems present and fog classification. Within the 43 days with fog between 1st of June and 31st of August 2007, there were 49 cases: 3 cases started at 00 LT, 22 in the morning, 6 in the afternoon and 18 cases in the night period; that is, most events started during the morning and evening, as also observed by Da Silva (2018) at airports in Brazil. There was a change in fog intensity in 11 days (Table 2, highlighted in gray). Most of these changes were from fog to mist occurring in the early morning, and dissipation due to daytime heating. The recorded fog intensity varied between mist (49) and fog (13). In some cases, the term “surface fog” was registered, in a situation “when the observer can see the clear sky above an angle of 30 degrees from the horizon” (Source: Me. Eng. Mario Festa - personal communication).
The surface synoptic weather charts show that, in most cases, the predominant synoptic system on these days was a surface anticyclone. This high-pressure system was associated either with a cold front that passed through the region - Post-frontal anticyclone (PFA) - or with the South Atlantic Subtropical High (SASH) shifted westward, as expected for this season (Reboita et al. 2010). Transient high-pressure systems are important because they are sources of cold air in winter (Sinclair 1996), have subsident air movement, and often advect moisture from the ocean into the continent, which favor fog formation by radiation and advection, respectively. Depending on the flow configuration of the synoptic scale, it can either inhibit or favor the penetration of the sea breeze (Perez & Silva Dias 2017) up to the plateau where the EM/IAG is located. SB develops when there is a temperature difference between the continent and the ocean and this condition is favored when there is little cloudiness throughout the day, as when there is an anticyclone over the region (Oliveira & Silva Dias 1982). As also shown in Table 2, the circulation of the SB was associated with several cases, occurring when SASH is the synoptic system acting on São Paulo.
Fog was classified as radiation when winds were calm (0 to 0.5 m s-1 - Beaufort Scale (Primault 1979)) and there were few or no clouds. It usually occurred in the presence of SASH, between night and dawn and was more frequent in the beginning of the winter. Advection fog, on the other hand, refers to days when, at the time of fog, wind speed was higher than 0.5 m s-1, with advection of humidity (seen on ERA5 fields), either due to the passage of a cold front, SB or intense circulation of a PFA at the site, all of them associated with southeast winds. The PFA favored the formation of this type of fog mainly in the middle and end of the winter. Data also show the presence of more cloudiness. In the cases of advection fog due to SB, its main contribution was higher humidity and relatively colder temperature, unlike the definition that considers the transport of a mass of warmer and humid air to a colder and drier region. It was also possible to notice that pre-frontal situations, with persistent winds from the NW, do not favor the formation of fog because warm dry advection takes place.
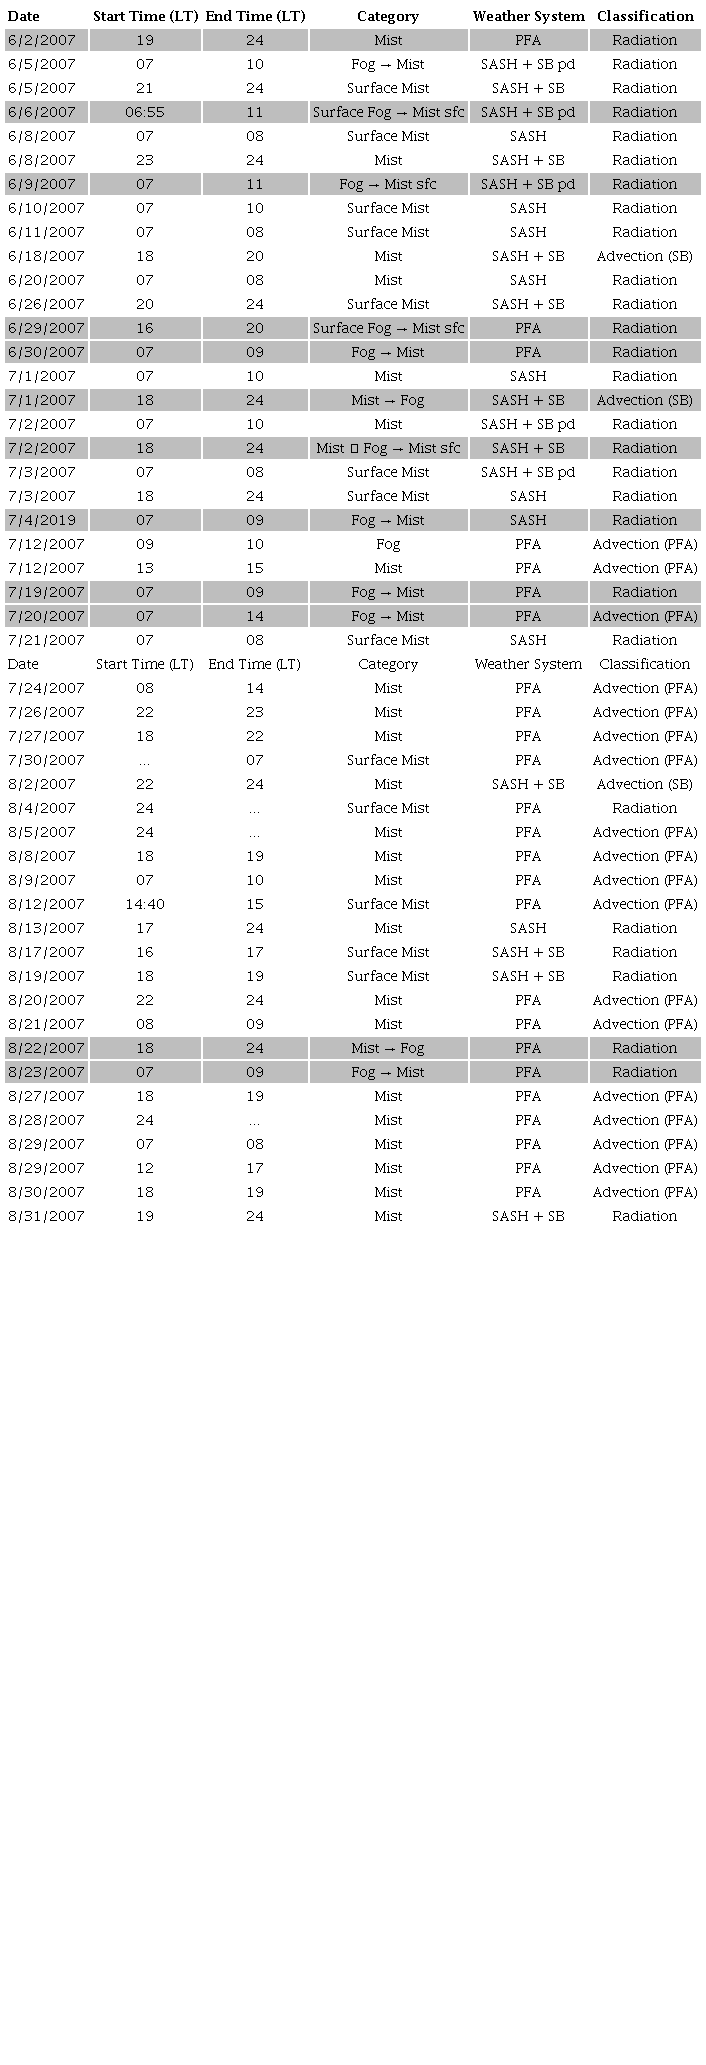
* The shaded dates correspond to the days when the intensity of fog changed. PFA: post-frontal anticyclone; SASH: South Atlantic Subtropical High; SB: Sea Breeze (pd = previous day); sfc: surface.
3.1 July 02 and 03, 2007 - Radiation fogs
Fog was registered on July 2, from 18 to 24 LT and on July 3, from 07 to 08 LT. Since there was no observer at EM/IAG between 00 and 07 LT, Congonhas Airport METAR was also used. Mist was reported from July 2-17 LT until 3-08 LT. Thus, a single event lasted 14 hours.
On June 28, a cold front moved through the city of São Paulo and the PFA remained in the region during the following days, joining SASH around July 2, when fog from 07-09 LT was recorded. However, the event studied here started later, at 18 LT, as mist, then intensified to fog at 19 LT and returned to surface mist at 20-00 LT. Throughout this day, Stratus clouds were observed only during the morning, between 07-10 LT, with no precipitation. The EM/IAG information is fundamental for the study of fog. However, considering that local circulations can contribute to its formation and duration, ERA5 analyzes were added. Figure 3 shows the comparison between the EM/IAG observations and the ERA5 surface data for July 2.
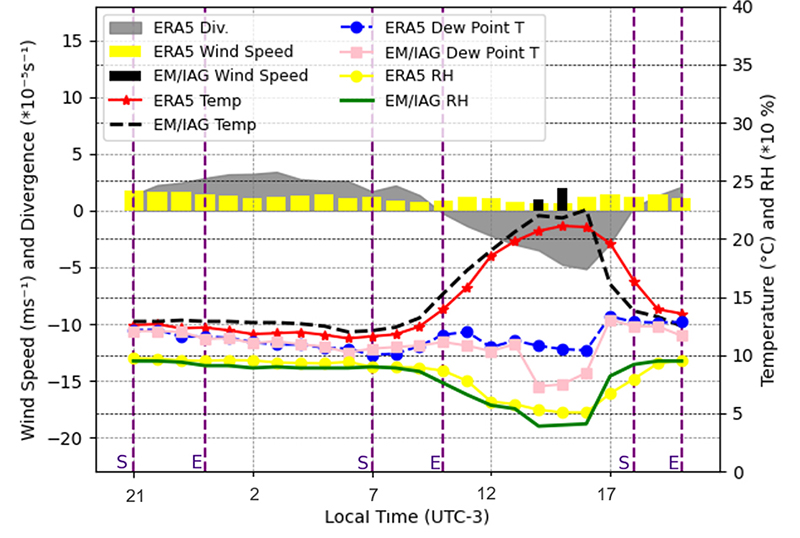
Figure 3
Temporal evolution of Temperature (°C), Dew point temperature (°C), wind speed (m s-1) and Relative Humidity (%) at EM/IAG and ERA5 and Divergence (*10- 5 s-1) from ERA5 for July 2, 2007. The purple dashed line represents the start (S) and end (E) time of the fog event recorded in EM/IAG.
ERA5 temperature and relative humidity data closely approximated the data measured by EM/IAG. Between 14 and 15 LT, wind shifted from northwest to southwest (~2 m s-1), temperature decreased slightly from 22 to 21.8 °C as the specific humidity (q) increased from 6.9 to 7 g kg-1. Although the EM/IAG data do not configure the classic characteristics of the entrance of the SB (Oliveira & Silva Dias 1982; Perez & Silva Dias 2017), the reanalysis wind and temperature fields (Figure 4A) clearly shows this circulation at 16 LT when SB reaches the center of the Metropolitan Region of São Paulo, as seen by Freitas and Silva Dias (2004). ERA5 grid point data (Figure 3) also show wind convergence with a peak at 16 LT, indicating the SB frontal passage.
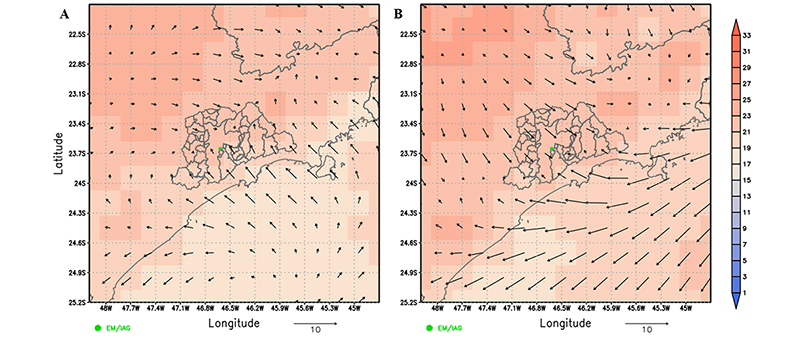
Figure 4
Temperature fields at 2 m (°C, shaded) and wind at 10 m (m s-1, vector) from ERA5 at 16 LT on: A. 02 July 2007; B. 03 July 2007. The map represents the metropolitan area and state limits of São Paulo and the green dot represnts EM/IAG.
The beginning of the fog was marked by a drop in temperature (from 13.3 °C at 19 LT to 12.5 °C at 20 LT, cooling of 0.8 °C h-1), gradually decreasing throughout the dawn reaching the minimum temperature of 9 °C at 07 LT (cooling rate 0.3 °C h-1). The specific humidity (q) also decreased during the night (from 9.8 g kg-1 at 19 LT to 7.4 g kg-1 at 07 LT), associated with condensation for the fog formation, which can also be observed in the decrease of Td. On the next day, July 03 (Figure 5), surface mist was observed at 07 LT, dissipating at 08 LT with no clouds (clear sky) and no wind. Between 07 and 08 LT, temperature increased by 2 °C, respectively. As the fog was dissipating, the evaporation of the water droplets increased the relative and specific humidity: from 95% to 98% and from 7.4 to 8.6 g kg-1. ERA5 wind remained practically constant, below 5 m.s-1, with slight divergence.
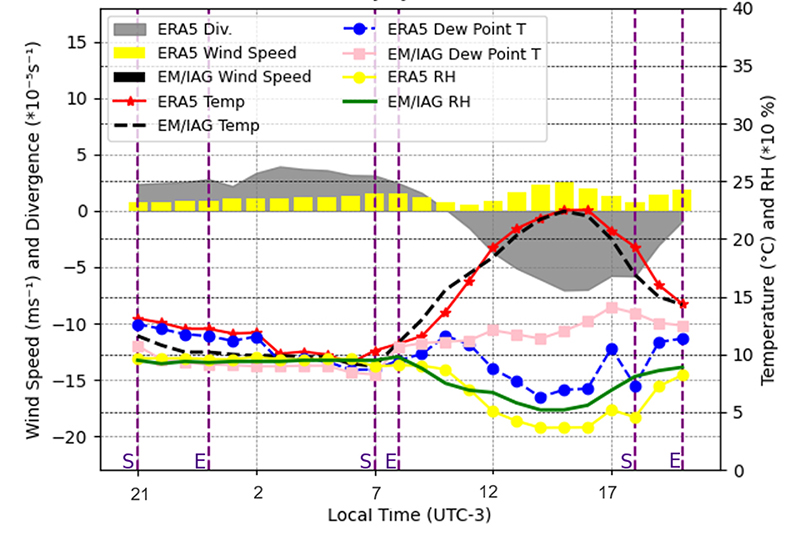
Figure 5
Temporal evolution of Temperature (°C), Dew point temperature (°C), wind speed (m s-1) and Relative Humidity (%) at EM/IAG and ERA5 and Divergence (*10- 5 s-1) from ERA5 for July 3, 2007. The purple dashed line represents the start (S) and end (E) time of the fog event recorded in EM/IAG.
Figure 6 shows the atmospheric soundings carried out at Campo de Marte Airport (northern part of the city of São Paulo) for July 2, 3 and 4 at 09 and 21 LT.
On July 2 at 09 LT (Figure 6A), a neutral layer can be seen between the surface up to 900 hPa, which may be associated with the beginning of daytime heating eroding the thermal inversion just above. It is still possible to see the residual layer from the previous day, between 890 and 840 hPa and the thermal inversion associated with the SASH subsidence between 840 and 810 hPa. The atmospheric sounding at 21 LT (Figure 6B) shows the impact of diurnal heating up to 810 hPa. The maximum temperature was 22.5 °C in EM/IAG. However, the cooling of the layer closest to the surface can be noticed, with a thermal inversion that intensified until the next sounding, on July 3 at 09 LT (Figure 6C), from 2 to 5 °C (difference in temperatures between the levels of 890 and 925 hPa), based around 925 hPa. In the study by Da Silva (2018), most cases had an inversion lower than or equal to 3 °C, and the base of the inversion was on the surface. Above this inversion layer, T and Td are slightly separated indicating a drier, cloudless atmosphere, confirmed by EM/IAG records. The wind at the surface decreased, favoring the radiation loss at the sunset of the previous day.
Therefore, this fog was classified as radiation fog, having moisture injection by the SB on the previous day, with subsequent radiative loss due to lack of cloud cover and light winds associated with SASH.
Another event on this same day was recorded from 18 to 00 LT. The average air cooling rate was 1.2 °C h-1 before fog formation (between 15-17 LT) and 0.9 °C h-1 during its development (for approximately 7 hours: 17-00 LT). On July 5, 7 and 8, when there was no fog, the air cooling rates for the same time (15-17 LT) were 1.0; 0.6 and 1.0 °C h-1 respectively. The ERA5 data (Figure 5) show that from 10 LT until the end of the day there was convergence of winds in the region, probably due to the northwesterly winds, more intense than the previous day. Wind speed and temperature reached their maximum values at 15 LT (2.5 m s-1 and 22.5 °C). Fog started at 18 LT when the wind speed and temperature were decreasing, and the relative humidity was increasing.
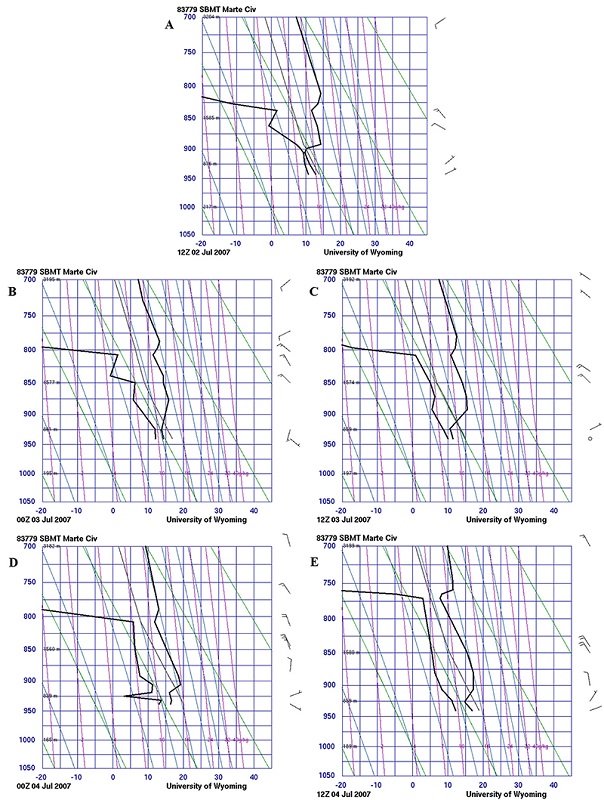
Figure 6
Atmospheric Soundings at Campo de Marte Airport on: A. July 2 at 9 LT; B. 21 LT; C. July 03 at 09 LT; D. 21 LT; E. July 04 at 09 LT.
On this day, the ERA5 wind field (Figure 4B) shows the SB front very near, but it did not reach the EM/IAG. This is probably also due to stronger northwesterly winds. Despite the absence of this source of moisture for the occurrence of fog, it is noted that Td throughout the day was higher than on the previous day (Figures 3 and 5). The EM/IAG is surrounded by vegetation that may have favored this relatively high Td throughout the day and that, with nighttime cooling, led to the formation of fog. At night, in the atmospheric sounding at 21 LT (Figure 6D), a drier layer - compared to the previous day - can be seen close to the ground, and the temperature around 17 °C reflects the daytime heating due to the lack of clouds. Winds measured by the radiosonde on this day were low. Therefore, this fog was also classified as radiation fog, under the influence of SASH.
3.2 July 20, 2007 - Advection fog
There was a fog event from 07-10 LT and mist from 10-14 LT with a total duration of seven hours. This event was selected because it occurred with winds of 3 m s-1 from NE.
A cold front passed through São Paulo on July 15 producing rain in the following days. Another cold front passed between July 18 and 19 with precipitation on these days as well, leaving the surface quite wet. On July 19, in the surface synoptic weather charts (not shown), the center of a PFA of 1020 hPa was on the northeast of the state of São Paulo (SP), affecting part of states of Minas Gerais, Rio de Janeiro, Espírito Santo and east of SP, favoring northerly and northeasterly winds at the EM/IAG region. On the day before the event (19), fog and mist were observed from 07-09 LT, the minimum temperature was 7.7 °C, with many clouds; but the maximum temperature reached 18.7 °C.
On July 20, fog and Stratus clouds were observed between 07 and 10 LT, and mist from 10 to 14 LT, when wind speed reached 5 m.s-1. The temperature increased at a rate of 1.8 °C h-1, from 9.9 to 26 °C between 07 and 14 LT (Just for comparison, this rate was 2.4 °C h-1 on the following day, when there were few clouds, and winds of 2 m s-1 from NE). The relative humidity was greater than 89% during fog and during the mist it ranged from 47-75% (Figure 7). Specific humidity was higher at 11 LT (9.1 g kg-1).
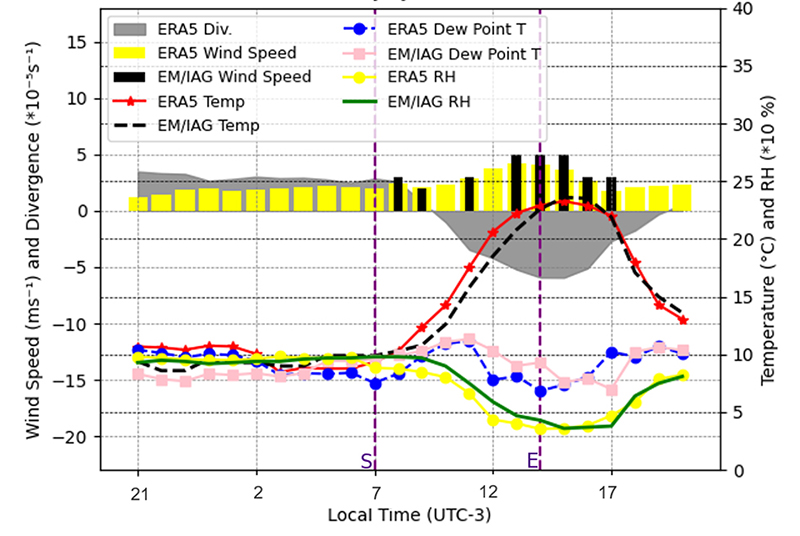
Figure 7
Temporal evolution of Temperature (°C), Dew point temperature (°C), wind speed (m s-1) and Relative Humidity (%) at EM/IAG and ERA5 and Divergence (*10- 5 s-1) from ERA5 for July 20, 2007. The purple dashed line represents the start (S) and end (E) time of the fog event recorded in EM/IAG.
In the ERA5 wind and temperature fields (Figure 8), the transport of moisture can be better perceived, favoring fog formation. In these fields, north/northeast winds can be noticed, advecting colder temperatures and wetter air from Serra da Cantareira, a place with more vegetation and more humid and colder, when compared to the environment in which the EM/IAG is located. From 13 LT, the wind shifted to N and NW, the temperature increased leading to a decrease in the fog intensity. Therefore, the humidity of the rain, caused by the cold front, plus the humidity transported from the Serra da Cantareira and the decrease in temperature led to the occurrence of fog on that day. This fog was therefore classified as advection fog.
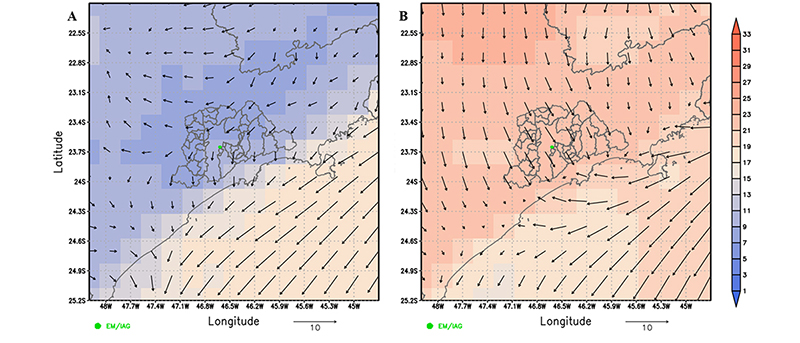
Figure 8
Temperature (°C, shaded) and wind (m s-1, vector) fields from ERA5: A. 07 LT July 20, 2007; B. 13 LT July 20, 2007. The map represents the metropolitan area and state limits of São Paulo and the green dot represnts EM/IAG.
3.3 July 27, 2007 - Advection fog
A mist event was recorded between 18-22 LT. On July 23, a cold front was accompanied by precipitation that lasted for another 2 days. This rain contributed to soil humidification, leaving the dew point temperature higher. Another cold front passed on the 25th, when the 24-hour rainfall was 50.3 mm. On the 26th, there was no precipitation, but mist was observed from 22 LT. On this day, a PFA acted on the region, contributing to radiative surface cooling during the night. The minimum temperature was 8 °C at 23 LT and the maximum was 14.1 °C at 15 LT. On the 27th, the PFA was still influencing the São Paulo region and its center was over Argentina, with a ridge extending to southern Brazil and part of Paraguay (analysis not shown). At 850 hPa the streamlines show a saddle pattern, resulting from the flow of the SASH, the cyclone associated with a front at Rio Grande do Sul state and the PFA in Argentina, and at 500 hPa the flow in São Paulo was from the northwest, being downstream of a trough, with the polar jet at Rio Grande do Sul, associated with the cold front. At 250 hPa, the Subtropical Jet can be seen over the state of São Paulo, bringing clouds from the continent to the coast. There was no record of precipitation at EM/IAG, but drizzle was recorded at the same time as the fog, until 22 LT. In the synoptic analysis on the 28th at 09 LT, the displacement of the PFA is noted, advecting cold air to São Paulo.
In the EM/IAG observations in the morning, in addition to the Stratus clouds there were also other low, medium and high clouds such as Stratocumulus, Altostratus and Cirrus. The PFA circulation could be observed with light east-northeastern winds between 09 and 10 LT. The average air cooling rate was 1.6 °C h-1 before fog formation and 0.5 °C h-1 during its development. Winds were light until 14 LT. Between 14 and 15 LT, the temperature reached its maximum daily value (17.6 °C), but at 15 LT a wind of 3 m s-1 from the southeast blowed, accompanied by a decrease in temperature, and an increase in relative humidity and Td (Figure 9), probably associated with the displacement of the PFA to the east, as identified in the synoptic analysis. From 17 LT the calm condition returned. It is also noted that the relative humidity remained considerably high, practically throughout the day.
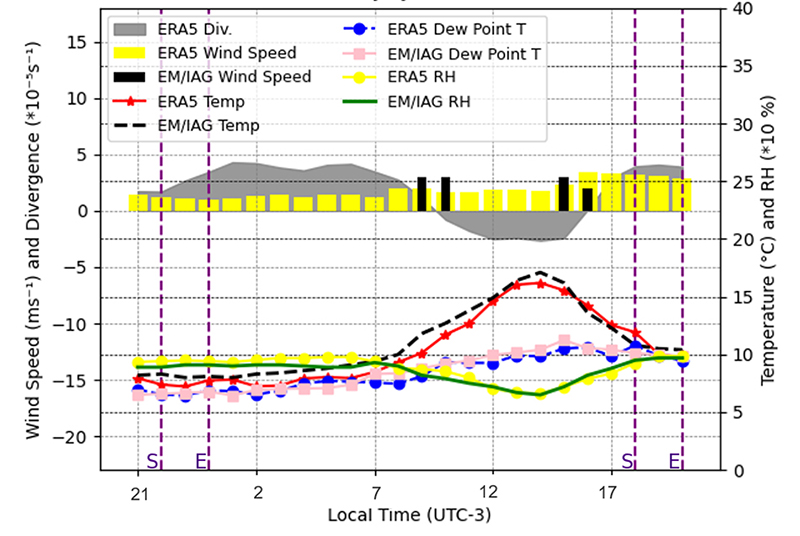
Figure 9
Temporal evolution of Temperature (°C), Dew point temperature (°C), wind speed (m s-1) and Relative Humidity (%) at EM/IAG and ERA5 and Divergence (*10- 5 s-1) from ERA5 for July 27, 2007. The purple dashed line represents the start (S) and end (E) time of the fog event recorded in EM/IAG.
Analyzing the ERA5 grid point data (Figure 9) and wind and temperature fields (not shown), until 09 LT the winds were weak and with an orientation practically from the northeast. From 10 LT they started to intensify and flow from the southeast. As the day went on, the temperature increased from the continent to the coast. At the time that mist was observed, the winds were a little more intense and flowed from the south, and a region of relative humidity greater than or equal to 93% reached the east of the city of São Paulo around 18 LT, covering an extensive area towards the end of the day (Figure 10). This humidity increased from east to west, after a period with higher wind speed (from 15-19 LT approximately). The relative humidity over the ocean showed relatively low values. From the Congonhas airport METAR, mist was also observed with relatively strong wind (8 knots) from the southeast, overcast skies, low visibility and the temperature approaching the dew point temperature. Probably, the cooler and wetter air, coming from the ocean, was advected by the Serra do Mar, by the PFA winds, to the EM/IAG region. On the 28th, it can be noted, both in the EM/IAG data and in the reanalysis data, the intensification of the high-pressure circulation with southern/southeastern winds.
Thus, despite weak winds in the EM/IAG, this event was classified as advection fog, governed by the PFA winds that intensified over time.
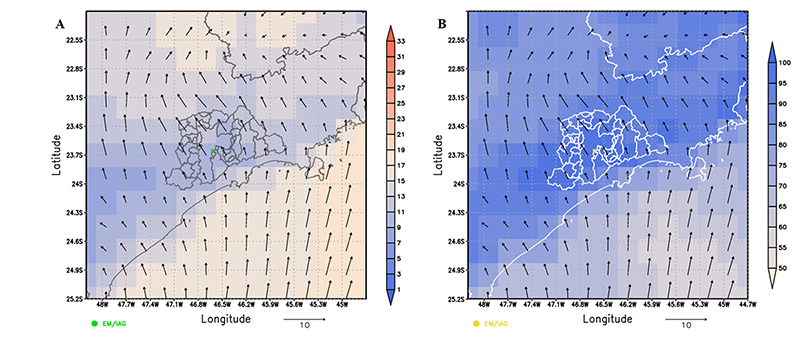
Figure 10
July 27, 2007 at 19 LT data: A. Temperature (°C, shaded); B. Relative humidity (%, shaded) and wind (m.s-1, vector). The map represents the metropolitan area of São Paulo and the green dot represents EM/IAG.
4 Conclusions
EM/IAG data for the period from 1981 to 2015, show that mist and fog are more frequent in winter, with a peak in June, starting more frequently during the night. During the winter of 2007, 49 events of mist/fog were registered, 57% were classified as radiation and 43% advection, with different distribution over the months: June (1 advection and 13 radiation), July (8 advection and 8 radiation), August (12 advection and 7 radiation).
Fog forecasting is very complex, requiring information from synoptic, mesoscale and microscale conditions. For the winter of 2007 at EM/IAG, it was concluded that SASH favored the formation of fog by radiation loss and the moisture was brought by the SB to the observation site, in the beginning of the season; while PFA favored the formation of advection fog at the end of July and August. Pre-frontal situations, with persistent NW winds, do not favor fog formation due to warm dry advection and inhibit SB circulation from reaching the São Paulo plateau. SB contributed with 43% of the radiation fogs and 14% of the advection fogs. PFA contributed to 25% of the radiation fogs and 86% of the advection ones and SASH was present in 32% of the radiation fogs.
The formation and evolution of mist and fog were detailed for four cases. The first, from 18 LT July 2 persisting until 08 LT July 3, and the second, during the night of July 3, had the presence of SASH and, during its observation, no wind. These were then classified as radiation mists. Besides, in the first case, results suggest that it had the contribution of moisture advected by the sea breeze, while in the second, the source of moisture was local, from the environment around the EM/IAG. These scenarios are the most common for radiation mist. Two advection fogs - those that occurred with winds and cloudiness - were also selected. On the 20th, northern/northeastern winds advected cooler and wetter air from Serra da Cantareira to the EM/IAG region. On the 27th, despite the calm winds at the EM/IAG, the analysis of the meteorological fields from ERA5 showed the influence of the post-frontal anticyclone winds that were more intense.
5 References
Armani, G., Funari, F.L. & Haaegely, M.E. 2010, 'Frequência de Nevoeiro na Cidade de São Paulo', IXSimpósio Brasileiro de Climatologia Geográfica, pp. 1-15.
Conde, F.C. & Silva Dias, M.A.F. 2000, 'Caracterização das Condições Atmosféricas Durante a Ocorrência de Nevoeiro em São Paulo: Um Estudo de Caso', XICongresso Brasileiro de Meteorologia, pp. 1867-875.
CPTEC - Centro de previsão do Tempo e Estudos Climáticos2022, Glossários, viewed 02 February 2022, <https://www.cptec.inpe.br/glossario.shtml#n>.
Croft, P.J., Pfost, R.L., Medlin, J.M. & Johnson, G.A. 1997, 'Fog forecasting for the southern region: A conceptual model approach', Weather and Forecasting, vol. 12, no. 3, pp. 545-56, DOI:10.1175/1520-0434(1997)012<0545:FFFTSR>2.0.CO;2.
Da Silva, O.A. 2018, 'Nevoeiro e Nuvem Estratos no Brasil: Observação, Sensoriamento Remoto e Simulação Numérica', PhD Thesis, Universidade de São Paulo, viewed 2 February 2022, <https://www.iag.usp.br/pos/sites/default/files/t_aliton_o_silva_original.pdf>.
Dee, D.P., Uppala, S.M., Simmons, A.J., Berrisford, P., Poli, P., Kobayashi, S., Andrae, U., Balmaseda, M.A., Balsamo, G., Bauer, P., Bechtold, P., Beljaars, A.C.M., van de Berg, L., Bidlot, J., Bormann, N., Delsol, C., Dragani, R., Fuentes, M., Geer, A.J., Haimberger, L., Healy, S.B., Hersbach, H., Hólm, E.V., Isaksen, L., Kållberg, P., Köhler, M., Matricardi, M., McNally, A.P., Monge-Sanz, B.M., Morcrette, J.-J., Park, B.-K., Peubey, C., de Rosnay, P., Tavolato, C, Thépaut, J.-N., & Vitart, F. 2011, 'The ERA-Interim reanalysis: configuration and performance of the data Assimilation system', Quarterly Journal of the Royal Meteorological Society, vol. 137, no. 656, pp. 553-97, DOI:10.1002/qj.828.
Freitas, E.D. & Silva Dias, P.L. 2004, 'Desenvolvimento da brisa marítima sob diferentes situações de grande escala: um estudo de caso', XIIICongresso Brasileiro de Meteorologia.
Hersbach, H., Bell, B., Berrisford, P., Hirahara, S., Horanyi, A., Munoz-Sabater, J., Nicolas, J., Peubey, C., Radu, R., Schepers, D., Simmons, A., Soci, C., Abdalla, S., Abellan, X., Balsamo, G., Bechtold, P., Biavati, G., Bidlot, J., Bonavita, M., Chiara, G., Dahlgren, P., Dee, D., Diamantakis, M., Dragani, R., Flemming, J., Forbes, R., Fuentes, M., Geer, A., Haimberger, L., Healy, S., Hogan, R.J., Holm, E., Janiskova, M., Keeley, S., Laloyaux, P., Lopez, P., Lupu, C., Radnoti, G., Rosnay, P., Rozum, I., Vamborg, F., Villaume, S., & Thepaut, J.-N. 2020, 'The ERA5 global reanalysis', Quarterly Journal of the Royal Meteorological Society, vol. 146, no. 730, pp. 1999-2049, DOI:10.1002/qj.3803.
IBGE − Instituto Brasileiro de Geografia e Estatística 2022, Population estimates, IBGE, viewed 05 August 2022, <https://ftp.ibge.gov.br/Estimativas_de_Populacao/Estimativas_2021/estimativa_dou_2021.pdf>.
Machado, A.J. 1993, 'As circulações locais associadas à formação de nevoeiro na grande São Paulo', PhDThesis, Universidade de São Paulo.
Oliveira, A.P. & Silva Dias, L.P. 1982, 'Aspectos observacionais da Brisa Marítima em São Paulo', IICongresso Brasileiro Meteorologia, pp. 129-61.
Perez, G.M.P. & Silva Dias, M.A.F. 2017, 'Long‐term study of the occurrence and time of passage of sea breeze in São Paulo, 1960-2009', International Journal of Climatology, vol. 37, no. S1, pp. 1210-220, DOI:10.1002/joc.5077.
Primault, B. 1979, 'Wind measurement’, in J. Seemann, Y.I. Chirkov, J. Lomas & B. Primault (eds), Agrometeorology, Spring-Verlag, Heidelberg, pp. 85.
Reboita, M.S., Gan, M.A., Rocha, R.P. & Ambrizzi, T. 2010, 'Regimes de precipitação na América do Sul: uma revisão bibliográfica', Revista Brasileira de Meteorologia, vol. 25, no. 2, pp. 185-204, DOI:10.1590/S0102-77862010000200004.
Sinclair, M.R. 1996, 'A climatology of anticyclones and blocking for the southern hemisphere', Monthly Weather Review, vol. 124, no. 2, pp. 245-64, DOI:10.1175/1520-0493(1996)124<0245:ACOAAB>2.0.CO;2.
Willett, H.C. 1928, 'Fog and haze, their causes, distribution, and forecasting', Monthly Weather Review, vol. 56, no. 11, pp. 435-68, DOI:10.1175/1520-0493(1928)56<435:FAHTCD>2.0.CO;2.
WMO − World Meteorological Organization 2010, Manual on the Global Observing System. Volume I: Global aspects, Chair, Publications Board, Geneva, Switzerland, viewed 05 August 2022, <https://www.met.gov.fj/icao/volI.pdf>.
Funding information
Data availability statement
Author notes
E-mail:bre.alm.san@gmail.comE-mail:rita.ynoue@iag.usp.br
Conflict of interest declaration