Article
Received: 30 August 2022
Accepted: 07 January 2023
DOI: https://doi.org/10.11137/1982-3908_2023_46_54245
Abstract: This paper presents the development of a QGIS plugin to support evaluating the planimetric positional quality for point and linear features based on the metrics established by Brazilian legislation. For this purpose, we used the QGIS environment Graphical Modeler, which consists of an interface to concatenate a series of processes into a single algorithm. The set of tools, called QPEC, allows for performing the statistical tests from the automatic identification of the sample size and discrepancies. In order to demonstrate the implemented functionalities, a case study was carried out. In this illustrative example, the vector files from the Cartographic and Cadastral System of the Municipality of Salvador - BA (SICAD) were the reference data, and their homologous OpenStreetMap (OSM) features were the analysed database. The results obtained are presented in the attributes table. In addition, the spatial distribution of the discrepancies is visualised through the visual variable colour value in a quartile classification. The creation of this toolset corroborates the feasibility of developing more visual, automated and complete interfaces to support users of geospatial data in analysing the quality of the information available, especially when it involves free applications with open-source code.
Keywords: Planimetric positional accuracy, QGIS plugin, Python.
Resumo: Este documento apresenta o desenvolvimento de um plugin de QGIS para apoiar a avaliação da acurácia posicional planimétrica para feições pontuais e lineares, com base nas métricas estabelecidas pela legislação brasileira. Para este fim, utilizamos o Modelador Gráfico no ambiente QGIS, que consiste numa interface para concatenar uma série de processos num único algoritmo. O conjunto de ferramentas, denominado QPEC, permite realizar os testes estatísticos a partir da identificação automática do tamanho da amostra e das discrepâncias. A fim de demonstrar as funcionalidades implementadas, foi realizado um estudo de caso. Neste exemplo ilustrativo, os arquivos vetoriais do Sistema Cartográfico e Cadastral do Município de Salvador - BA (SICAD) foram os dados de referência, e as suas feições homólogas no OpenStreetMap (OSM) foram a base de dados analisada. Os resultados obtidos são apresentados na tabela de atributos. Além disso, a distribuição espacial das discrepâncias é visualizada através da variável visual valor de cor variável em uma classificação em quartis. A criação deste conjunto de ferramentas corrobora a viabilidade do desenvolvimento de interfaces mais visuais, automatizadas e completas para apoiar os usuários de dados geoespaciais na análise da qualidade da informação disponível, especialmente quando envolve aplicações gratuitas com código-fonte aberto.
Palavras-chave: Acurácia posicional planimétrica, Plugin para QGIS, Python.
1 Introduction
The union, states, and municipalities need geospatial information to represent the territory. Unfortunately, many cartographic products are delivered with an unclear quality due to non-adherence to standards and legislation and the immediate use perspective, thus opposing the reuse of geospatial data. The lack of experience and knowledge on the quality issue reinforces these. Most of the time, quality assurance occurs when professionals use data in their activities and compare it with the geospatial reality (Silva Júnior, França & Moraes 2022; Pedreira, Oliveira & Santos 2020; Luz & Antunes 2015).
In territorial planning, the execution or management of any public or private project, it is essential to work with consistent, organised, and current information. In public institutions, Cartography provides information for public policies governed by legislation, standards, and technical specifications that guarantee the reliability of cartographic products. In Brazil, for example, the Brazilian standard for assessing the positional accuracy of geospatial data is given by Decree-Law nº 89,817 of 1984 (Brasil 1984). This standard was called the Cartographic Accuracy Standard (PEC). It was updated to Cartographic Accuracy Standard for Digital Cartographic Products (PEC PCD) in one of the topics of the Technical Specification for the Acquisition of Vector Geospatial Data - ET-ADGV (DSG 2011), created by the Brazilian Army Geographic Service Directorate (DSG) in 2011. In 2016, DSG developed the Technical Specification for Quality Control of Geospatial Data - ET-CQDG (DSG 2016b), which establishes methodologies for assessing the quality of geospatial data based on the International Organization for Standardization (ISO) 19157 (ISO 2013). Further details regarding the PEC PCD are presented in section 2.
ISO 19157 (ISO 2013) assigns the indicators for evaluating geospatial data. These present the following indicators: Positional Accuracy, Thematic Accuracy; Completeness; Logical Consistency, Temporal Quality, and Usability. Among these indicators, positional accuracy is the main characteristic to be considered as it refers to the ability of a device, or a method, to estimate the position (latitude and longitude) of a feature on the earth's surface. (Roberto 2013). Furthermore, the presence of random errors (precision) and systematic errors (trends) in the measurements is taken into account (Monico et al. 2009).
It is necessary to recognise the impossibility of making any free-of-error cartographic product. User satisfaction is also a challenging and laborious dimension to measure. With the popularisation of the Global Navigation Satellite System (GNSS) and the access to maps through digital globes such as Google Earth, among others, cartographic information has been widely used in the development of applications and incorporated into a series of tools and systems. In recent years the need to know the quality of the products has increased. The automation of processes expands the range of uses of geoinformation and, in some ways, helps to minimise some types of errors, but on the other hand, it may assume previous knowledge about the data sources and the various processes applied to them that are not so common among all users.
Geospatial data quality is essential in map production, whether for general purposes or to represent thematic aspects. In the classical view, official map agencies generate reference maps to represent all visible features in the landscape (Keates 1973) and general-purpose territorial features in ways that serve a variety of uses and users through the simultaneous presentation of various themes (Kent 2009). This method was considered the primary way to produce maps until recently (Elwood, Goodchild & Sui 2012). However, computational technological advances have allowed anyone with a computer or smartphone with internet access to generate geoinformation (Ganapati 2011).
The increase in geospatial information volume, variety and velocity is associated with big data. This currently data-intensive landscape, known as Big Data, covers the flow of data in digital media from different sources, such as numerical modelling, smartphones, internet access, and social networks (Yang et al. 2017). In this aspect, Robinson et al. (2017) point out challenges regarding representation, user context, and updates that constantly occur rapidly. This aspect can be evidenced in Volunteered Geographic Information (VGI) platforms because the user's participation allows the data to be updated and made available in real time. This method is a supplementary alternative to the traditional availability of cartographic products, usually coming from the agencies responsible for national cartography.
Currently, there are several methods for obtaining geospatial data, ranging from topographic and aerial photogrammetric surveys to VGI. Thus, efficient treatment and integration in the volume of data become essential. In this scenario, methodologies arise to extract, integrate and evaluate the quality of the relevant information from this ever-increasing amount of geographic data (Brovelli et al., 2019). In the context of geospatial data quality, although methodologies with efficient statistical and theoretical approaches exist, the speed with which information is obtained in real-time and the availability of open data requires free software tools that assist users in these assessments. Furthermore, in the methods used to assess quality, criteria must be established to spatially represent the results and consider the different sources and heterogeneity of the data. Assessing the quality of geospatial data is to investigate the veracity of the information through processes to measure and document divergences, including them, when possible, in cartographic products.
It is essential to point out that there are studies focused on positional quality that start from the establishment of different statistical criteria for carrying out the tests, the implementation of computational tools aimed at automating the process to validations performed on geospatial data obtained from different sources. Among these studies, the works by Lisboa et al. (2019); Cunha et al. (2019); Santos et al. (2016); Cintra and Nero (2015), Galo and Camargo (1994) and Merchant (1982). The theme of these works concerns the establishment of different statistical methods for determining positional accuracy based on sample sets. Furthermore, concerning implementing tools for the automatic assessment of positional quality, it was noted that there are efforts to verify data from VGI. This characteristic can be evidenced in works such as Mozas-Calvache and Ariza-López (2019); Martini, Kuper and Breunig (2019); Brovelli and Zamboni (2018); Zhou (2018) and Brovelli, Minghini and Molinari (2016). Within the scope of geospatial data services available on the web, there is the research by Silva Júnior, França, and Moraes (2022) that evaluated the planimetric positional accuracy of Google Earth images. In research by Pedreira, Oliveira, and Santos (2020) and Pessoa et al. (2021), for example, the altimetric positional accuracy of a Digital Elevation Model (DEM) generated from a UAV was evaluated respectively. The positional error of Digital Surface Models (DSM) obtained in the post-processing of data acquired with UAV concerning the number and distribution of control points on the ground.
Regarding developing applications in geospatial data quality, extensive research has focused on creating open-source tools to compare cartographic products. The objective is to evaluate the positional discrepancies and data behaviour through statistical tests and reported errors. García-Balboa, Ureña-Cámara and Xavier (2021), for example, developed a web application, ICPos, in which it is possible to evaluate the positional accuracy based on the insertion of control points using different quality standards. As highlighted by the authors, in ICPos, it is possible to calculate and automatically create a complete report for the input data according to the user's specifications. Besides ICPos, researchers such as Zanetti et al. (2016), Soares et al. (2018) and Barbosa, Silva and Santos (2021) evaluated the positional accuracy of features from the GeoPEC software. GeoPEC, developed by researchers at the Federal University of Viçosa, Brazil, allows the evaluation of the positional accuracy of cartographic products based on the PEC PCD from the insertion of coordinates of point features. It also allows for statistical tests associated with sampling, normality and identification of data error trends.
Santos (2015) and Santos et al. (2016) developed models in the ArcGIS Model Builder tool to obtain discrepancies between linear features from different methods. Teixeira and Santos (2019) developed similar applications in QGIS and compared the magnitude of the discrepancies obtained. Foz et al. (2021) also implemented quality control processes in cartographic series updating from GIS and Computer Aided Design (CAD) data combination.
It is possible to notice that the presented tools emphasise the discrepancies' calculation and statistical analysis of a specific sample. Unfortunately, complete GIS applications in this context are still scarce. It would be helpful in these solutions to enable the entry of layers and simultaneously display quality spatial behaviour maps and the attribute table classification values, according to the statistical analysis performed. In this way, this work aimed at developing QGIS 3.X software tools to evaluate the positional accuracy of punctual and linear features. For the point features assessment, it implements the methods of Merchant (1982) and Galo and Camargo (1994), combined with the conditions established by the ET-CQDG (DSG 2016b). For the linear features, it applied the double buffer method developed by Santos (2015). Section 2 details the application of the explained methods.
2 Methods for the Assessment of Planimetric Positional Accuracy of Geospatial Data in Brazil
In Brazil, the first documentation that addressed positional accuracy in cartographic products referred to Decree-Law nº 89,817 - Technical Norms of National Cartography (Brasil 1984). Criteria for accuracy and distribution of errors were established based on a statistical indicator of positional quality called the PEC. The PEC classifies the products into three groups, called A, B, and C, where in class A, there is greater rigour in the evaluation of the cartographic product, and in class C, there is less rigour. The norm establishes the PEC value for each class, and each value is associated with a Standard Error (EP). The EP of each class is 60.8% of the PEC (EP = 0.608*PEC), which corresponds to a 90% probability in the normal distribution. There are values for both planimetric and altimetric evaluation.
In 2011, the DSG created the ET-ADGV specification (DSG 2011). The purpose of this norm is to update the standard in Decree-Law nº 89,817 (Brasil 1984) since it no longer meets the current needs of digital mapping. In addition, the ET-ADGV (DSG 2011) established a new statistical indicator, the PEC-PCD. This indicator has the same premises as the PEC. In addition, however, a new class was added, and the cartographic products were classified into A, B, C, and D.
PEC-PCD is associated with the scale of cartographic products and allows them to be classified by the discrepancies found in a sample of points. It is a statistical indicator where, from the probabilistic graph of normal distribution, 90% confidence is considered. It is worth noting that the DSG has already developed two more recent versions of the ET-ADGV in 2015 and 2016, called the Technical Specification for the Acquisition of Geospatial Data Vector for Defense of the Land Force - ET-ADGV (DSG 2015; DSG 2016a) in which aspects associated with the PEC-PCD are also addressed. Table 1 presents the values established in the PEC, the planimetric PEC-PCD, and the Planimetric Standard Errors (EP) associated with them.
Cartographic Accuracy Standard for Cartographic Products. Source Adapted from ET-ADGV (DSG 2011).
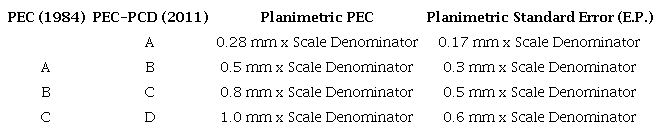
As shown in Table 1, classes A, B, and C of the PEC started to be called B, C, and D of the PEC-PCD, respectively, and a new class A was added. It is also possible to note that values are associated with the desired scale, that is, to find the value of the PEC and EP at a given scale, the values in Table 1 are multiplied by their denominator, and the analysis continues.
In 2016, the DSG created the ET-CQDG (DSG 2016b), which covers methodologies for quality assessment in cartographic products considering similar indicators and definitions to those addressed by ISO 19157 (ISO 2013). Regarding positional accuracy, the ET-CQDG (DSG 2016b) provides for calculating Euclidean Distances (DE) from a sample of homologous points between the reference cartographic product and the evaluated one. After obtaining the DE, to find the classification of the cartographic product on a given scale, two conditions are evaluated: whether 90% of the DE is less than or equal to the PEC PCD value and if the Root Mean Square Error (RMSE) error is less than or equal to the EP.
It is essential to highlight that, in addition to the procedures established for the evaluation of planimetric positional accuracy established in the ET-CQDG (DSG 2016b), in the ET-ADGV (DSG 2011), and Brasil (1984), there are statistical procedures provided for in the literature, such for example, the method proposed by Merchant (1982). This method was adapted by Galo and Camargo (1994) so that there was a statistical connection with the PEC, allowing cartographic product classification based on trend and precision analysis. The Student t-test gives the trend analysis. It allows for identifying error trends in some of the cartographic products evaluated. Furthermore, it verifies whether the mean of a set of discrepancies can be considered statistically equal to zero (null hypothesis). In this context, the sample t-value based on the discrepancies of each sample feature is calculated by Equation 1 as follows:
In Equation 1, and Sx, and n are equivalent to the discrepancies' mean, standard deviation and sample size. The analysis compares the calculated t-value to a tabulated one in t-student distribution. The tabulated t-value is based on the sample size and significance level "a/2", which has (n - 1) degrees of freedom, as shown in Equation 2.
Thus, if the module calculated for the sample "t" (Equation 1) is less than or equal to the tabulated "t" value, the null hypothesis is accepted, i.e., the cartographic product can be considered free of significant trends. On the contrary, the null hypothesis is rejected if the inequality is not satisfied. Since the PEC PCD corresponds to a statistical indicator with a 90% confidence probability, the "t" value is calculated considering this confidence level.
The chi-square statistical test gives the precision analysis. It allows for comparing the variance obtained in a set concerning the EP of the PEC-PCD. The null hypothesis is that the variance is statistically smaller than the EP. This comparison allows for classifying the cartographic product according to Table 1. The EP is assumed as the resultant of the two planimetric components. Considering that the trend analysis is obtained for each component of the X and Y coordinate system, this value can be calculated from Equation 3.
With the value obtained in Equation 3, the sample chi-square test is applied to verify if the discrepancies' standard deviation can be considered statistically equal or smaller than the assumed EP for a given PCD PEC class. Equation 4 gives the calculation of the sample chi-square:
The output from the operation of Equation 4 is compared to the tabulated chi-square value to test whether the test's null hypothesis is satisfied. This comparison is made based on Equation 5.
The tabulated chi-square has (n - 1) degrees of freedom and confidence interval α. It is verified if the expression of Equation 5 is true within a dispersion indicator of 90% (Nogueira Jr. 2003; Galo & Camargo 1994). This procedure is performed based on the expected EP for a given class of the PEC PCD. If the condition is not satisfied, the lower class is tested until its acceptance, and the sample can be classified.
Despite the time lag of the analysis established by Merchant (1982) to the criteria established by the ET-CQDG (DSG 2016), several studies to evaluate positional quality in geospatial data in Brazil still use its statistical tests for trend and precision. These tests show the trend of errors, their directions, and the variance around the sample set mean. An example is the work of Oliveira & Brito (2019). In addition, Santos (2015) states that several countries' cartographic standards base positional quality assessment on methodologies comparing homologous points. Nogueira Jr. (2003) and Pereira and Nero (2012) also identified this aspect.
According to Tong et al. (2013), studies evaluating the positional accuracy of linear features have increased in interest as an object of study by the scientific community. Studies carried out by Santos (2015) show that homologous lines between the reference cartographic product and the product to be evaluated are analysed to evaluate the positional quality of linear features. Also called Buffer Overlay Statistics, the double buffer method was proposed by Tveite and Langaas (1999). It concerns the application of the Error Band model to the reference vector elements and their counterparts to be tested. This model creates a range in the linear reference feature, characterised as the most likely position (Santos 2015). The model generated for the uncertainty range is the application of a buffer around the evaluated line segments to establish their positional uncertainty.
Santos (2015) establishes a sequence of methodological steps for evaluating the positional accuracy of linear features from the double buffer method in association with the parameters established by Decree-Law nº 89,817 (Brasil 1984). The steps for applying the double buffer method are as follows:
a) Select a sample with n homologous test (LT) and reference (LR) lines;
b) From the selected linear features, apply a buffer of size x in each line i of the LT and LR sample. The buffer size is used as the PEC PCD value for the scale and class used in the evaluation process, following Decree-Law nº 89,817 (Brasil 1984),
c) Calculate the buffer area in each LT;
d) Overlap the LT and LR buffers and calculate the value of AF, which is the LR buffer area that does not intersect the LT buffer;
e) Calculate the Mean Discrepancy (DM) for each test line i by applying Equation 6;
f) For alignment with the parameters established by Decree-Law nº (Brasil 1984), it is evaluated if 90% of the tested lines have DM smaller or equal to the PEC PCD value (of the class and scale used to generate the buffer x), and also, if the RMSE of the DMs is smaller or equal to the EP value (also to the PEC PCD). The sample is classified according to the class and scale evaluated if both conditions are satisfied.
Figure 1 shows an example of the generation of polygons resulting from homologous linear features from applying the Double Buffer method.
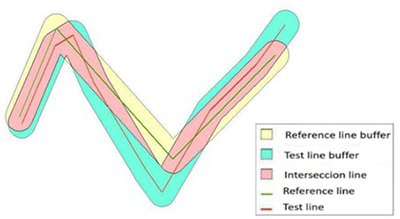
The conditions used are similar to those described in ET-CQDG (DSG 2016b). Instead of the DE of each point feature, it calculates a Mean Discrepancy (DM). A mathematical operation divides the area of the reference buffer that does not intersect the evaluated buffer for the total area of the evaluated buffer. The result of this division is multiplied by the size of the applied buffer and by π. The buffer size must be related to the value of the PEC-PCD on a given scale, allowing the analysis to proceed.
3 Methodology and Data
The present study developed two tools in QGIS 3.X software, one for assessing the positional accuracy of point features and the other for linear features. The tools were developed from pre-existing processes in QGIS through the Graphical Modeler, where it is possible to concatenate a series of operations in a single analysis and develop an interface. The model created is stored and can be exported in the python programming language. QGIS field calculation processes form the bulk of the procedures used. The attribute table of the analysed layer is populated with the result of area and discrepancy calculations and the conditional classification based on the available quality assessment methods. This conditional sorting was performed by scripts using a SQL-like language. The initial calculations and statistical analysis elements were derived from the entry features. The initial values are the X and Y coordinates for point features, used to calculate the main parameters: count, mean and stdev (Standard Deviation) and sqrt (Square Root).
Besides the mathematical operations, the buffer of each pair of features was obtained in the case of linear features. The intersections between their areas were sufficient for the statistical procedures. Figure 2 shows an example of a condition script used in constructing one of the tools.
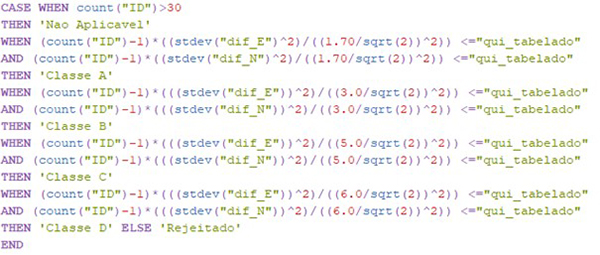
Figure 2
Example of inserting a condition in the QGIS field calculator using the Model Builder to consult information regarding a given sample of points.
The example described in Figure 2 refers to applying the chi-square test for a sample of point features at a scale of 1:10,000. First, the result is calculated based on Equation 3, and the value found is compared with tabulated information of the referred test. Then, using conditionals "CASE", "WHEN", and "THEN", the PEC PCD classes were tested until all of them were accepted or rejected at the evaluated scale.
The methodological steps used in this work correspond to the statistical tests of Merchant (1982) and Galo and Camargo (1994) for the punctual features, as well as the application of the methodology proposed by the ET-CQDG (DSG 2016b) to apply the PEC PCD. In addition, the double buffer method was applied to the linear features, as Santos (2015) and Santos et al. (2016) described. Both approaches were presented in section 2.
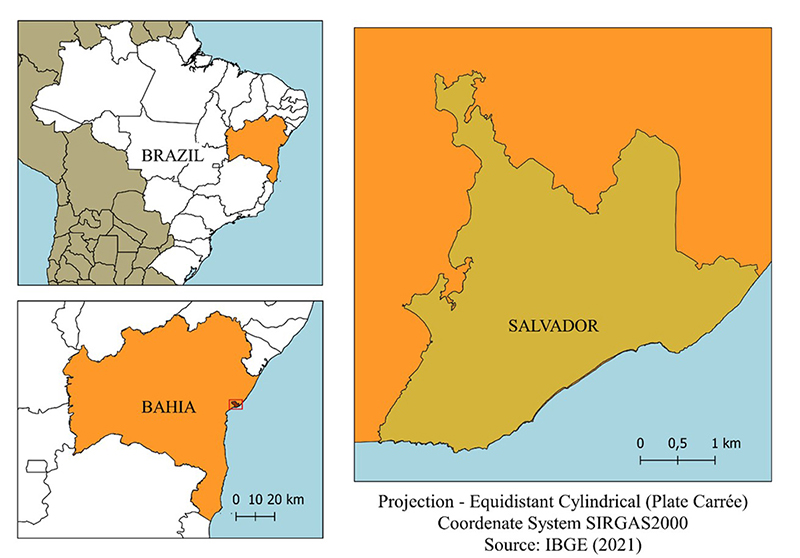
Sets of point and linear feature samples from Salvador-BA were used, with 20 features for each. Reference data were extracted from reference vector files from the 2006 Cartographic and Cadastral System of the Municipality of Salvador (SICAD). The homologous features evaluated corresponded to data obtained from the OSM collaborative mapping platform. The datasets were obtained circa April 2018 and integrated a series of analyses carried out by Elias and Fernandes (2021) for the OSM geospatial data quality assessment in Salvador-BA. According to the authors, the number of features available in the period exceeded 27,500. The choice of sample size was based on criteria adopted by Merchant (1982), where 20 features in a given area are sufficient to assess cartographic product quality. It is worth mentioning that the ET-CQDG (DSG 2016b) already establishes a series of advanced sampling criteria, which are based on ISO 19.157 (ISO 2013), where procedures are described as a function of the size of the area (lots). However, since this is not the focus of this work, the statistic considered by Merchant (1982) was adopted.Figure 3 displays the study area location map.
3.1 Planimetric Positional Accuracy of Point Features
The methods used to assess the positional accuracy of point features corresponded to the statistical tests established by Merchant (1982) and Galo and Camargo (1994) and the constraints established in the ET-CQDG (DSG 2016b). In addition, each of these methods had a specific flow developed. Also, before entering the data to perform the computations, an initial step that must be performed is the selection of feature samples-the tool analyses each planimetric component of the coordinates pair evaluated. Figure 4 shows the flowchart for assessing positional accuracy in point features.
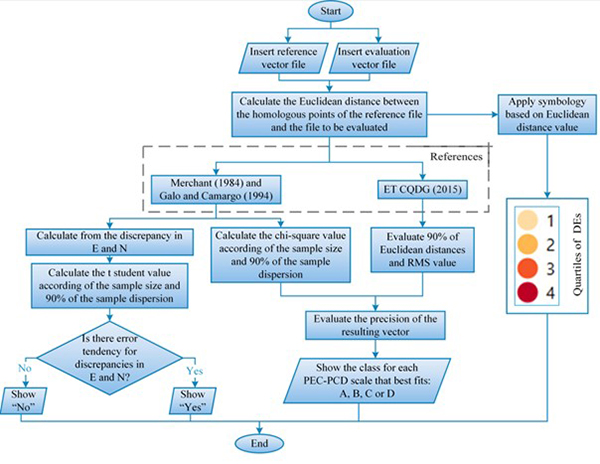
Figure 4
Operational flowchart for assessing positional accuracy in point features using the methods of Merchant (1982) and Galo and Camargo (1994).
As shown in Figure 4, the vector layer of the reference point features and their respective counterparts to be evaluated must be previously inserted in the QGIS software in metric coordinates. Since these are point features, this configuration allows us to obtain the discrepancies, calculate the DEs in meters, and apply the PEC PCD definitions. Reference files can be, for example, points obtained from mapping techniques or indirectly from a cartographic product whose positional quality is known. In addition, reference and evaluated files must be associated with the same "ID" value in the Attributes Table to perform operations on homologous features.
The method of Merchant (1982) and Galo and Camargo (1994) evaluates the existence of a trend in the North and East directions. The sample size of each input file of 30 features follows the valid recommendations for the Student t-test, which, according to Barbetta (2005), this test is ideal for small samples. Oliveira and Brito (2019) also considered this aspect in the analysis. For samples bigger than 30, the message "Not Evaluated" will be displayed, and the test will not be performed.
This threshold used for the sample size was established according to the premises of the mentioned statistical method. In samples where the number of elements is greater than 30, for instance, the z test (Normal Distribution) must be applied, which will be implemented in the future to complement the tools developed. Besides, it is vital to comment that the minimum number of 20 elements refers to the quantity established by Merchant (1982) for evaluating the positional accuracy of cartographic products. This value was established in the sample selection to validate the developed tools that could be higher or lower based on the user's needs. As discussed above, if the t Student test is chosen and the sample size exceeds 30, the statistical analysis will not be performed.
After meeting the sampling criterion, the tools calculate the discrepancies between the coordinates in the East and North directions, the DE, and the values referring to the t Student and Chi-Square. These values are necessary for testing the conditions, verifying trends in the features, and classifying the cartographic product according to each PEC PCD scale.
In the ET-CQDG (DSG 2016b), the sampling premises are based on the total number of features available and the breakdown of the study area into regularly spaced grid squares. In addition, the standard provides a maximum threshold of unaccepted features for a given sample to be accepted. However, the statistical approach of the PEC PCD, different from what is described for the Student t-test, is not restricted to a minimum sample size. For this reason, the developed application does not establish a threshold for the number of features inserted when choosing this method. Finally, complying with described requirements, the script calculates the SD for each feature and uses the results to compute the samples' RMSE.
In the next step, the algorithm tests two conditions for each PEC PCD class and scale: if 90% of the Euclidean distances are smaller than the PEC and if the RMSE value is smaller than the EP. If these conditions are met, the routine displays the class in which the samples conform to the desired scale. Otherwise, the value displayed is: "rejected".
3.2 Planimetric Positional Accuracy of Linear Features
The methodology for evaluating positional accuracy in linear features was based on the double buffer method, presented in item 1. The basic principle consists of creating buffers in linear features with a size equal to the values associated with the PEC PCD in the scales established by the ET-ADGV (DSG 2011) (1:1,000, 1:2,000, 1:5,000, 1:10,000, 1:25,000, 1:50,000, 1:100,000 and 1:250,000). The user can then choose the scale with which to determine the PEC PCD, and when running the process, each class displays the result of the conditionals that are part of the algorithm. It is relevant to mention that the scales used here are the standard ones of the Brazilian systematic mapping, addressed in the ET-CQDG (DSG 2016b) and ET-ADGV (DSG 2011). Figure 5 shows the tools' functions for assessing linear features' positional accuracy.
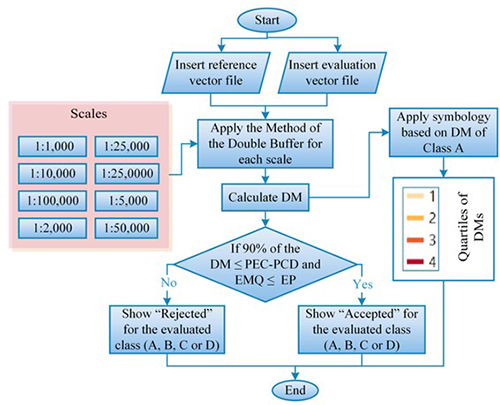
Figure 5
Operational flowchart of the tools for assessing positional accuracy in linear features according to the scales established in the ET-ADGV.
As shown in the flowchart in Figure 5, the user must indicate the desired scale and the vector layers with the linear reference features and those under evaluation. Such layers must be in projected coordinates, and homologous line pairs must have corresponding ID values. Such layers must be in projected coordinates, and homologous line pairs must have corresponding ID values. The input data conditions are the same as those established for point features. The choice of scale allows us to apply the buffer to each linear feature and calculate the DM. The DM is calculated for each PEC-PCD class on the chosen scale. For each class, the conditions set for the method are tested. If 90% of the DM is less than the PCD PEC, and if the RMSE value is less than the EP, the value "Accepted" will be registered. Otherwise, it will be "Rejected".
In addition to evaluating the positional linear feature quality from the choice of one of the PEC-PCD scales, we have implemented a model using the double buffer method. n this application, the user supplies the value of the buffer to be evaluated, and then the PEC-PCD scales and classes are obtained relative to the supplied value. The flowchart in Figure 6 shows how this tool works.
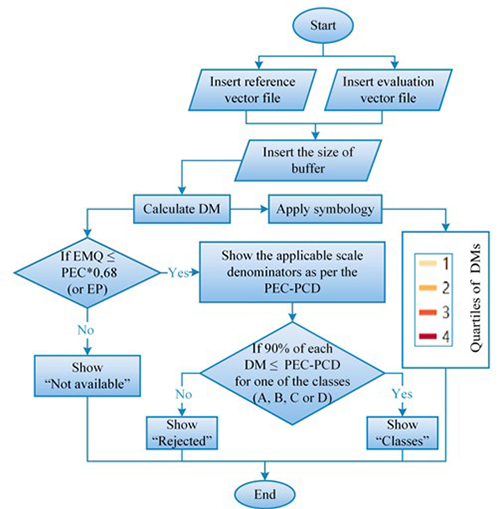
Figure 6
Functioning of the tool for evaluating the positional accuracy of linear features from inserting the buffer size.
In this tool, in addition to inserting reference and evaluated vector files, the desired buffer size is also inserted for performing the analyses, as presented in section 2 above. In this case, it is essential to note that the buffer distance represents the user's desired tolerable error for the verification. This value enables the calculation of the range of standard scales of the PEC-PCD will be considered. For example, if a value of 20 meters is entered, the possible scales are 1: 25,000 and 1: 50,000. Once the scales are selected, whether the calculated RMSE is in the EP range of each scale is evaluated. If it does, it is possible to proceed with the remaining steps.
After verifying if the buffer entered by the user conforms to any test scale, the next step is to check if there is any PEC PCD class (A, B, C or D) in which the sample is accepted. Otherwise, the message "Not applicable" is displayed. Then, the DM of each feature is calculated and tested. This step verifies if 90% of DM's are less or equal to each class' value in the PEC PCD. This analysis is performed simultaneously with the RMSE verification; it is also necessary to be less than or equal to the EP of the evaluated class. As previously presented, this metric is associated with the PEC PCD EP corresponding to this percentage. If this condition is met, the class found will be shown. Otherwise, the message "Rejected" will be displayed.
Another significant characteristic of these tools is the ability to generate cartographic representations to visualise the results of the analysis of the quality parameters. In this aspect, the flowcharts of Figures 4, 5 and 6 show that the representation of the positional accuracy applied to the result uses a sequential colour scheme based on the values of DE or DM (in the case of linear features), classified into quartiles. The tools with the developed codes are stored on GitHub (Elias 2022; Elias 2019).
4 Results and Discussion
From the methodology procedures applied, the tools developed show to be promising since the positional accuracy of punctual and linear features in QGIS can be obtained, selecting the desired statistical test or analysis and visualising the behaviour of discrepancies in a given region. Therefore, in addition to the results obtained for the evaluated samples, application-related aspects are provided in this item. Figure 7 shows one of the interfaces running on QGIS.
This interface evaluates the ET-CQDG (DSG 2016b) method, so the user can insert the reference and evaluated vector files and save the resulting vector file. In addition, a brief description of the algorithm was also inserted to understand the process better. It is essential to highlight that the interfaces built for the other methods presented a structure similar to that of Figure 7.
The classifications obtained according to the PEC-PCD are presented in QGIS Attributes Table, both for punctual and linear features, according to specifics of each tool, presented with flowcharts in item 2. Figure 8 shows an example from the Table of attributes obtained with the results in assessing the positional accuracy of point features using the ET-CQDG (DSG 2016) method. Although the results in Figure 8 presented rows of each sample feature, these are equivalent to the final global analysis performed from the combination of the whole set. Such an approach justifies that all values in each column, except for DE, present the same answer. In this context, the sample was rejected on 1:1,000, 1:2,000 and 1: 5,000. On scales 1:10,000 and 1:25,000, classes D and B were achieved, respectively, and from 1:50,000, class A was obtained.
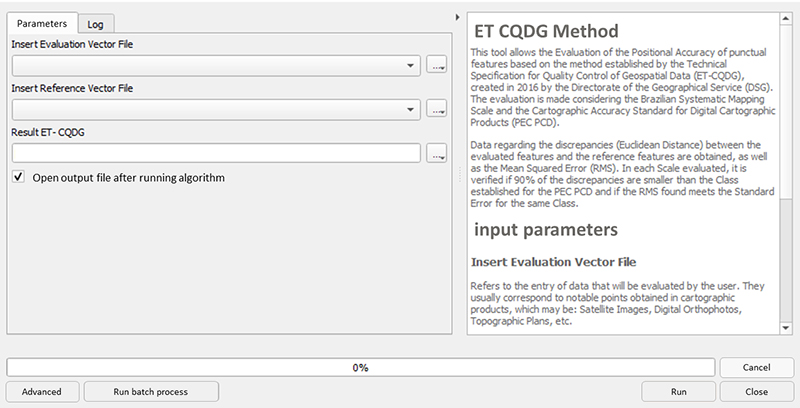
Figure 7
Interface for assessing positional accuracy of linear features using the ET-CQDG (DSG 2016b) method.
In the example shown in Figure 8, it is possible to notice that the Attributes Table shows the results referring to the DE of each feature, the RMSE, and the corresponding class for each PEC PCD scale. It is worth mentioning that in the other tests, the results are presented similarly, each with particularities. For example, in the evaluation of linear features by the PEC PCD scale (Figure 5), the classes (A, B, C, and D) are displayed as results and for each one, "Accepted" or "Rejected" is displayed.
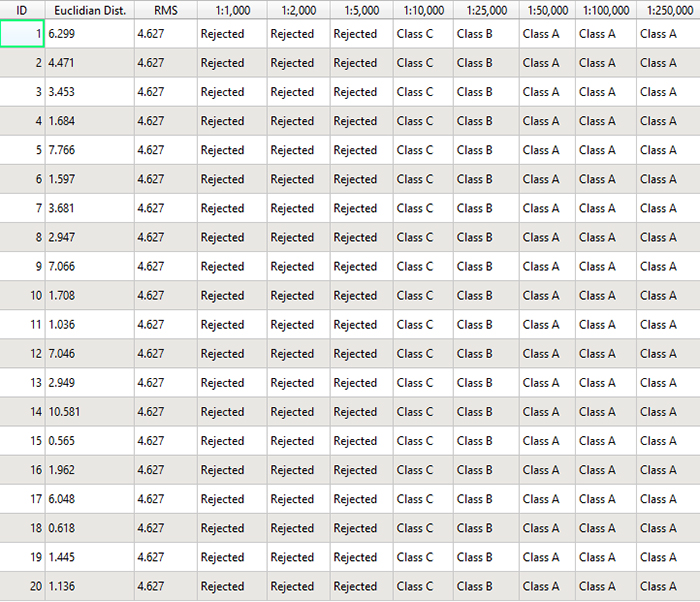
Figure 8
Example with the results obtained in the Table of attributes from the ET-CQDG (DSG 2016b) method.
The input data for evaluating the point and linear features are the reference data from the SICAD database and the evaluated data from OSM. Vertices of pavements and curbs were the punctual features, and the linear features, in their entirety, were formed by road axes. With a significance level of 90% in the punctual features, the PEC PCD value for class A corresponded to 14 m and EP of 8.5 m. In classes B and C, these values were 7 m and 4.25 m and 2.8 and 1.7 m. With the same significance level of 90% for the linear features, class A was reached at the scale of 1:25,000, corresponding to a PEC PCD of 14 m (buffer size) and EP of 8.5 m.
Such values are valuable because they guide the decision-making by managers and users for specific applications based on the quality of the available data. Moreover, they make it possible to determine how statistically accurate they are when evaluated together. Tables 2 and 3 present the samples' point and linear features results.
Results obtained for assessing positional accuracy in point features.
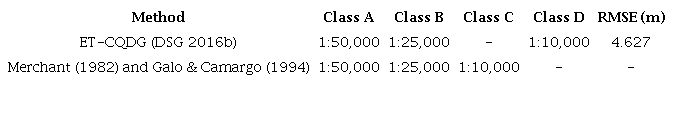
Results obtained for assessing positional accuracy in linear features.

As shown in Table 2, different methodologies to assess positional quality in point features allowed us to highlight aspects related to the similarities and differences in obtaining the results. For example, when performing analyses from the ET-CQDG (DSG 2016b) and the Decree-Law nº 89,817 (Brasil 1984), on a scale of 1:10,000, the sample was classified as PEC PCD D class. On the other hand, this same scale is classified as C when using Merchant (1982) and Galo and Camargo (1994). Furthermore, it was considered as a weighting factor that, with this method, it is possible to assess the existence of errors, which allows for obtaining more conclusive results from the evaluated sample. Although it is not the focus of this article to study the different characteristics associated with the exposed methods, this aspect is essential since there are vast works in which such methodologies are used to evaluate the PEC PCD. However, there are few analyses in which it is possible to compare them.
By evaluating the linear features, Table 3 shows the results for this sample as class PEC PCD A and B on a 1:25,000 scale. This characteristic is related to the fact that it was accepted for referred classes since the PEC PCD scale triggers the analysis. The same aspect was presented at a scale of 1:10,000, accepted in classes C and D.
In order to make the visualisation of results standardised and interoperable, the DEs and DMs were classified into quartiles. Quartiles 1 and 4 represent, respectively, the smallest and largest discrepancy range, which gradually increases in the intermediate quartiles. This aspect makes it possible to identify regions with the same characteristics and allows obtaining new parameters for modelling the data based on the characteristics of a particular region. Furthermore, given the described issues, the quartiles were differentiated by the colour value, in which the lowest quartiles are lighter and get darker as they increase. Figure 9 presents the map with the visualisation of the discrepancies for the sets of point samples and linear features.
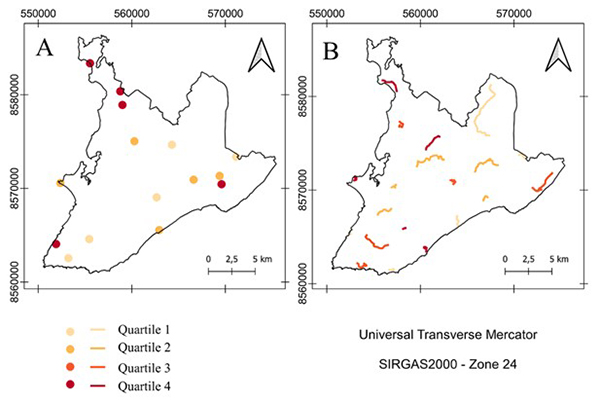
Figure 9
Map of planimetric discrepancies obtained in Salvador-BA: A. Punctual features; B. Linear Features.
When analysing the behaviour of the results, it was possible to observe the differences in the patterns of discrepancies along the study region. This aspect can be evidenced by observing the DE values of the punctual features in Figure 8 since the values varied from 0.56m (quartile 1) to 10.58m (quartile 4). In the category in question, 5 features were in quartile 1 (DE ≤ 1.521 m), 5 in quartile 2 (1.521 m < DE ≤ 2.948 m), 5 in quartile 3 (2.948 m < DE ≤ 6.173 m) and 5 in quartile 4 (DE > 6.173). Furthermore, no error tendencies were found in the sample of punctual features, and even though it was classified as class A of the PEC PCD on a scale of 1:50,000, it does not reveal homogeneous behaviour of the discrepancies. In order to evidence the approached issues, the graphic of Figure 10 presents the discrepancies behaviour of the punctual features in the north (Y coordinate) and east (X coordinate) components.
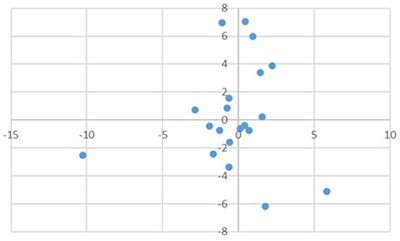
Figure 10
Behavior of the point feature discrepancies sample.
As presented in Figure 10, it is possible to note that the sample behaviour presents a scatter of the calculated discrepancies. Furthermore, these results show the heterogeneity of collaborative data. That is, the quality of a given feature may be related to the time when the contribution was made, the platform, the study region, and the satellite image which feeds it, among other aspects.
However, despite this characteristic, the discrepancies in representation automatisation (Figure 8) highlighted an important aspect related to the distribution of the sample results, evidenced in the analysis of point features. This characteristic may be associated with aspects of the study area or the sample distribution, which presented different magnitudes of discrepancies, as previously mentioned and presented in the analysis. In the tool development, the main difficulties were associated with statistical tests of tendency concatenation and precision since it was necessary to establish stopping criteria from the Student's t and Chi-Square Tables and evaluate linear features. In addition, there was difficulty in obtaining the best method to develop since each buffer generates a different DM for each feature.
5 Conclusions and Recommendations
Based on the products obtained, it is initially highlighted the importance of automated methodologies used for the assessment of positional accuracy in order that the verifications can be carried out more quickly, given the large volume of geospatial data currently available. Furthermore, in the processes related to cartographic production, especially on a large scale, it is fundamental to incorporate quality analysis methods. A set of models created in a widely used open-source tool such as QGIS makes it possible to quantify, visualise and document in an automated way the spatial distribution of the quality parameters defined by national and international standards. An example of the importance of quality geovisualization could be evidenced in the results obtained for the study area. In these results, we can observe that the discrepancies tended to increase as they approached the peripheral regions of the study area (mainly in point features).
The increase in the number of geospatial data sources and the participation of non-specialised users in this process has resulted in heterogeneity in the information quality. In this context, developing quality assessment tools, where the results can be presented in GIS software, can increase the user's security in decision-making related to using such information. For example, it can help identify characteristics for integrating data from collaborative mapping with official data. As a case study in this paper, we compared OpenStreetMap and authoritative data. In a scenario of using OSM data for cartographic updating, the knowledge regarding the quality allows the evaluation of the suitability for use and documentation in the metadata of the quality reports obtained.
In addition, it is worth highlighting the importance of tools developed in open-source software that can be reused and easily accessed and manipulated by any user. Also, interfaces were developed in QGIS for data entry and visualisation of the results. Furthermore, the results displayed the essential parameters to assess the features of the evaluated database, such as discrepancies; the existence of error trends; class by the scale of the PEC-PCD and the visualisation of the results. Finally, it is essential to highlight that evaluating quality aspects in a GIS environment enables future analyses associating characteristic parameters of a specific area, such as socioeconomic aspects and the number of inhabitants.
As recommendations for future works, it is suggested to investigate methods to evaluate positional accuracy from polygonal features and to develop tools to evaluate thematic accuracy, completeness and logical consistency. Furthermore, in analysing the linear features, it is advisable to explore other metrics for evaluating the positional quality, mainly those aimed at vertex verification, such as the Hausdorff Distance method. Moreover, also on linear features, it is recommended to explore new methodologies for evaluating the positional accuracy, considering the planimetric components separately. Such improvement would allow for exploring the data heterogeneity and performing analyses similar to Figure 10. Beyond that, as the tool also covered the representation of the results obtained for the positional quality, it is recommended to perform tests to improve the results visualisation based on the user requirements.
6 Acknowledgments
The authors would like to thank the Graduate Program in Geodetic Sciences at the Federal University of Paraná - Brazil. This study was carried out with the support of the Coordination for the Improvement of Higher Education Personnel (CAPES) - Funding Code 001.
7 References
Barbetta, P.A. 2005, Estatística aplicada às Ciências Sociais, vol. 7, Universidade Federal de Santa Catarina, Florianópolis.
Barbosa, L.S., Silva, S.K.M. & Santos, A.P. 2021, 'Avaliação da acurácia posicional planimétrica de uma ortofoto gerada através de uma plataforma VANT, considerando a influência do tamanho amostral na normativa do INCRA', Revista Brasileira de Geomática, vol. 9, no. 2, pp. 158-78, DOI:10.3895/rbgeo.v9n2.13698
Brasil. 'Decreto nº 89.817, de 20 de junho de 1984', Normas Técnicas da Cartografia Nacional, Diário Oficial da União, Brasília, DF, 22 jul. 1984, pp. 8884.
Brovelli, M.A., Boccardo, P., Bordogna, G., Pepe, A., Crespi, M., Munafò, M. & Pirotti, F. 2019, 'Urban Geo Big Data', The International Archives of the Photogrammetry, Remote Sensing and Spatial Information Sciences, vol. XLII-4-W14-23, pp. 23-30, DOI:10.5194/isprs-archives-XLII-4-W14-23-2019
Brovelli, M.A., Minghini, M. & Molinari, E. 2016, 'Database-supported change analysis and quality evaluation of OpenStreetMap Data', The International Archives of the Photogrammetry, Remote Sensing and Spatial Information Sciences, vol. XLI-B7-919, pp. 919-25, DOI:10.5194/isprsarchives-XLI-B7-919-2016
Brovelli, M.A. & Zamboni, G. 2018, 'A new method for the assessment of spatial accuracy and completeness of OpenStreetMap building footprints', ISPRS International Journal of Geo-Information, vol. 7, no. 8, e289, DOI:10.3390/ijgi7080289
Cintra, J.P. & Nero, M.A. 2015, 'New Method for Positional Cartographic Quality Control in Digital Mapping', Journal of Surveying Engineering, vol. 141, no. 3, e04015001, DOI:10.1061/(asce)su.1943-5428.0000141
Cruz, D.T., & Santos, A.P. 2016, 'Controle de qualidade posicional do sistema rodoviário do Openstreetmap na região central De Viçosa-MG', Anais do VI Simpósio Brasileiro de Ciências Geodésicas e Tecnologias da Geoinformação, Universidade Federal de Pernambuco.
Cunha, M.M., Secatto, G.Z., Galindo, J.R.F. & Santos, A.P. 2019, 'Proposta de um método de avaliação da acurácia posicional baseado na modificação do Buffer Simples', Revista Brasileira de Cartografia, vol. 71, no. 4, pp. 1193-1218, DODI:10.14393/rbcv71n4-49301
DSG - Diretoria do Serviço Geográfico 2011, Especificação Técnica para a Aquisição de Dados Geoespaciais Vetoriais (ET-ADGV), vol. 2, DSG, Brasília.
DSG - Diretoria do Serviço Geográfico 2015, Especificação Técnica para Aquisição de Dados Geoespaciais Vetoriais de Defesa da Força Terrestre (ET-ADGV-DefesaFT), vol. 1, DSG, Brasília.
DSG - Diretoria do Serviço Geográfico 2016a, Especificação Técnica para Aquisição de Dados Geoespaciais Vetoriais de Defesa da Força Terrestre (ET-ADGV-DefesaFT), vol. 2, DSG, Brasília.
DSG - Diretoria do Serviço Geográfico 2016b, Especificação Técnica para Controle de Qualidade de Dados Geoespaciais (ET-CQDG), vol. 1, DSG, Brasília.
Elias, E.N.N. 2019, 'GitHub', Plugin_PECPCD, viewed 17 December 2022, < 2019, 'GitHub', Plugin_PECPCD, viewed 17 December 2022, https://github.com/eliasnaim/AcuraciaPosicional_PEC-PCD>.
Elias, E.N.N. 2022, 'GitHub', Plugin_PECPCD, viewed 17 December 2022, < 2022, 'GitHub', Plugin_PECPCD, viewed 17 December 2022, https://github.com/eliasnaim/Plugin_PECPCD>.
Elias, E.N.N. & Fernandes, V.O. 2021, 'Qualidade dos Dados Geoespaciais do OpenStreetMap para os indicadores de Acurácia Posicional, Acurácia Temática e Completude', Geografia (Londrina), vol. 30 no. 2, pp. 255-75.
Elwood, S., Goodchild, M.F. & Sui, DZ. 2012, 'Researching volunteered geographic information: Spatial data, geographic research, and new social practice', Annals of the Association of American Geographers, vol. 102, no. 3, pp. 571-90, DOI:10.1080/00045608.2011.595657
Foz, E.T., Muñoz-Nieto, Á.L., González-Aguilera, D. & Gonzálvez, P.R. 2021, 'Implementación de procesos de control de calidad en actualización de series cartográficas urbanas mediante CAD y SIG', Revista Cartográfica, no. 103, pp. 47-69, DOI:10.35424/rcarto.i103.884
Galo, M. & Camargo, P. 1994, 'Utilização do GPS no controle de qualidade de cartas', Anais do Congresso Brasileiro de Cadastro Técnico Multifinalitário, Universidade Federal de Santa Catarina, Florianópolis, pp. 41-8.
Ganapati, S. 2011, 'Uses of Public Participation Geographic Information Systems Applications in E‐Government', Public Administration Review', vol. 71, no. 3, pp. 425-34, DOI:10.1111/j.1540-6210.2011.02226.x
García-Balboa, J.L., Ureña-Cámara, M.A. & Xavier, E.M.A. 2021, 'iCPos: una herramienta web para la elaboración de Informes de Calidad Posicional', Revista Cartográfica, no. 103, pp. 183-99, DOI:10.35424/rcarto.i103.997
IBGE - Instituto Brasileiro de Geografia e Estatística 2021. Malha Municipal, Rio de Janeiro, viewed 14 November 2022, < Malha Municipal, Rio de Janeiro, viewed 14 November 2022, https://www.ibge.gov.br/geociencias/organizacao-do-territorio/malhas-territoriais/15774-malhas.html?=&t=acesso-ao-produto>.
ISO - International Organisation for Standardisation. 2013, ISO 19157: Geographic Information - Data Quality, Switzerland.
Keates, J.S. 1973, Cartographic Design and Production, Longman, London.
Kent, A.J. 2009, 'Topographic Maps: Methodological Approaches for Analysing Cartographic Style', Journal of Map & Geography Libraries, vol. 5, no. 2, pp. 131-56, DOI:10.1080/15420350903001187
Lisboa, M.H., Santos, A.P., Medeiros, N.G. & Abreu, M.V.S. 2019, 'Avaliação da Acurácia Posicional Tridimensional de Produtos Cartográficos utilizando um Elipsoide de Incertezas', Revista Brasileira de Cartografia, vol. 71, no. 4, pp. 1040-63, DOI:10.14393/rbcv71n4-49488
Luz, C.C. & Antunes, A.F.B. 2015, 'Validação da tecnologia VANT na atualização de bases de dados cartográficos geológicos. Estudo de caso: Sistema cárstico do rio João Rodrigues', Revista Brasileira de Cartografia, no. 67/7, pp. 1439-52.
Martini, A., Kuper, P.V. & Breunig, M. 2019, 'Database-supported change analysis and quality evaluation of OpenStreetMap Data', Annals of the Photogrammetry, Remote Sensing and Spatial Information Sciences, vol. IV-2/W5, pp. 535-41, DOI:10.5194/isprs-annals-IV-2-W5-535-2019
Merchant, D.C. 1982, 'Spatial accuracy standards for large scale line maps', American Congress on Surveying and Mapping Proceedings, ACSM, Falls Church, pp. 222-31.
Mozas-Calvache, A.T. & Ariza-López, F.J. 2019, 'Analysing the positional accuracy of GNSS multi-tracks obtained from VGI sources to generate improved 3D mean axes', International Journal of Geographical Information Science, vol. 33, no. 11, pp. 2170-87, DOI:10.1080/13658816.2019.1645335
Monico, J.F.G., Póz, A.P.D., Galo, M., Santos, M.C. & Oliveira, L.C. 2009, 'Acurácia e precisão: revendo os conceitos de forma acurada', Boletim de Ciências Geodésicas, vol. 15, no. 3, pp. 469-83.
Nogueira Jr., J.B. 2003, 'Controle de qualidade de produtos cartográficos: uma proposta metodológica', Master Thesis, Universidade Estadual Paulista Júlio de Mesquita Silva, São Paulo.
Oliveira, D.V. & Brito, J.L.S. 2019. 'Avaliação da Acurácia Posicional de Dados Gerados por Aeronave Remotamente Pilotada', Revista Brasileira de Cartografia, vol. 71, no. 4, pp. 934-59.
Pedreira, W.J.P., de Andrade Oliveira, J. & Santos, P.S. 2020, 'Avaliação da Acurácia Altimétrica usando a Tecnologia VANT', Revista Caminhos da Geografia. vol. 21, no. 3 pp. 209-22.
Pereira, T.A.J. & Nero, M.A. 2012, 'Análise de normas de controle de qualidade posicional em cartografia ao redor do mundo: exemplos atuais de alguns países', Anais do IV Simpósio Brasileiro de Ciências Geodésicas e Tecnologias da Geoinformação, Universidade Federal de Pernambuco, Recife.
Pessoa, G.G., Carrilho, A.C., Miyoshi, G.T., Amorim, A. & Galo, M. 2021, 'Assessment of UAV-based digital surface model and the effects of quantity and distribution of ground control points', International Journal of Remote Sensing, vol. 42, no. 1, pp. 65-83, DOI:10.1080/01431161.2020.1800122
Roberto, A.J. 2013, 'Extração de Informação Geográfica a partir de Fotografias Aéreas obtidas com VANTs para apoio a um SIG Municipal', Master Thesis, Universidade do Porto.
Robinson, A.C., Demšar, U., Moore, A.B., Buckley, A., Jiang, B., Field, K., Kraak, M., Camboim, S.P. & Sluter, C.L. 2017, 'Geospatial big data and cartography: research challenges and opportunities for making maps that matter', International Journal of Cartography, vol. 3, no. 1, pp. 32-60, DOI:10.1080/23729333.2016.1278151
Santos, A.P. 2015, 'Controle de Qualidade Cartográfica: Metodologias para Avaliação da Acurácia Posicional em Dados Espaciais', PhD Thesis, Universidade Federal de Viçosa.
Santos, A.P., Medeiros, N.G., Santos, G.R. & Rodrigues, D.D. 2016, 'Avaliação da acurácia posicional planimétrica em modelos digitais de superfície com o uso de feições lineares', Boletim de Ciências Geodésicas, vol. 22, no. 1, pp. 157-74, DOI:10.1590/S1982-21702016000100009
Silva Júnior, J.A.D., França, T.M.S. & Moraes, V.S.D. 2022, 'Avaliação da acurácia planimétrica de imagens Google Earth numa zona urbana e rural o estado de Pernambuco, Brasil', Revista cartográfica, no. 105, pp. 117-33, DOI:10.35424/rcarto.i105.1386
Soares, G., Inocencio, L.C., Veronez, M.R., da Silveira, L.G., Bordin, F. & Marson, F.P. 2018, 'Analysis of positional and geometric accuracy of objects in survey with unmanned aerial vehicle (UAV)', IEEE International Geoscience and Remote Sensing Symposium, Valencia - Spain, pp. 5693-6, DOI:10.1109/IGARSS.2018.8517315
Teixeira, P.S. & Santos, A.D.P. 2019, 'Implementação de ferramenta para Controle de Qualidade Cartográfica no software QGIS', Proceedings XX GEOINFO, São José dos Campos, pp. 212-7.
Tong, X., Sun, T., Fana, J., Goodchild, M.F. & Shi, W. 2013, 'A statistical simulation model for positional error of line features in Geographic Information Systems (GIS)', International Journal of Applied Earth Observation and Geoinformation, vol. 21, pp. 136-48, DOI:10.1016/j.jag.2012.08.004
Tveite, H. & Langaas, S. 1999, 'An accuracy assessment method for geographical line data sets based on buffering', International Journal of Geographical Information Science, vol. 13, no. 1, pp. 27-47, DOI:10.1080/136588199241445
Yang, C., Yu, M., Hu, F., Jiang, Y. & Li, Y. 2017, 'Utilising cloud computing to address big geospatial data challenges', Computers, Environment and Urban Systems, vol. 61, pp. 120-8, DOI:10.1016/j.compenvurbsys.2016.10.010
Zanetti, J., Paula, R.M., Santos, A.P., & Medeiros, N.G. 2016, 'Avaliação da acurácia posicional planimétrica de ortoimagens disponibilizadas nos sistemas de informações geográficas', Revista Brasileira de Cartografia, vol. 68, no. 7, pp. 1341-52.
Zhou, Q. 2018, 'Exploring the relationship between density and completeness of urban building data in OpenStreetMap for quality estimation', International Journal of Geographical Information Science, vol. 32, no. 2, pp. 257-81, DOI:10.1080/13658816.2017.1395883
Funding information
Data availability statement
Author notes
Corresponding author: Elias Nasr Naim Elias;elias.naim@eng.uerj.brE-mail: elias.naim@eng.uerj.brE-mail: samoelgiehl@gmail.comE-mail: fabricioamorimeac@hotmail.comE-mail: marcio.schmidt@ufu.brE-mail: silvanacamboim@gmail.comE-mail: vivian.fernandes@ufba.br
Conflict of interest declaration
