Article
Received: 31 January 2023
Accepted: 09 June 2023
DOI: https://doi.org/10.11137/1982-3908_2023_46_56709
Funding
Funding source: CAPES
Contract number: 001
Funding statement: This study was financed in part by the Coordenação de Aperfeiçoamento de Pessoal de Nível Superior - Brazil (CAPES) - Finance Code 001.
Abstract: Persistent Scatterer Interferometric Synthetic Aperture Radar (PSInSAR) technique employs a Multi-Temporal InSAR (MT-InSAR) approach to accurately measure subsidence. This technique, a type of Differential Interferometry (DInSAR), mitigates errors that traditional DInSAR techniques cannot, including temporal and geometric decorrelation, and phase unwrapping errors. In order to verify the subsidence process in the Pinheiro neighborhood of Maceio - Brazil following a 2018 earthquake, we tested free processing packages such as SNAP-StaMPS integration. Our investigation was conducted in two stages: first, using a stack of Sentinel-1A SLC-SAR (Single Look Complex-SAR) images acquired before and after the earthquake, and second, using more recent images to determine if the subsidence process is ongoing. Results from the first stage identified the area affected by subsidence and the second stage confirmed the continued presence of subsidence events. From 2017 to 2018, the subsidence process exhibited the highest displacement amplitude of -32.3 mm/year, whereas, between 2021 and 2022, the amplitude decreased to -24.09 mm/year, indicating a deceleration in the subsidence process.
Keywords: PSInSAR, Interferometry, SNAP-StaMPS.
Resumo: Persistent Scatterer - Interferometric Synthetic Aperture Radar (PSInSAR) é uma técnica que usa uma abordagem Multi-Temporal Interferometric - SAR (MT-InSAR). PSInSAR representa uma classe específica da técnica Differential Interferometry - SAR (DInSAR), mas tem uma grande vantagem por permitir mitigar erros, como perda de correlação geométricas e temporal e erros no desbobramento da fase, que o DInSAR se limita a resolver. Assim, testamos pacote de processamento gratuito, como a integração SNAP-StaMPS, para verificar o processo de subsidência na cidade de Maceió - Brasil. Nesta cidade, mais especificamente no bairro Pinheiro, vem ocorrendo subsidência desde a episódio de um terremoto em 2018. Nesse sentido, nossa investigação foi dividida em duas etapas: no primeiro teste aplicamos a técnica PSInSAR usando uma pilha de imagens Single Look Complex - SAR (SLC-SAR) do Sentinel-1A adquiridas antes e depois do terremoto; no segundo teste, utilizamos imagens adquiridas recentemente para analisar se há um processo de subsidência na área afetada. Como resultado, no primeiro teste foi possível identificar a área que sofreu o processo de subsidência, assim como aconteceu no segundo teste, que também detectou o evento de subsidência. Durante o período de 2017-2018, registrou-se a maior amplitude de deslocamento de -32,3 mm/ano. No entanto, observou-se uma redução nesse valor para -24,09 mm/ano durante o período de 2021-2022, indicando um processo de desaceleração na subsidência.
Palavras-chave: PSInSAR, Interferometria, SNAP-StaMPS.
1 Introduction
The Synthetic Aperture Radar (SAR) system is a sophisticated active radar technology used for capturing high-resolution images and generating two-dimensional images or three-dimensional reconstructions of objects. Unlike traditional optical imaging systems that rely on visible light, SAR utilizes radio waves to penetrate through various atmospheric conditions, such as fog, clouds, and darkness. This enables SAR to operate effectively regardless of day or weather conditions, making it an invaluable tool for remote sensing and monitoring applications (Kirscht & Rinke 1998). Accordingly, the Seasat mission, the first project to utilize SAR technology, was launched by NASA's Jet Propulsion Laboratory in 1978 (Lame et al. 1980). Its success led to other SAR missions being launched, demonstrating the potential of the technology for remote sensing purposes (Ferro-Famil & Pottier 2016). Over the years, several important SAR missions have been placed in orbit, including ERS-1/2 (Europe, 1991/1995), JERS-1 (Japan,1992), Radarsat-1/2 (Canada, 1999/2007), Envisat (Europe, 2002), Terra-SAR (Germany, 2007), Tandem (Germany, 2010), RISAT-1 (India, 2012), ALOS-2 (Japan, 2014), and Sentinel 1A/B (Europe, 2014/2016) (Jawak, Bidawe & Luis 2015).
Sentinel-1 constellation, for example, is composed of two satellites (Sentinel-1-A and B) and is run by the European Space Agency (ESA). With a 12-day temporal resolution, the Sentinel-1 operates in the C-band and has a line-of-sight (LoS) capability ranging from 29.7° to 46.0°. The satellites are equipped with a SAR system capable of acquiring data in four modes: stripmap (SM), interferometric wide swath (IW), extra-wide swath (EW), and wave (WV). The IW mode, which is the main mode for interferometry processing, records data in three sub-swaths using Terrain Observation with Progressive Scans SAR (TOPSAR) and provides a spatial resolution of 5 m x 20 m across a 250 km swath. From the raw data (Level-0), Single Look Complex (SLC) products (Level-1) are generated using the range/Doppler algorithm (Chang, Jin & Curlander 1992; Wu, Liu & Jin 1982). A Single Look Complex - Synthetic Aperture Radar (SLC-SAR) product is a digital image with a slant range and phase preservation, each pixel in the image is represented by a complex magnitude value and therefore contains both amplitude and phase information (ESA 2012).
The Interferometry Synthetic Aperture Radar (InSAR) technique uses cross-multiplication between two SLC-SAR images to obtain an interferogram with their relative altitudes (Hanssen 2001; Massonnet & Feigl 1998; Rosen et al. 2000). In contrast, the Differential Interferometry Synthetic Aperture Radar (DInSAR) technique uses the same principle but exploits the information contained in the radar phase of at least two complex SLC-SAR images acquired in different epochs or geometry over the same area. The differential interferograms formed at the end of this process include phases with information regarding surface changes at a given time (Acosta et al. 2021; Crosetto & Crippa 2005; Gabriel, Goldstein & Zebker 1989; Sheng et al. 2012).
The Multi-Temporal - Interferometric Synthetic Aperture Radar (MT-InSAR) approach, which is similar to the DInSAR approach, but uses a temporal strategy, was used to obtain surface deformation over time. MT-InSAR, as pointed out by Singh Virk et al. (2018), employs a stack of SLC-SAR images to extract spatial information with high accuracy over large scales of illuminated areas. Several techniques are currently available for MT-InSAR processing, including the Coherent Pixel Technique (CPT) (Blanco-Sánchez et al. 2008), Small Baseline Subset (SBAS), Target Point Interferometric Analysis (IPTA) (Werner et al. 2003), and Persistent Scatterer Interferometric PSI (or PSInSAR) (Ferretti, Prati & Rocca 2000, 2001), among others.
Several open-source packages have been developed for MT-InSAR processing, namely GIAnT (Agram et al. 2013), MintPy (Yunjun, Fattahi & Amelung 2019), StaMPS (Hooper, Segall & Zebker 2007; Hooper 2008), GAMMA (Geomatica 2015), ENVI SARScape (L3Harries 2021), ERDAS IMAGINE (Hexagon 2019), and SARPROZ (Perissin, Wang & Wang 2011). For the InSAR and DInSAR approaches, some software can be cited as GMTSAR (Sandwell et al. 2011), ISCE (Rosen et al. 2012), and SNAP (ESA 2022b). Overall, these programs are technically complex and may be difficult for non-experts to use or perform using SLC-SAR images.
Due to the amount of SAR data and the possibility of processing these images through an open-source package, we decided to test the PSInSAR technique using the SNAP-StaMPS integration to identify subsidence phenomena in a location that has these occurrences. This area is located in the Pinheiro neighborhood of Maceió City (Alagoas, Brazil), where an earthquake occurred on March 3, 2018, consequently causing the emergence of numerous cracks in houses, buildings, and public roads (CPRM 2019). Thus, we processed Sentinel-1A SLC-SAR images acquired in descending mode in two ways: a) using SLC-SAR images acquired before and after the earthquake (2017-2018), and b) processing using recently acquired images to see how subsidence is progressing (2021-2022).
2 Methodology and Data
2.1 Study Area
Maceió City is the capital of the coastal state of Alagoas, Brazil - it occupies an area of 509.5 km² and has a population of 1,031,597 inhabitants distributed in 50 neighborhoods (IBGE 2021; Maceió 2000). The locations that were chosen for PSInSAR processing cover the neighborhoods shown in Figure 1, which include Pinheiro, Bebedouro, Bom Parto, and Mutange. In this region, mainly in the Pinheiro neighborhood, on March 3, 2018, an earthquake of magnitude 2.4 (Brazilian local magnitude scale) occurred, culminating in the appearance of fissures in houses, buildings, and public roads (CPRM 2019). Thus, a total of 6,356 buildings were classified as risk zones and placed for demolition by the Brazilian authorities, and residents were relocated to stable areas.
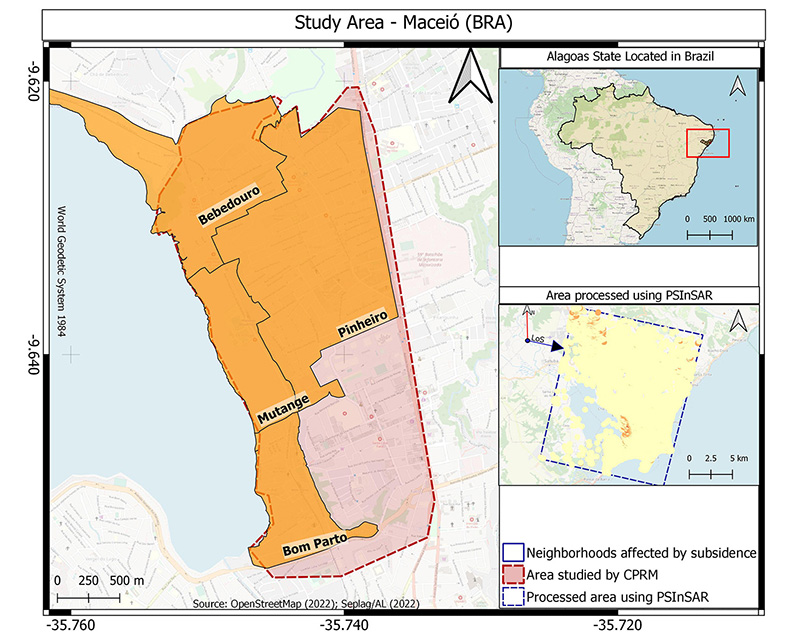
Figure 1A
Study Area: Pinheiro neighborhood is located in Maceio City, the capital of the State of Alagoas (which belongs to the Northeast of Brazil); B-C. Examples of cracks that occurred in houses and buildings. These photos were taken by CPRM (2018).
According to CPRM (2019), this area is geologically sedimentary, and the excessive pumping of wells reduces the pressure exerted by water, generating redistributive support for grains and soil subsidence that can reach a few centimeters per year and extend for several kilometers. Being an urban area, the land cover is predominantly composed of buildings, houses, and roads, which are good retroreflectors in the C-band. In the coastal region, the predominant targets are shrubs, trees, and exposed soil, which provide a high backscatter decorrelation.
2.2 Data Set
In the first test, we focused on verifying the displacement rate when subsidence began. In this processing, a stack of 21 SLC-SAR images from Sentinel-1A was considered; these images were acquired over the Pinheiro neighborhoods in descending mode from September 2017 to December 2018, and the image obtained on June 11, 2018, was considered as master. In the second test, we looked at a stack of 22 SLC-SAR images that were collected in descending mode between January 2021 and September 2022, with the image captured on October 17, 2021, being designated as the master. As an illustration, Figure 2 shows the perpendicular baseline and acquisition date between the master and slave images of the two tests mentioned above.
To remove the topographical phase presented in the interferograms, we used the Digital Elevation Model (DEM) from ALOS PALSAR Radiometric Terrain Correction (RTC) products. These ALOS PALSAR RTC products are available in two resolutions: RT1, which has a spatial resolution of 12.5 m, resampled from SRTM GL1, and RT2, with a resolution of 30 m. For this particular study, we employed RTC1, which was downloaded from the Alaska Satellite Facility (ASF) website (https://search.asf.alaska.edu/#/).
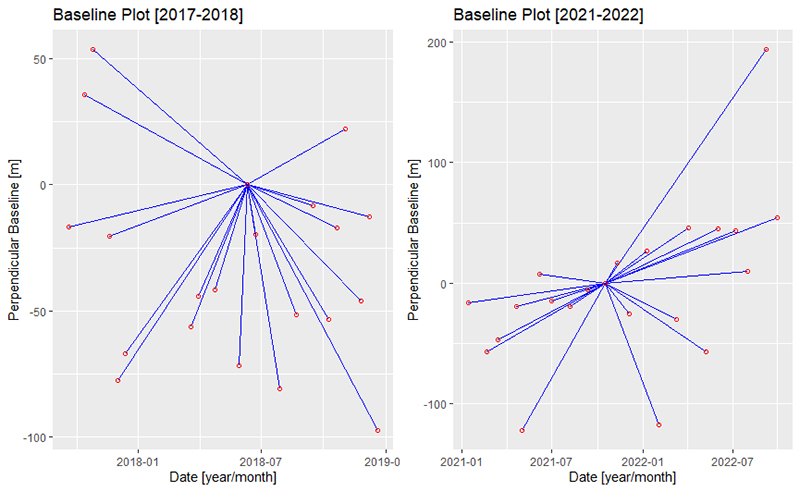
Figure 2
The temporal and temporal baselines of the SLC-SAR images: A. A stack of 21 SLC-SAR images from 2017 to 2018; B. A stack of 22 SLC-SAR images from 2021 to 2022.
2.3 Data Processing
2.3.1 The Sentinel Application Platform (SNAP)
The Sentinel Application Platform (SNAP) platform is a common architecture for all Sentinel Toolboxes and includes a collection of open-source tools for the scientific exploration of Earth observation missions. This platform allows handling data from ESA-SAR missions (Sentinel-1/2/3, ERS-1/2, and ENVISAT) and third-party missions such as COSMO, SkyMed, Radarsat-2, TerraSAR-X, and ALOS PALSAR (Mora 2019). However, SNAP only supports InSAR and DInSAR processing, which means that it is only possible to preprocess SLC-SAR images and consequently generate interferograms that can be exported, for example, to the Stanford Method for Persistent Scatterers (STaMPS) format.
2.3.2 PSInSAR and StaMPS
PSInSAR, idealized by Ferretti, Prati and Rocca (2000, 2001), is a remote sensing technique that uses a stack of fine co-registered SLC-SAR images to measure small changes on the Earth's surface. Through this stack of images acquired in a time interval (t0, t1, t2, … , tK ), one of which is defined as a master (M), and the others are considered as slaves (S). Thus, the phase difference (φD-Int ) is calculated by cross-multiplication between M and the complex conjugate of the S images (Massonnet & Feigl 1998).
However, when a DEM is used to simulate the topographic phase ( ), it is possible to separate the displacement phase (φDispl ) from the other phase components presented in each interferogram. The amount of each phase is given by Equation 1.
where is the residual topographic error component that came from the inaccurate DEM used to simulate the topographic component ( ), φAtm is the atmospheric phase at the acquisition time of each image (S and M), φOrb is the orbital error caused by the image position, φNoise is the phase noise, 2nπ is the ambiguity and n represents the integer values.
PSInSAR represents a specific class of DInSAR, but it has a great advantage because there is a possibility of mitigating errors that the DInSAR is limited to solving. The main limitations of DInSAR are temporal and geometric decorrelations, phase unwrapping for integer ambiguity estimation (n), and atmospheric component (φAtm ) (Crosetto et al. 2016).
The PSInSAR approach detects reflector stable-phase points, known as Persistent Scatterers (PS). These PSs, however, are selected based on the amplitude deviation method (DA ), which is defined as the ratio of the standard deviation (σA ) and the mean value of the amplitude to (μA ) (Du 2017; Ferretti, Prati & Rocca 2001).
The displacement result for each PS is recorded in the sensor's line-of-sight (LoS) direction, and its velocity is expressed in millimeters per year. Therefore, velocities with a negative sign indicate subsidence, and velocities with a positive sign indicate soil uplift (Carlà et al. 2018; Zhang et al. 2020).
Hooper and Zebker (2007) and Hooper (2008) implemented the PSInSAR principle, and from that, a package called StaMPS was created. This package is widely used to investigate deformation in several study fields with different sensors (e.g., Envisat, RADARSAT-1/2, TerraSAR-X, COSMO-SkyMed, and Sentinel-1). However, in non-artificial areas, such as the area covered by vegetation, it cannot be well applied due to a lack of correlation (Zhang et al. 2022).
2.4 Time-series SNAP-StaMPS Workflow
Figure 3 shows a brief description of the steps used in SNAP-StaMPS workflow processing. This workflow was based on Foumelis et al. (2018) and Grassi and Mancini (2019) methodologies.
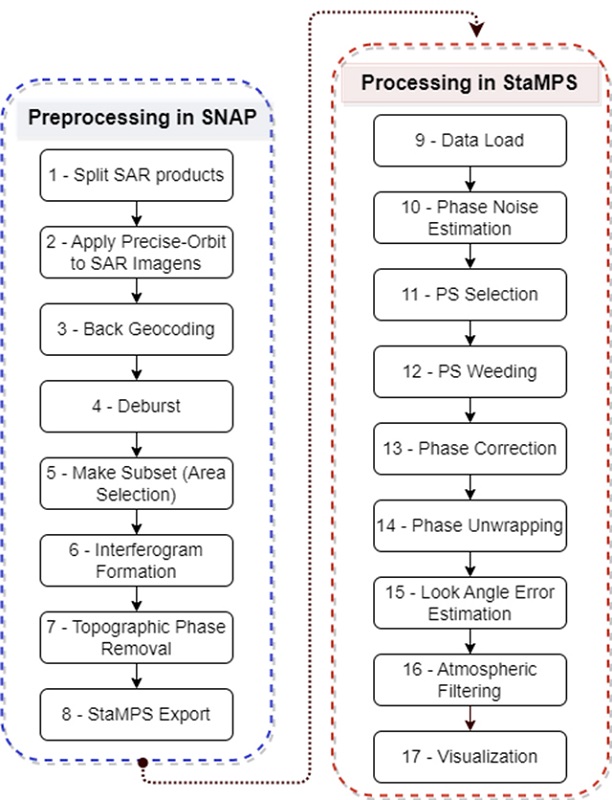
Figure 3
Combining SNAP and StaMPS workflows for displacement analysis using PSInSAR processing.
2.4.1 SNAP-StaMPS Workflow
The SLC-SAR images are then pre-processed on the SNAP platform, which follows the following procedure: 1) based on the location of the study area, the bursts and polarization of the SLC-SAR image are initially selected (preferably, a single polarization, such as VV); 2) following that, Precise Orbit Determination (POD) is applied to each chosen image - the POD service for Sentinel-1 offers Precise Orbit Ephemerides files 20 days after imagery capture (ESA 2022a) ; 3) subsequently, back-geocoding is applied - it necessitates a fine co-registration procedure between the slaves and master SLC-SAR images, and the typical SAR co-registration procedure, as pointed out by Li and Bethel (2008), consists of two stages: coarse co-registration for pixel-level accuracy, and fine co-registration for sub-pixel accuracy; 4) soon after, the deburst process seeks to merge individual adjacent bursts from one sub-swath into a single deburst sub-swath in the azimuth direction (Flores-Anderson et al. 2019; Sowter et al. 2016); 5) and then, in order to reduce the amount of data to be analyzed and speed up the processing, a spectral or spatial clipping of the SLC-SAR images is recommended; 6) in this way, the interferograms can already be formed - this process is acquired by multiplying the amplitudes of the master and slave images while differentiating their respective phases (Massonnet & Feigl 1998; Rosen et al. 2000); 7) at this stage, topographic phase removal is completed by using a DEM to estimate and subtract the topographic phase from the interferograms (Hooper et al. 2004); 8) finally, the files utilized here are those created in stages 4 or 5, as well as the one from step 6, and the results can then be exported to StaMPS format.
Accordingly, the exported data is processed using the PSInSAR technique. Processing is then carried out according to the following steps: 9) initially, the data are prepared in the Linux environment for PSInSAR processing in StaMPS, which takes place in a MATLAB workspace; 10) still in the previous step, the phase noise of each pixel is calculated and, thus, 11) classified as candidates for persistent scattering (PSC), which are constrained by the DA threshold; 12) already in the MATLAB workspace, the PSCs are then weeded out, and the noisy one is removed; 13) from now on, the phase correction works with the wrapped phase correction for spatially uncorrelated look-angle errors; 14) therefore, the phase unwrapping is performed to recover the wrapped phase ambiguity from the wrapped phase using the Statistical-Cost Network-Flow Algorithm for Phase Unwrapping (SNAPHU) package (Chen & Zebker 2000, 2001, 2002); 15) subsequently, the look angle error is categorized as a spatially-correlated error and then mitigated; 16) finally, atmospheric filtering is performed using the Toolbox for Reducing Atmospheric InSAR Noise (TRAIN) (Bekaert, Hooper & Wright 2015); 17) as a result, the outcome is the selected PSs with mean LoS velocity information over the processed area - this result can be viewed in MATLAB workspace, exported as a spreadsheet and then accessed on the StaMPS Visualizer tool (Hoeser 2020) or throughout the Quantum GIS (QGIS), for example.
3 Results and Discussions
The velocity analysis has been carried out to estimate the active surface deformation (uplift/subsidence) within the Pinheiro neighborhood and surroundings from 2017 to 2018 and 2021 to 2022. Therefore, over the subset for which PSInSAR processing took place, in 2017-2018 we discovered 66,011 PSs with stable phases as opposed to 63,672 PSs observed in 2021-2022. The distribution of these PSs is depicted in Figure 4, with Figures A1 and B1 showing the spatial distribution of PSs over the subset and Figures A2 and B2 highlighting the region with negative displacement rates, indicating subsidence. PSs located near those with negative velocities had mean LoS velocities ranging from 10 to -10 mm, suggesting a seasonal variation.
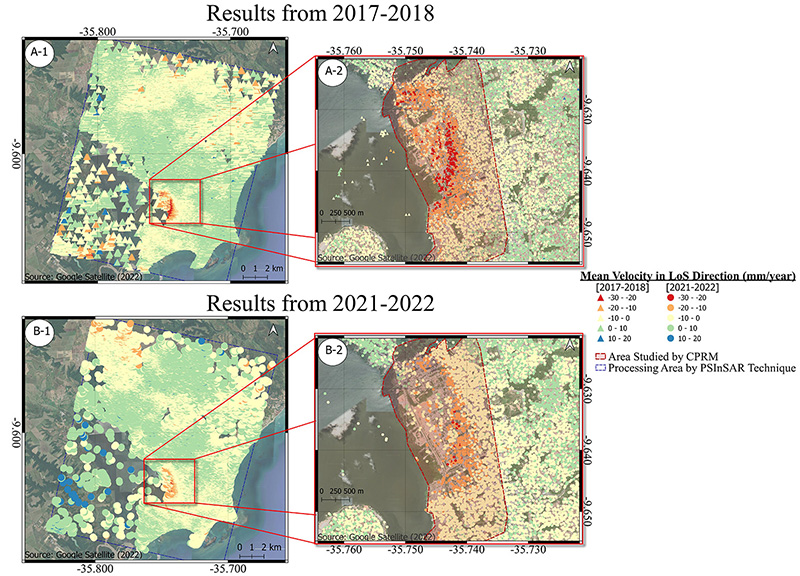
Figure 4
Results of the PSInSAR processing: A1-B1. Spatial distribution of the results from 2017 to 2018 and 2021-2022, respectively; A2-B2. Areas where subsidence occurred in 2017-2018 and 2021-2022, respectively.
Figure 5A displays the PSs distribution throughout the neighborhood and its surroundings. Triangles and circles represent the 2017-2018 and 2021-2022 results, respectively. Hence, the CPRM research section featured the majority of PSs with negative velocities, which are symbolized by yellow, orange, and red features. The density of these PSs over the study region was 591,877 PS/km² from 2017 to 2018 and 421,958 PS/km² from 2021 to 2022.
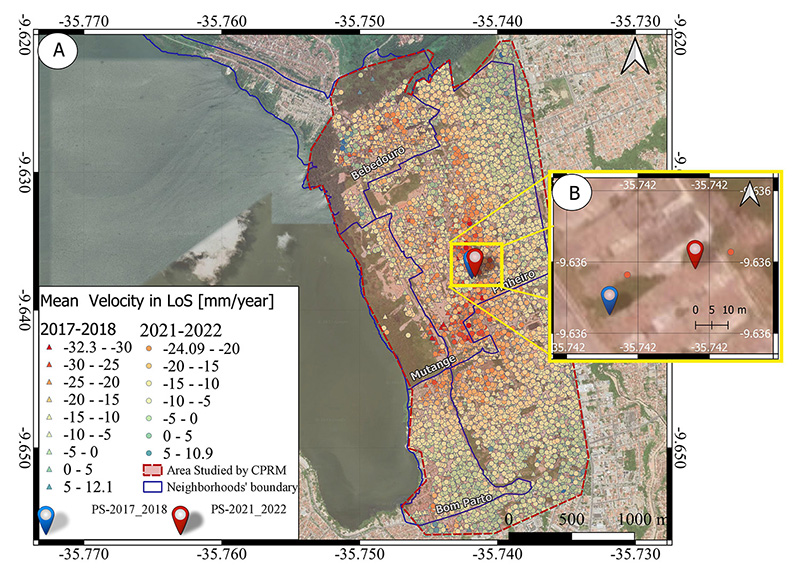
Figure 5
Distribution of PSs to the surroundings of the Pinheiro neighborhood: A. Distribution of PS with a negative displacement rate; B. Location of two PS where subsidence was detected (PS-2017-2018 and PS-2021-2022).
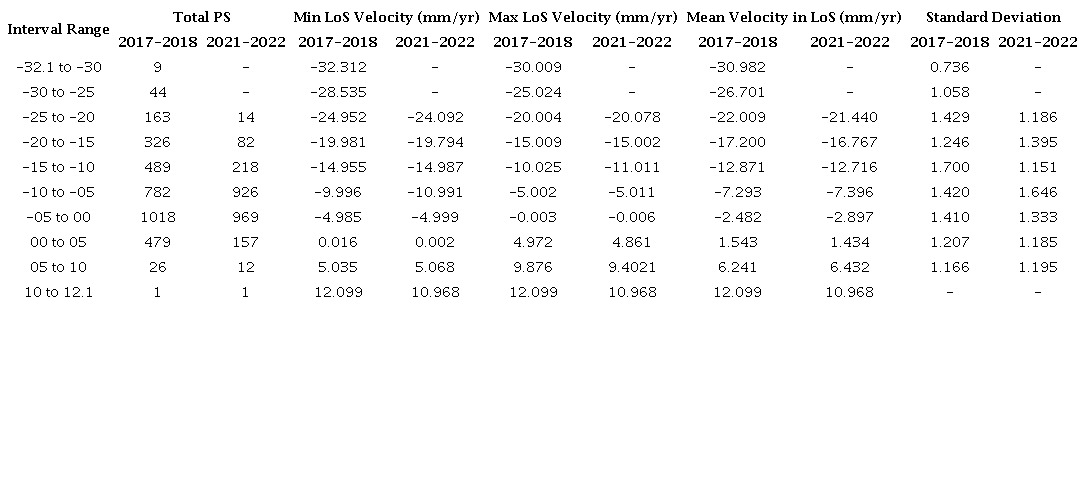
Table 1 contains a list of the intervals shown in Figure 5A. According to this information, a total of 53 PSs were found in the intervals from -32.3 to -30 and -30 to -25 in the years 2017-2018; consequently, at the same interval, no PSs were identified from 2021 to 2022. In comparison, 14 PSs were recognized between -25 and -20 in 2021-2022, and 163 PSs in 2017-2018. With this evidence, we may infer that the Pinheiro neighborhood experienced certain displacement rates that were significantly greater in 2017-2018; nonetheless, a similar process was noticed in 2021-2022, although with a lower rate of displacement in LoS.
A summary of the PSs is classified into the intervals defined in Figure 5. These were subdivided into intervals of 5 by 5, starting from the lowest value of -32.1 mm/year to the highest value of 12.1 mm/year, which were obtained in 2017-2018. From there, we obtain the maximum and minimum velocities of each interval, as well as the mean and standard deviation of these values.
In order to classify the speed of subsidence, we adopt the Varnes (1978) classification. Varnes classed the mass movement velocity as extremely slow (16 mm/year), very slow (0.016 m/year - 1.6 m/year), slow (1.6 m/year - 1.3 m/month), medium (13 m/month - 1.8 m/h), rapid (1.8 m/h - 3 m/min), very rapid (3 m/min - 5 m/s), and extremely rapid (> 5 m/s). Based on this classification, we can infer that in the Pinheiro neighborhood, the subsidence rate falls into the very-slow category and, in the neighborhood's surroundings, has an extremely-slow velocity.
The time series for two points, PS-2017-2018 (latitude -9.63588, longitude -35.7419) and PS-2021-2022 (latitude -9.63575, longitude -35.7416), are presented in Figure 5B and depicted as examples in Figure 6C. The results suggest that the area represented by PS-2017-2018 (Figure 6A) and PS-2021-2022 (Figure 6B) experienced subsidence in both 2017-2018 and 2021-2022. Other PSs in the Pinheiro neighborhood show similar trends, with some areas exhibiting more deformation than others.
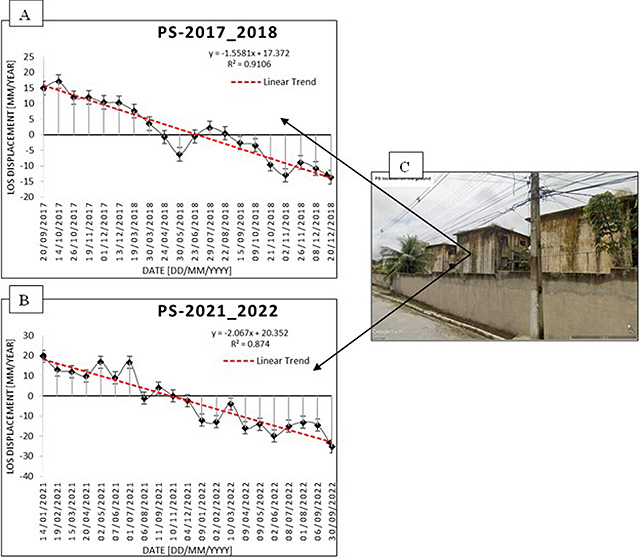
Figure 6
Time series of PS-2017-2018 and PS-2021-2022: A. PS-2017_2018; B. PS-2021_2022; C. Location of two PS where subsidence was detected. The red line represents the linear trend of the object deformation. The image on the right side shows the PS location on the ground, which was taken from Google Earth on 12/29/2022 and uploaded by Google on July 20, 2022.
Several studies were compared in the same region as shown in Figure 5A. In that regard, CPRM (2020) detected a velocity rate from -187.99 to -72 mm/year in 2016-2018 and -235.7 to -100 mm/year in 2018-2019. Euillades et al. (2020) employed the SBAS approach using 81 SLC-SAR images acquired by Sentinel 1 (04/2015 and 5/2019), and they identified a subsidence rate that varied from 20 to -20 mm/year. Vassileva et al. (2021) measured the surface displacement for the last 16 years using the multi-temporal DInSAR technique (SBAS); they ignored the horizontal component and converted the LoS displacement into vertical-only components, and then they identified displacement that gradually intensified to approximately 10 cm/year in 2007-2008 and reached approximately 12 cm/year in 2010-2011; in the second period of SAR data coverage, which extends from 03.2015 to 11.2020, they found an initial subsidence velocity of approximately 12 cm/year (2015-2016). In our study, we discovered displacement rates of -32.312 mm/year in 2017-2018 and -24.092 mm/year in 2021-2022; however, they were in the LoS direction.
The analysis of the results, especially based on Figures 5 and 6 and Table 1, demonstrated the effectiveness of the technical application in detecting the subsidence process. By using open-access SAR images, such as Sentinel-1, processed with open-access tools like SNAP-StaMPS integration, it was possible to identify subsidence occurrences. This monitoring method offers significant advantages, including early warning resources, extensive spatial coverage, non-intrusive and continuous monitoring, high precision, data-driven decision-making, and cost-effectiveness. By harnessing the power of remote sensing, PSInSAR contributes to improving subsidence risk management, strengthening disaster preparedness, and ultimately enhancing the safety of communities living in subsidence-prone areas.
4 Conclusions
We employed the MT-InSAR approach using open-source packages to process a stack of free Sentinel-1A SLC-SAR images. Specifically, we utilized the PSInSAR technique through the SNAP-StaMPS integration in two steps: first, using the SNAP platform to generate interferograms, and second, utilizing the StaMPS for PSInSAR analysis. We tested the technique on a stack of SLC-SAR images acquired between 2017 and 2018 and between 2021 and 2022 to compare the changes in the earthquake-impacted area. Our tests revealed that the subsidence-affected area could be identified in both the first and second tests. The mean Line of Sight (LoS) velocity over the area studied by CPRM was categorized as slow, while the velocity around that area was classified as extremely slow.
The SNAP-StaMPS integration offers several advantages. It allows for PSInSAR processing using images from various missions, including ENVISAT, Radarsat-2, and TerraSAR-X. These tools are open-source and available to anyone familiar with SAR technology and its processing techniques. SNAP is a user-friendly program that enables seamless communication between the user and the program. Additionally, STaMPS permit MT-InSAR using SBAS approaches. This integration is not only free but also provides a powerful tool for detecting unstable areas. By using the PSInSAR technique as a processing tool, users and public institutions can effectively locate, confirm, and monitor hazardous zones.
While the PSInSAR technique allows for precise identification of displacements in the satellite LoS direction, its accuracy in the orthogonal direction is comparatively lower than results obtained from GNSS (Global Navigation Satellite System) observations or topographic monitoring techniques employing total stations/prisms or inclinometers, for example. Therefore, the PSInSAR technique acts as a complementary tool for surface displacement analysis in the specific study area, allowing for a preliminary analysis of the situation. However, other monitoring techniques and methods are required.
For instance, there are some disadvantages when performing PSInSAR processing using the SNAP-StaMPS integration. Firstly, the processing requires significant computational effort, necessitating high-performance computers. Secondly, the mean LoS velocity is computed in the direction of the satellite's line of sight; this requires SLC-SAR images from both ascending and descending directions to calculate velocities in the vertical and horizontal directions; however, in Brazil, Sentinel-1 only provides images in the descending direction, which limits the analysis. Thirdly, setting up StaMPS can be challenging as it requires specific familiarity with Linux and MATLAB environments; this may pose a barrier for some users who are not familiar with these tools. Lastly, it's important to note that the SNAP platform (version 9.0.4) currently only supports PSInSAR processing and doesn't support other MT-InSAR approaches; this limitation may restrict the choice of techniques for users who require alternative methods for their analysis. Overall, while the SNAP-StaMPS integration offers numerous advantages, it's essential to consider these drawbacks before utilizing the technique.
For future studies, we highly recommend conducting more comprehensive and rigorous research within the field of study. This could involve the implementation of a GNSS network dedicated to monitoring purposes, offering enhanced accuracy and reliability in the obtained results. Additionally, conducting detailed geological analyses of the specific area is imperative. Such in-depth analyses can yield valuable insights into the geological structure, terrain characteristics, and potential geotechnical features that may impact the area. By undertaking these additional research measures, we can significantly advance our understanding, prediction, and mitigation of geological and geotechnical risks in this region.
5Acknowledgments
This project was funded by Coordenação de Aperfeiçoamento de Pessoal de Nível Superior - CAPES.
6 References
Acosta, G., Rodríguez, A., Euillades, P., Euillades, L., Ruiz, F., Rosell, P., Sanchez, M., Leiva, F., Ariza, J. & García, H. 2021, 'Detection of active landslides by dinsar in Andean Precordillera of San Juan, Argentina', Journal of South American Earth Sciences, vol. 108, e103205, DOI:10.1016/j.jsames.2021.103205.
Agram, P.S., Jolivet, R., Riel, B., Lin, Y.N., Simons, M., Hetland, E., Doin, M.P. & Lasserre, C. 2013, 'New radar interferometric time series analysis toolbox released', Eos, vol. 94, no. 7, pp. 69-70, DOI:10.1002/2013EO070001.
Bekaert, D.P.S., Hooper, A. & Wright, T.J. 2015, 'A spatially variable power law tropospheric correction technique for InSAR data', Journal of Geophysical Research: Solid Earth, vol. 120, no. 2, pp. 1345-56, DOI:10.1002/2014JB011558.
Blanco-Sánchez, P., Mallorquí, J.J., Duque, S. & Monells, D. 2008, 'The coherent pixels technique (CPT): An advanced DInSAR technique for nonlinear deformation monitoring', Pure and Applied Geophysics, vol. 165, no. 6, pp. 1167-93, DOI:10.1007/s00024-008-0352-6.
Carlà, T., Farina, P., Intrieri, E., Ketizmen, H. & Casagli, N. 2018, 'Integration of ground-based radar and satellite InSAR data for the analysis of an unexpected slope failure in an open-pit mine', Engineering Geology, vol. 235, pp. 39-52, DOI:10.1016/j.enggeo.2018.01.021.
Chang, C.Y., Jin, M.Y. & Curlander, J.C. 1992, 'SAR processing based on the exact two-dimensional transfer function', 92 International Geoscience and Remote Sensing Symposium (IGARSS), Houston, pp. 355-9.
Chen, C.W. & Zebker, H.A. 2000, 'Network approaches to two-dimensional phase unwrapping: intractability and two new algorithms: erratum', Journal of the Optical Society of America A, vol. 18, no. 5, 1192, DOI:10.1364/JOSAA.18.001192.
Chen, C.W. & Zebker, H.A. 2001, 'Two-dimensional phase unwrapping with use of statistical models for cost functions in nonlinear optimization', Journal of the Optical Society of America A, vol. 18, no. 2, pp. 338-51, DOI:10.1364/josaa.18.000338.
Chen, C.W. & Zebker, H.A. 2002, 'Phase unwrapping for large SAR interferograms: Statistical segmentation and generalized network models', IEEE Transactions on Geoscience and Remote Sensing, vol. 40, no. 8, pp. 1709-19, DOI:10.1109/TGRS.2002.802453.
CPRM 2018, ‘Mapeamento das Rachaduras e do Afundamento’, Galeria de Imagens - Bairro Pinheiro, viewed 29 December 2022, <CPRM 2018, ‘Mapeamento das Rachaduras e do Afundamento’, Galeria de Imagens - Bairro Pinheiro, viewed 29 December 2022, http://www.cprm.gov.br/publique/Gestao-Territorial/Acoes-Especiais/Galeria-de-Imagens---Bairro-Pinheiro-5347.html>.
CPRM 2019, Estudos sobre a instabilidade do terreno nos bairros Pinheiro, Mutange e Bebedouro, Maceió (AL), CPRM, vol. III, pp. 1-50.
CPRM 2020, Informativo Técnico n° 01/2020, Serviço Geológico do Brasil, Maceió.
Crosetto, M. & Crippa, B. 2005, 'State of the art of land deformation monitoring using differential SAR interferometry', ISPRS Workshop, Germany.
Crosetto, M., Monserrat, O., Cuevas-González, M., Devanthéry, N. & Crippa, B. 2016, 'Persistent Scatterer Interferometry: A review', ISPRS Journal of Photogrammetry and Remote Sensing, vol. 115, pp. 78-89, DOI:10.1016/j.isprsjprs.2015.10.011.
Du, Z. 2017, 'Mapping Earth Surface Deformation using New Time Series Satellite Radar Interferometry', PhD Thesis, University of New South Wales, Sydney.
ESA 2012, Sentinel-1 ESA’s radar observatory mission for GMES operational services, ESA Special Publication, viewed 1 December 2022, <ESA 2012, Sentinel-1 ESA’s radar observatory mission for GMES operational services, ESA Special Publication, viewed 1 December 2022, https://sentinel.esa.int/documents/247904/349449/s1_sp-1322_1.pdf>.
ESA 2022a, 'POD Instruments and Products', Copernicus POD, viewed 6 January 2023, <ESA 2022a, 'POD Instruments and Products', Copernicus POD, viewed 6 January 2023, https://sentinels.copernicus.eu/web/sentinel/technical-guides/sentinel-1-sar/pod>.
ESA 2022b, 'The Sentinel-1 Toolbox', European Space Agency, viewed 21 December 2022, <ESA 2022b, 'The Sentinel-1 Toolbox', European Space Agency, viewed 21 December 2022, https://sentinel.esa.int/web/sentinel/toolboxes/sentinel-1>.
Euillades, P.A., Euillades, L.E., Rosell, P. & Roa, Y. 2020, 'Subsidence in Maceio, Brazil, Characterized by Dinsar and Inverse Modeling', 2020 IEEE Latin American GRSS and ISPRS Remote Sensing Conference, LAGIRS - Proceedings, Chile, pp. 313-7.
Ferretti, A., Prati, C. & Rocca, F. 2000, 'Nonlinear subsidence rate estimation using permanent scatterers in differential SAR interferometry', IEEE Transactions on Geoscience and Remote Sensing, vol. 38, no. 5 I, pp. 2202-12, DOI:10.1109/36.868878.
Ferretti, A., Prati, C. & Rocca, F. 2001, 'Permanent scatterers in SAR interferometry', IEEE Transactions on Geoscience and Remote Sensing, vol. 39, no. 1, pp. 8-20, DOI:10.1109/36.898661.
Ferro-Famil, L. & Pottier, E. 2016, 'Synthetic Aperture Radar Imaging', Microwave Remote Sensing of Land Surfaces: Techniques and Methods, pp. 1-65, DOI:10.1016/B978-1-78548-159-8.50001-3.
Flores-Anderson, A.I., Herndon, K.E., Thapa, R.B. & Cherrington, E. 2019, The SAR Handbook, NASA.
Foumelis, M., Blasco, J.M.D., Desnos, Y.L., Engdahl, M., Fernández, D., Veci, L., Lu, J. & Wong, C. 2018, 'ESA SNAP - Stamps integrated processing for Sentinel-1 persistent scatterer interferometry', International Geoscience and Remote Sensing Symposium (IGARSS), vol. 2018, no. 1, pp. 1364-7, DOI:10.1109/IGARSS.2018.8519545.
Gabriel, A.K., Goldstein, R.M. & Zebker, H.A. 1989, 'Mapping small elevation changes over large areas: differential radar interferometry', Journal of Geophysical Research, vol. 94, no. B7, pp. 9183-91, DOI:10.1029/JB094iB07p09183.
Geomatica 2015, Geomatica Training Guide: SAR Processening with Geomatica, PCI Geomatics, Canada, viewed 25 November 2022, <Geomatica 2015, Geomatica Training Guide: SAR Processening with Geomatica, PCI Geomatics, Canada, viewed 25 November 2022, https://www.researchgate.net/profile/Mohamed_Mourad_Lafifi/post/How_to_generate_a_Coherency_matrix_in_SAR_Polarimetry/attachment/59d648ac79197b80779a353e/AS%3A467837115473921%401488552469027/download/TrainingGuide-SAR-processing-with-Geomatica.pdf>.
Grassi, F. & Mancini, F. 2019, 'Sentinel-1 data for ground deformation monitoring: the SNAP-StaMPS workflow', Dief, no. 2019, pp. 20-5.
Hanssen, R.F. 2001, Radar Interferometry: Data Interpretation and Error Analysis, 1st edn, vol. 2, Springer Netherlands, Dordrecht.
Hexagon 2019, 'Imagine SAR Interferometry', Hexagon, viewed 21 October 2019, <Hexagon 2019, 'Imagine SAR Interferometry', Hexagon, viewed 21 October 2019, https://hexagon.com/products/imagine-sar-interferometry>.
Hoeser, T. 2020, 'thho/StaMPS_Visualizer: Baseline Plot (v3.0-beta) - Zenodo', Zenodo, viewed 25 November 2022, <0-beta) - Zenodo', Zenodo, viewed 25 November 2022, https://zenodo.org/record/4407188>.
Hooper, A.J. 2008, 'A multi-temporal InSAR method incorporating both persistent scatterer and small baseline approaches', Geophysical Research Letters, vol. 35, no. 16, pp. 1-5, DOI:10.1029/2008GL034654.
Hooper, A. & Zebker, H.A. 2007, 'Phase unwrapping in three dimensions with application to InSAR time series', Journal of the Optical Society of America A, vol. 24, no. 9, p. 2737-47, DOI:10.1364/josaa.24.002737.
Hooper, A., Segall, P. & Zebker, H. 2007, 'Persistent scatterer interferometric synthetic aperture radar for crustal deformation analysis, with application to Volcán Alcedo, Galápagos', Journal of Geophysical Research: Solid Earth, vol. 112, no. 7, pp. 1-21, DOI:10.1029/2006JB004763.
Hooper, A., Zebker, H., Segall, P. & Kampes, B. 2004, 'A new method for measuring deformation on volcanoes and other natural terrains using InSAR persistent scatterers', Geophysical Research Letters, vol. 31, no. 23, pp. 1-5, DOI:10.1029/2004GL021737.
IBGE 2021, 'Cidades e Estados - Maceió', Instituto Brasileiro de Geografia e Estatística, viewed 21 December 2022, <IBGE 2021, 'Cidades e Estados - Maceió', Instituto Brasileiro de Geografia e Estatística, viewed 21 December 2022, https://www.ibge.gov.br/cidades-e-estados/al/maceio.html>.
Jawak, S.D., Bidawe, T.G. & Luis, A.J. 2015, 'A Review on Applications of Imaging Synthetic Aperture Radar with a Special Focus on Cryospheric Studies', Advances in Remote Sensing, vol. 04, no. 02, pp. 163-75, DOI:10.4236/ars.2015.42014.
Kirscht, M. & Rinke, C. 1998, '3D Reconstruction of Buildings and Vegetation from Synthetic Aperture Radar (SAR) Images', IAPR Workshop on Machine Vision Application.
L3Harries 2021, ENVI ® SARSCAPE ® Process, analyze and solve problems with SAR data, viewed 22 January 2023, <L3Harries 2021, ENVI ® SARSCAPE ® Process, analyze and solve problems with SAR data, viewed 22 January 2023, https://www.l3harrisgeospatial.com/Portals/0/pdfs/L3HG_21_SARscape_sell_sheet_Web.pdf>.
Lame, D.B., Born, G.H., Dunne, J.A., Spear, A.J. & Yamarone, C.A. 1980, 'Seasat Performance Evaluation: The First Two Steps', IEEE Journal of Oceanic Engineering, vol. 5, no. 2, pp. 72-3, DOI:10.1109/JOE.1980.1145454.
Li, Z. & Bethel, J. 2008, 'Image coregistration in SAR interferometry', International Archives of the Photogrammetry, Remote Sensing and Spatial Information Sciences - ISPRS Archives, vol. 37, pp. 433-8.
Maceió 2000, LEI-4952-2000-MACEIO-AL, Prefeitura Municipal de Maceió, Maceió, viewed 23 January 2023, <Maceió 2000, LEI-4952-2000-MACEIO-AL, Prefeitura Municipal de Maceió, Maceió, viewed 23 January 2023, https://leismunicipais.com.br/AL/MACEIO/LEI-4952-2000-MACEIO-AL.pdf>.
Massonnet, D. & Feigl, K.L. 1998, 'Radar interferometry and its application to changes in the earth’s surface', Reviews of Geophysics, vol. 36, no. 4, pp. 441-500, DOI:10.1029/97RG03139.
Mora, B. 2019, 'Sentinel Application Platform (SNAP) - Help', European Space Agency, viewed 22 January 2023, < 2019, 'Sentinel Application Platform (SNAP) - Help', European Space Agency, viewed 22 January 2023, https://gofcgold.org/sites/default/files/2019-04/ESA_SNAP-Toolbox_BriceMora.pdf>.
Perissin, D., Wang, Z. & Wang, T. 2011, 'The SARPROZ InSAR tool for urban subsidence/manmade structure stability monitoring in China', 34th International Symposium on Remote Sensing of Environment - The GEOSS Era: Towards Operational Environmental Monitoring.
Rosen, P.A., Hensley, S., Joughin, I.R., Li, F.K., Madsen, S.N., Rodriguez, E. & Goldstein, R.M. 2000, 'Synthetic aperture radar interferometry', Proceedings of the IEEE, vol. 88, no. 3, pp. 333-82, DOI:10.1109/5.838084.
Rosen, P.A., Gurrola, E., Sacco, G.F. & Zebker, H. 2012, ‘The InSAR scientific computing environment’, Proceedings of the European Conference on Synthetic Aperture Radar, EUSAR, vol. 2012- April, pp. 730-3.
Sandwell, D., Mellors, R., Tong, X., Wei, M. & Wessel, P. 2011, 'GMTSAR: An InSAR Processing System Based on Generic Mapping Tools David', Library - Scripps Digital Collection, pp. 96.
Sheng, Y., Wang, Y., Ge, L. & Rizos, C.2012, 'Differential Radar Interferometry and Its Application in Monitoring Underground Coal Mining-Induced Subsidence', Science, no. 1989, pp. 227-32.
Singh Virk, A., Singh, A. & Mittal, S.K. 2018, 'Advanced MT-InSAR Landslide Monitoring: Methods and Trends', Journal of Remote Sensing & GIS, vol. 07, no. 01, 1000225, DOI:10.4172/2469-4134.1000225.
Sowter, A., Bin Che Amat, M., Cigna, F., Marsh, S., Athab, A. & Alshammari, L. 2016, 'Mexico City land subsidence in 2014-2015 with Sentinel-1 IW TOPS: Results using the Intermittent SBAS (ISBAS) technique', International Journal of Applied Earth Observation and Geoinformation, vol. 52, pp. 230-42, DOI:10.1016/j.jag.2016.06.015.
Varnes, D.J. 1978, 'Slope Movement Types and Processes', in R.L. Schuster & R.J. Krizek (eds), Landslides: Analysis and Control, 176th edn, National Academy of Sciences, Washington, pp. 11-3.
Vassileva, M., Al-Halbouni, D., Motagh, M., Walter, T.R., Dahm, T. & Wetzel, H.U. 2021, 'A decade-long silent ground subsidence hazard culminating in a metropolitan disaster in Maceió, Brazil', Scientific Reports, vol. 11, no. 1, e7704, DOI:10.1038/s41598-021-87033-0.
Werner, C., Wegmüller, U., Strozzi, T. & Wiesmann, A. 2003, 'Interferometric Point Target Analysis for Deformation Mappin', International Geoscience and Remote Sensing Symposium (IGARSS), vol. 7, no. 1, pp. 4362-4, DOI:10.1109/IGARSS.2003.1295516.
Wu, C., Liu, K.Y. & Jin, M. 1982, 'Modeling and a Correlation Algorithm for Spaceborne SAR Signals', IEEE Transactions on Aerospace and Electronic Systems, vol. 18, no. 5, pp. 563-75.
Yunjun, Z., Fattahi, H. & Amelung, F. 2019, ' Small baseline InSAR time series analysis: Unwrapping error correction and noise reduction', Computers and Geosciences, vol. 133, 104331, DOI:10.1016/j.cageo.2019.104331.
Zhang, B., Chen, Yan, Chen, Yunping & Bu, X. 2022, 'Deformation Extraction Method of Transmission Tower Foundation using PS-InSAR', IGARSS 2022 - 2022 IEEE International Geoscience and Remote Sensing Symposium, Malaysia, pp. 2935-8.
Zhang, Y., Meng, X.M., Dijkstra, T.A., Jordan, C.J., Chen, G., Zeng, R.Q. & Novellino, A. 2020, 'Forecasting the magnitude of potential landslides based on InSAR techniques', Remote Sensing of Environment, vol. 241, 111738, DOI:10.1016/j.rse.2020.111738.
Funding information
Data availability statement
Author notes
E-mail: sergioalvesjq@gmail.comE-mail:ckrueger@ufpr.brE-mail:regiane@ufpr.brE-mail:laurent.polidori@ufpa.br
Conflict of interest declaration
