Article
Trace Elements in Sediment and Urban Water Samples: an Assessment of Metal Pollution
Elementos Traço em Amostras de Sedimentos e Água Urbana: uma Avaliação da Poluição por Metais
 Jéssika Aparecida Santos De Almeida jee.almeida@yahoo.com.br
Sueli Pércio Quináia spquinaia@unicentro.br
Chalder Nogueira Nunes chaldernunes@gmail.com
Aline Bortolanza Jansen alinebortolanza13@gmail.com
Izabelly Karol Poncio de Oliveira izabelly.palinski@gmail.com
Jéssika Aparecida Santos De Almeida jee.almeida@yahoo.com.br
Sueli Pércio Quináia spquinaia@unicentro.br
Chalder Nogueira Nunes chaldernunes@gmail.com
Aline Bortolanza Jansen alinebortolanza13@gmail.com
Izabelly Karol Poncio de Oliveira izabelly.palinski@gmail.com
Trace Elements in Sediment and Urban Water Samples: an Assessment of Metal Pollution
Anuário do Instituto de Geociências, vol. 46, 57425, 2023
Universidade Federal do Rio de Janeiro
Received: 13 March 2023
Accepted: 28 May 2023
Abstract: In this study, trace elements (Cd, Cr, Cu, Pb and Zn) concentrations were determined by flame atomic absorption spectrometry (FAAS) in environmental compartments (water and superficial sediments) near places of vehicle use and maintenance, aiming to investigate if in these places the trace elements had high concentrations. The content of trace elements found on the samples was compared to the maximum values recommended by resolutions of CONAMA (Conselho Nacional do Meio Ambiente) n. 357 from 2005 for water and n. 454 from 2012 for sediments. Points 11 and 13 were the most critical, with concentrations higher than the recommended for the elements Cu and Pb, either for water or sediment samples. Geoaccumulation index (Igeo) for Cd and Cr in the sediment samples indicated high to extreme contamination in points 5 and 13, while the other elements indicated moderated contamination.
Keywords: Environmental compartments, Vehicles, Urban contamination.
Resumo: Neste estudo, as concentrações de elementos traço (Cd, Cr, Pb e Zn) foram determinadas por espectrometria de absorção atômica com chama (FAAS) em compartimentos ambientais (água e sedimentos superficiais) próximos a locais de uso e manutenção de veículos, com o objetivo de investigar se nesses locais esses elementos apresentavam concentrações elevadas. Os teores dos elementos determinados nas amostras foram comparados com os valores máximos recomendados pelas resoluções do CONAMA (Conselho Nacional do Meio Ambiente) n. 357 de 2005 para água e n. 454 de 2012 para sedimentos. Os pontos 11 e 13 foram os mais críticos, com concentrações superiores às recomendadas para os elementos Cu e Pb, seja para amostras de água ou de sedimentos. O Índice de Geoacumulação (Igeo) para Cd e Cr nas amostras de sedimentos indicou contaminação elevada a extrema nos pontos de coleta 5 e 13, enquanto os demais elementos indicaram contaminação moderada.
Palavras-chave: Compartimentos ambientais, Veículos, Contaminação urbana.
1 Introduction
It is said that urbanization has been one of the great responsible for the appearance of environmental problems, such as the presence and increase of the concentration of trace elements in environmental compartments, which in one way or another end up affecting the biota (Ma et al. 2016). Trace elements are considered fundamental anthropogenic contaminators in the environment since they present risks to human health, natural ecosystems, and living organisms due to their toxicity and bioaccumulation (Ganugapenta et al. 2018).
The modern lifestyle imposes on many people great displacements to go from their houses to the workplace, demanding thus individual or collective means of transportation. Although they are very important, activities related to car maintenance may, together with natural use, be related to the trace element input in soil and in water.
Activities such as fluid substitution, preventive and corrective maintenance, battery change and recovery, and even car washing are possible sources of contamination. Thus, these contaminants eventually deposit themselves on roadsides, reaching bodies of water and accumulating in the bottom sediments, or they are dissolved in the water, harming the quality of the environment (Ashraf et al. 2020). Vithanage et al. (2022) and Vazquez-Arias, Martín-Peinado and Parviainen (2023) emphasizes that the presence of trace elements in urban areas derives from atmospheric deposition, surface abrasion and cleaning, and from the accumulation, deposition and transport of urban residues as the activity of car traffic.
Trace elements in water are found in different forms, such as dissolved fractions (free ions, complexed with organic soluble compounds) and in particulate fractions (associated with organic matter), depending on the physical and chemical conditions of the environment (Melo et al. 2012). Also, they accumulate in the sediments and may be available again for the water column through actions of reduction-oxidation, activity of the water organisms, and human activities (Cotta, Rezende & Piovani 2006).
The sediment accumulated historical data about the effect of anthropogenic factors, as they have a high capacity for contaminant storage (Abata et al. 2013; Soliman & Nasr 2015). It is noteworthy then that they are indicators of water quality, as they register the possible effects of anthropic emissions since they can retain contaminants (Moraes, Mortatti & Lopes 2011). The present work was done in the urban perimeter of the city of Guarapuava - PR, Brazil, to identify the presence of trace elements (Cd, Cr, Cu, Pb and Zn) in environmental compartments (water and superficial sediments), aiming to relate the traffic and car maintenance areas with the concentration of possible pollutant trace elements.
2 Materials and Methods
2.1 Sample Collection
Water and superficial sediment samples were collected in thirteen points distributed in the city of Guarapuava - PR, and a point free of anthropic contamination (green areas in urban spaces: woods and green corridors) that we call local background point in this work.), to have a pattern of contrast to the samples (Figure 1). Collection points were strategically chosen, and they were all in places with high traffic, such as main avenues or points of car maintenance or car washing, such as garages, tire shops, scrap yards, and battery shops. The water samples were collected in polyethylene plastic bottles with a volume of one liter, previously decontaminated with 5% (HNO3) acid shower, at a 10 cm depth from the water surface. Two bottles were collected at each point to obtain enough volume for all the analyses. One of the samples was acidified with a solution of HNO3 (2,0 mol L-1) to determine the dissolved and total elements. In contrast, the other sample that was not acidified was used to determine the other physical-chemical parameters of the sample (conductivity, turbidity, pH and total dissolved solids) (Nascimento et al. 2015). The samples with superficial sediments were collected close to the river margins and in low depth as compared to the water surface. Samples were dried at room temperature, they were protected from the incidence of solar light, macerated in mortar, and sieved on 1 mm mesh sieves.
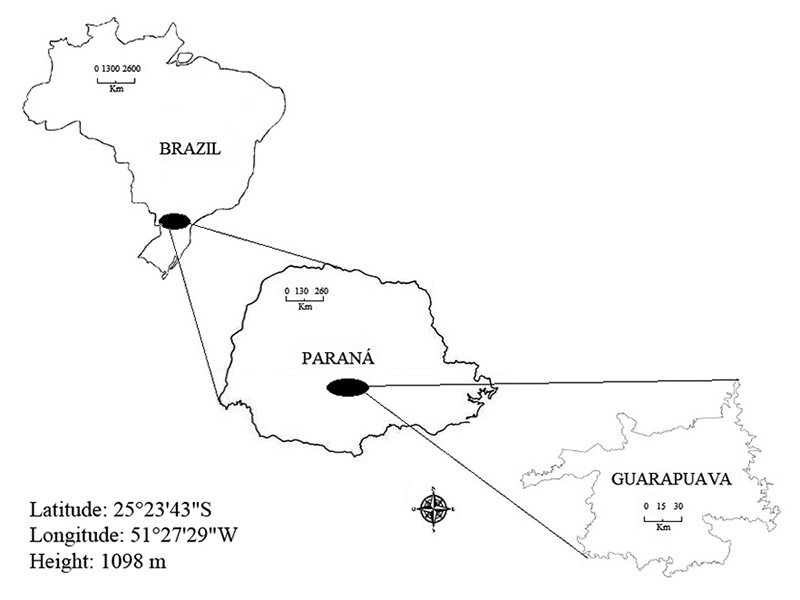
Figure 1
Location of samples collected in the urban area of Guarapuava City. Paraná, Brazil.
Source: Author.
2.2 Reagents and Solutions
All the glassware used in the experiments was previously decontaminated using a nitric acid bath (5% v/v) for a minimum period of 24 h. The solutions were prepared with ultrapure water obtained by a Milli - Q purification system (Merck Millipore). Nitric acid (Sigma - Aldrich. 65% m/v), hydrochloric acid (BIOTEC, 37% m/v), hydrogen peroxide (BIOTEC 30% m/v), sodium hydroxide (REATEC, 99%) and standard solutions of Cd, Cr, Cu, Pb and Zn (1000 mg L -1 P.A.- BIOTEC- BRASIL) were also used.
2.3 Preparation of Samples
2.3.1 Water
An aliquot portion of the sample was used for the analysis of the physical-chemical parameters, such as pH, conductivity, turbidity, and total dissolved solids (TDS). The determination of the total dissolved solids was based on the method proposed by Silva (1997). A 50 mL aliquot of the non-acidified sample was transferred to a porcelain capsule previously dried in an oven for 24 h and weighed. The aliquot was evaporated to dryness on a heating plate at 300 ºC, after which the total dissolved solids content was determined by weight difference. The analyses were performed in triplicates.
To determine the content of trace elements in the soluble fraction, an aliquot of 200 mL of the acidified sample, which was vacuum filtered with cellulose acetate membrane (0,45 µm), was used to separate the dissolved fraction of the particulate material (Parks et al. 2004). The rest of the acidified sample was used to determine the content of total elements. The sample was pre-concentrated in a heating plate at a temperature of 120° C to reach a volume of 10 mL. Next, it was digested with concentrated HNO3 and H2O2 (3:1) and was decreased to 5 mL (Reis et al. 2011).
2.3.2 Sediments
The pH of the sediment samples was determined in water according to the Manual of Analysis Methods (Manual de Métodos de Análise) from EMBRAPA (1997). The organic matter (OM) was determined by gravimetry, in which 1.0 g of the sample was weighed in analytical weight and was taken to a muffle furnace at 500° C for 4h, and after this period, the fraction lost in the calcination was referred to OM in % in the samples (Kiehl 1985). The granulometric analysis was performed according to the densimeter methodology, using a solution of NaOH (1 mol L-1) as a dispersant (EMBRAPA 1997).
To quantify the content of trace elements that are weakly connected to the sediments, 1.0 g of sample weighted in analytical weight was transferred to a 125 mL Erlenmeyer, with 25 mL of HCl solution (0.1 mol L-1), and horizontal agitation of 220 rpm was performed for 2 hours at 25° C. The suspension was filtered by gravity using 80 g m-2 grammage filter paper (Cotta, Rezende & Piovani 2006). To quantify the pseudo-total content of trace elements, which are elements strongly connected to the sediment structure, a method adapted from the United States Environmental Protection Agency - METHOD 3050B (USEPA 1996) was used. 1 mL of ultrapure water and 3 mL of concentrated HNO3 P.A. were added to 0.5 g of sample in tubes for the digester block and heated for 1 h at a temperature of 100º C. After this period, 1 mL of HNO3 concentrated P.A. and 1 mL of 30% (v/v) H2O2 were added to the solution, and it was heated for 30 more minutes. The samples were made up to 10 mL and stored under refrigeration. This methodology was monitored with certified reference material (CRM) PACs - 2 for sediments from the National Research Council of Canada (Ottawa, Canada) to evaluate the recovery of the percentage of extraction of trace elements that were present in the mentioned material. The determination of the pseudo-total content was performed in triplicates.
The quantification of trace elements in water and superficial sediments was performed with a Varian Atomic Absorption Spectrometer (FAAS), model Spectra AA-220, equipped with hollow cathode lamps and a deuterium lamp as background corrector. The measures of absorbance were performed in the mode area integration through the calibration curve method with the standards of the trace elements that were evaluated. The solutions of the standards were made by diluting a stock standard solution of (1000 mg L -1 ), containing the ions of interest and made up to 25 mL. Five concentration ranges were considered for each element studied. The samples were prepared in triplicates, and the signal of the blank experiment was discounted. The limits of detection (LODs) and quantification (LOQs) were calculated by LOD = 3.3s/b1 and LOQ = 10s/b1, using signal-to-noise, respectively, as well as the parameters of the linear equation. Table 1 presents the atomization conditions FAAS for the determination of the trace elements evaluated.
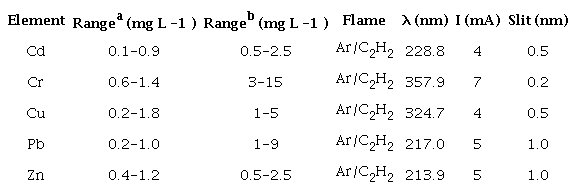
a Range for water samples; b Range for sediment samples.
3 Statistical Analysis
The experimental data of the trace elements in water and superficial sediment samples were evaluated by the principal component analysis (PCA) in an exploratory way, considering all the variables involved, to verify the possible similarities or differences among the points studied (Pellerano et al. 2012).
4 Geoaccumulation Index (Igeo)
The values of the geoaccumulation index can be calculated according to the following Equation 1:
in which Cn is the measured concentration of the evaluated metal (n) in the sediment, Bn is the geochemical background value of the element n in the surrounding rocks, and 1.5 is the correction factor addressed due to lithogenic effects (Belhadj, Aubert & Youcef 2017).
5 Results and Discussion
5.1 Physical-Chemical Evaluation and Analysis of Fraction in Water
The values obtained for the physical-chemical parameters, as well as the concentration content of the trace elements analyzed in water samples, were compared to the values recommended by the Conselho Nacional do Meio Ambiente nº 357 (CONAMA 2005) for class II fresh water. Table 2 presents the data from the physical-chemical parameters related to water samples collected at different points in Guarapuava - PR. According to Esteves (2011), conductivity is related to the rain periods; in periods with a lower index of rain, there is an increase in ion concentration, and consequently, the conductivity increases. The higher conductivity values were observed in the samples from points 3, 6, 8, 9, 10 and 13 (Table 2). The CONAMA resolution Nº 357 does not have reference values for the conductivity parameter. The turbidity must not exceed 100 NTU (CONAMA 2005). In this study, the points have values below the recommended.
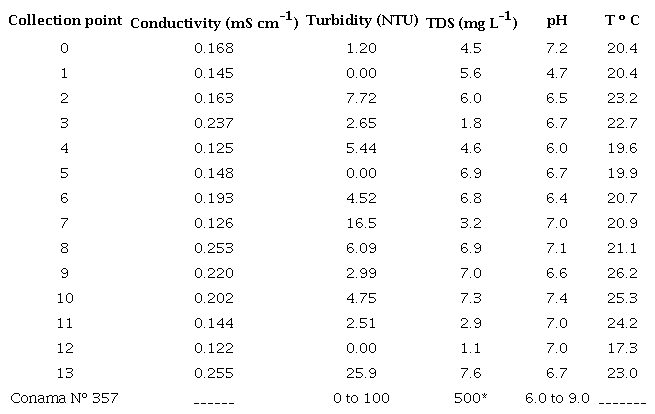
TDS = total dissolved solids
The rainwater that runs over city streets carries pollutants that may deteriorate the quality of surface water resources. Thus, urban stormwater ends up causing increases in the levels of total dissolved solids (TDS) (dos Santos, dos Santos & dos Santos 1997). According to the resolution CONAMA no 357 for Class II Fresh Waters, the maximum allowed content is 500 mg L -1 . The TDS concentration ranged from 1.1 to 7.6 mg L -1 , which is much lower than the maximum value indicated by the resolution. The pH values did not differ much between the points analyzed, except for point 1, as shown in Table 2. All the samples from the points collected presented a pH around 6.0 to 7.0, indicating that the pH values of the waters analyzed were within the limits recommended by the resolution of CONAMA No 357 for Class II waters. The pH of point 1 was below the value recommended by CONAMA (2005). This point is close to a "Car Wash"; therefore, acid detergents used for cleaning cars may be associated with the pH alteration. The temperature of the samples was directly related to the collection times and the weather conditions. The lowest temperature was recorded in the sample from point 12 (17.3º C), while the highest temperature was recorded in the sample from point 9 (26.2º C). Tables 3 and 4 present the concentrations measured by FAAS, as well as the concentrations after the calculations by the trace elements dilution (Cd, Cr, Cu, Pb and Zn), both dissolved and total in water. For the element Cd, both in the soluble fraction and in the total fraction, most of the measurements in the analyzed points were below the LOD, except for point 13, which presented a concentration greater than the maximum allowed by CONAMA (2005). Likewise, the element Cr in the soluble fraction was below the LOD. However, Cr in the total fraction, after calculating the dilution fraction, presented a significant concentration of 0.03 mg L -1 .The concentrations of Cu (Tables 3 and 4) in soluble and total fractions in waters at points 0 to 12 were lower than the maximum concentration allowed by CONAMA (2005). However, at point 13, the soluble and total Cu concentrations were higher than the maximum recommended value. For soluble Pb, the concentrations ranged from < LOD to 0.02 mg L -1 and for total Pb from < LOD to 0.05 mg L -1 , after calculation of the dilution factor. It is worth noting that points 11 and 13 had the highest concentrations of the investigated elements. Point 11 is located near a city park, where there is a great movement of cars, and point 13 is located in the center of the city, near two "Car Washes", a tire repair shop, and an automobile battery reconditioning plant. These sites can be sources of anthropic contamination to the environment, along with the wear and tear of automobiles, as they release trace elements that can be deposited in the dust of asphalt and thus carried by winds and rain in these aquatic systems.
For Zn, most of the sampled points showed significant concentrations. This is due to the fact that Zn is a common constituent in vehicle components (Akhter & Madany 1993; Nduka, Kelle & Amuka 2019). Thus, the significant presence of these elements in the samples may be associated with this anthropic source. The zero point (without apparent anthropic interference), compared to the other points (1 to 13), always showed concentrations below the LOD. However, in waters collected near the areas of maintenance and use of automobiles (1 to 13), the concentrations of elements, in some points, tended to be higher, thus signaling that there may be an indication of a negative impact of anthropogenic origin.
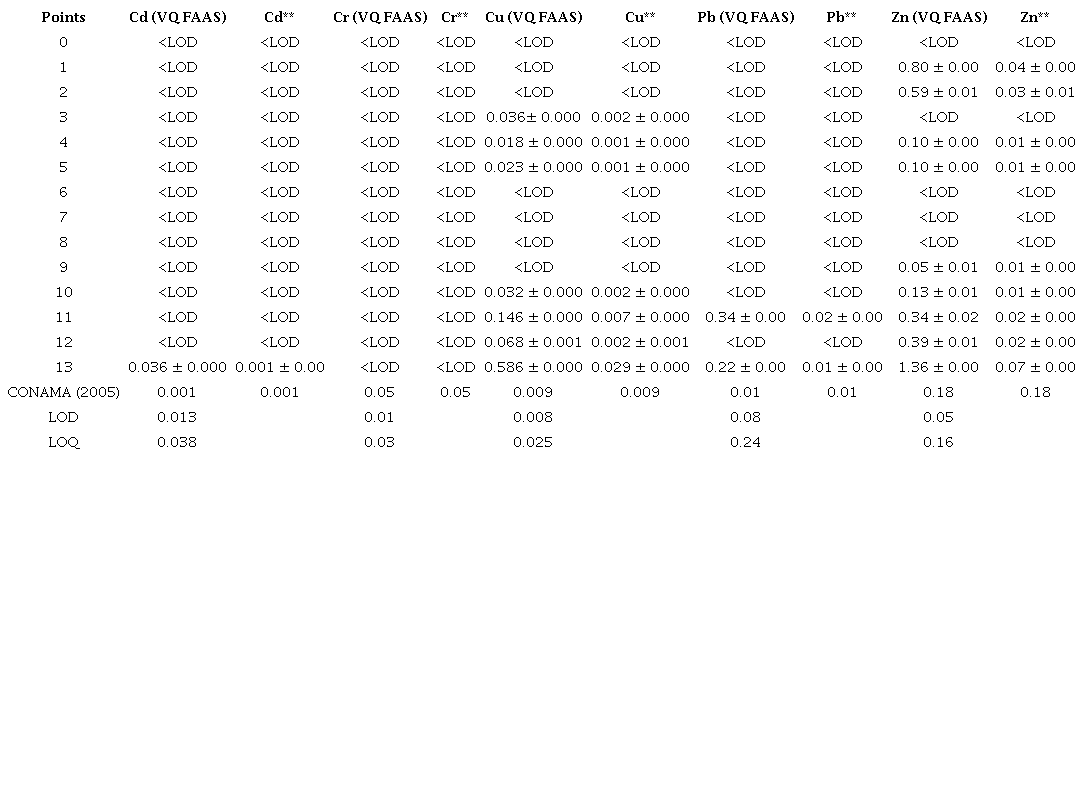
LOD = Detection Limit; LOQ = Quantification Limit; VQ FAAS= Volume Quantified by FAAS; **= Concentration after calculation of the dilution factor.
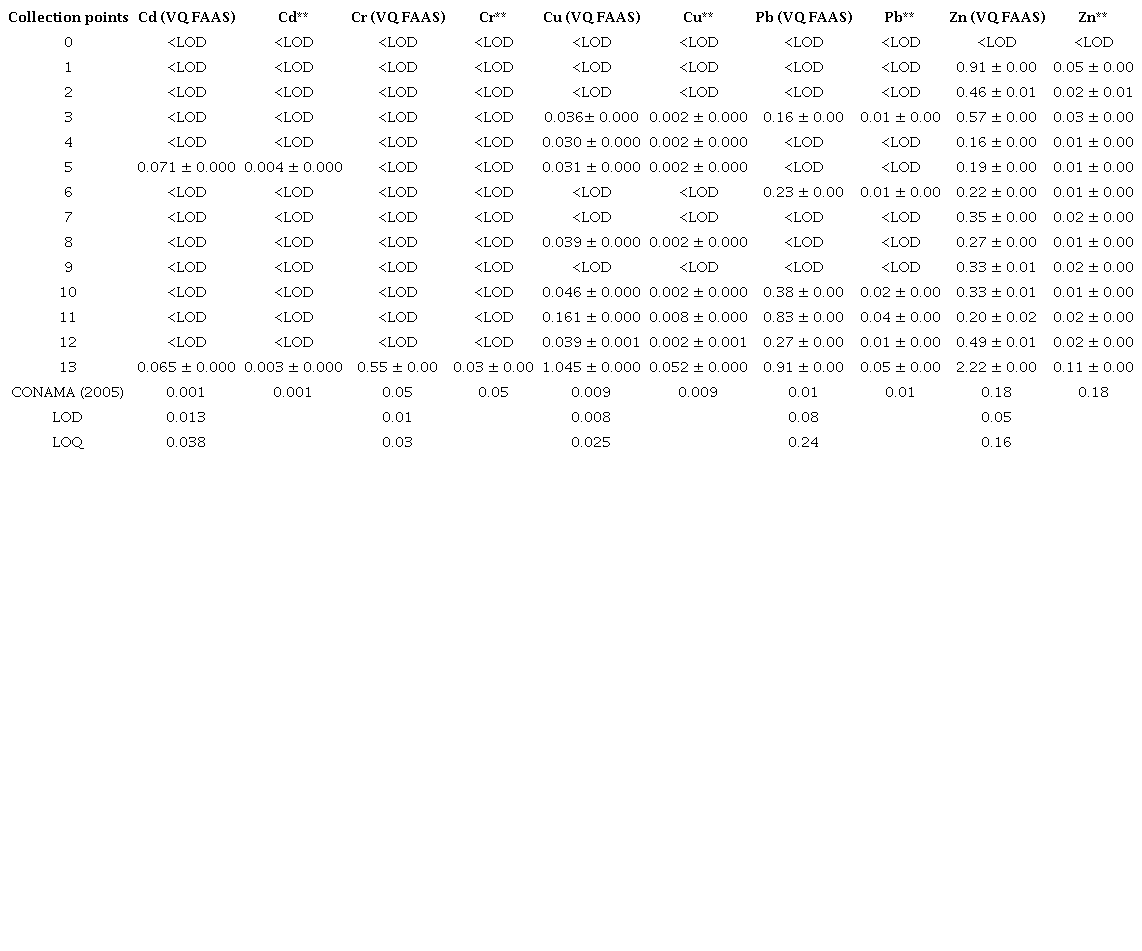
LOD = Detection Limit; LOQ = Quantification Limit; VQ FAAS= Volume Quantified by FAAS; **= Concentration after calculation of the dilution factor.
5.2 Characterization of the Superficial Sediment Samples
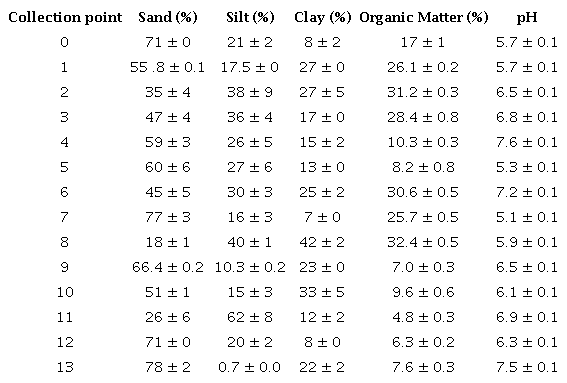
The parameters of sand, silt, clay, organic matter and pH determined in the surface sediments are reported in Table 5. The highest sand contents were observed in points 0, 7, 12 and 13, with 71, 77, 71 and 78% respectively. Points 7, 12 and 13 present highly urbanized areas, while point 0 is located in a green area in urban spaces. pH values with neutral to slightly acidic character were observed in the points evaluated, with the lowest values recorded in points 5 and 7 (Table 5). The other points varied between pH 6 and 7. According to Tukura, Kagbu and Gimba (2007), the pH variation in sediments influences the release or adsorption of each trace element in the sediment fraction. At high pH, it reduces the desorption of trace elements and has a high buffer capacity against acidic conditions that can be caused by waste accumulation. Sediments are considered organic when they present an organic matter content higher than 10%, and inorganic when the percentage is less than 10% (Esteves 2011). Thus, the sediment samples from points 5, 9, 10, 11, 12 and 13 were characterized as inorganic and the rest as organic sediments.
The methodology used in the extraction of the pseudototal elements was monitored with certified reference material (CRM) PACs - 2 for sediments from the National Research Council of Canada (Ottawa, Canada). The recovery of each trace element is presented in Table 6, together with the values of certified concentrations, the extracted concentrations, and the recoveries of each element. The lowest recovery of the elements at CRM was Cr (87%), while Cd, Cu, Pb and Zn range from 95% to 98%.
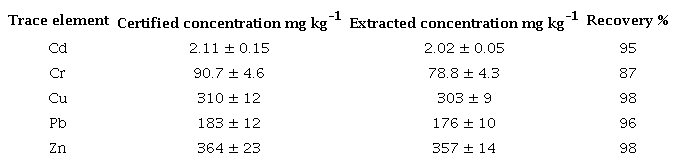
Table 7 shows the concentration of the potentially bioavailable elements, that is, trace elements adsorbed in sediments and which are weakly linked to the particles, thus having greater likelihood of being released into the environment (Cotta, Rezende & Piovani 2006), as well as pseudototal elements, which are strongly linked to the sediment structure, and which are influenced by organic matter, presenting less likelihood of being transferred into the environment (Riberinho 2015). The concentrations investigated in sediment samples were compared with level 1, Threshold Effect Level (TEL), and level 2, Probable Effect Level (PEL), reference values of the resolution of the National Council of the Environment n°. 454 from November 1st, 2012 (CONAMA 2012), which is based on the levels from official Canadian, North American and European publications. Level 1 - TEL refers to the threshold effect level, below which there is a lower probability of adverse effects on the biota while Level 2 - PEL, represents the probable effect level above which there is a greater probability of adverse effects on the biota. It is worth noting that this resolution does not present "cutoff values", but rather ranges of levels, in which there are possibilities or not of adverse effects on the biota (Frohlich & Naspolini 2015). The metal contents determined in the local background point sediment sample were considered as geochemical background values, since this sampling point is located in a preservation area. The background values for the analytes were determined directly and expressed as the mean. All other samples were compared to the local background point as well.
Regarding the potentially bioavailable fraction (labile), it was observed that no trace element exceeded the level of the adverse effects on the biota, considered a critical level, probably leading to adverse effects (level 2: PEL). The concentration of Cd in point 13 was higher than the reference concentration of CONAMA nº 454 to the TEL effect, denoting that there may occasionally be adverse effects on the biota. The other concentrations of the elements investigated in the sediment samples showed less significant levels and were lower than level 1 (TEL), thus indicating no adverse effects. With regard to the local background sample, values lower than the LOD were observed for all analytes, except for zinc. Comparing the determined zinc contents with the local background value, it can be seen that the others were lower than the reference value. For the other analytes, mainly for copper and lead, higher values than the reference values were observed in several samples, indicating possible contamination.
In the pseudototal fraction, the concentration of trace elements in the studied region and based on CONAMA (2012) (Table 7) showed that the concentrations of Cd were lower than the LOD, except for points 12 and 13. For the elements Cr and Cu, the concentrations observed were lower than the values of level 2 (PEL), which are expected adverse effects on the biota. However, for the element Cu, the concentrations in points 1, 3, 4, 7, 11 and 13 were in the range between TEL and PEL, indicating that there might be moderate relevance to the biota. Pb was found in concentrations higher than level 2 (PEL) in points 8, 10, 11 and 13, indicating that there might be probable adverse effects on the biota. For the element Zn, the concentrations of trace elements at the points investigated, with the exception of point 4, were lower than the concentration of level 1 (TEL), indicating no relevance to the biota. Point 4, on the other hand, had concentrations between the TEL and PEL ranges, indicating a moderate relevance to the possible occurrence of adverse effects. Comparing the determined values with the local background value, it can be noticed that for cadmium, points 12 and 13 presented higher values. Regarding chromium, points 5 and 13 were higher than the reference value. For copper and lead, all samples showed levels higher than the reference value, indicating possible contamination by these elements in the sample locations. Regarding zinc, most of the samples presented levels lower than the reference value for most of the samples, with the exception of point four These trace elements are constituents of vehicle components, such as in welds and headlight bulbs (Cd), engine block and crankshaft (Cr), batteries (Pb), as well as thrust bearings, bushings and brake pads (Cu and Zn), which during wear are deposited in streets, asphalt and are carried by rainfall, thus contributing to the concentrations observed (Akhter & Madany 1993; Nduka, Kelle & Amuka 2019). It is also pointed out that points 11 and 13 had the highest concentrations of the investigated elements for the sediment samples, mainly for the element Pb, indicating that at these points, the observed concentrations may have an anthropic origin. These points are located near two "Car Washes", a battery reconditioning plant and a tire repair shop, in which the levels observed could be related to the activities developed at these locations. Cu and Zn followed by the element Pb were the elements that presented the most expressive concentrations in the samples. This was also verified by Qadeer et al. (2019), who also observed significant concentrations of Cu, Pb and Zn in dust samples collected near streets with high densities of automobiles in the cities of Lahore and Faisalabad in Pakistan, reporting that these observed concentrations could be derived from the wear and tear of automobiles. That was also demonstrated by Katana, Jane and Harun (2013), who conducted a study with soil samples near mechanic workshop sites in urban areas in the Ngara - Nairobi region of Kenya. In that study, Katana and collaborators observed significant concentrations of elements such as Cu and Zn in soil samples, ranging from 452 ± 12 mg kg-1 to 731 ± 19 mg kg-1 for Cu and from 2962 ± 754 mg kg-1 to 3705 ± 858 mg kg- for Zn. The authors Lee et al. (1997) investigated concentrations of Zn, Pb and Cd in water and sediment samples collected in retention boxes from the A-71 highway in Sologne (France). They observed average concentrations around 0.73 µg L-1 for Cd, 0.72 µg L-1 for Pb and 77.9 µg L-1 for Zn in water samples; and 2.72 µg g-1 for Cd, 1456.0 µg g-1 for Pb and 2861.0 µg g-1 for Zn in sediment samples. These values determined in the samples were attributed to heavy vehicle traffic on the highway. Still based on the results of Table 7, it was observed that point 0 (free of anthropic contamination) showed lower concentrations of the elements Cd, Cr, Cu, and Pb in relation to the samples collected in urban areas, except only for Zn, which showed relatively significant concentrations due to pedogenetic factors.
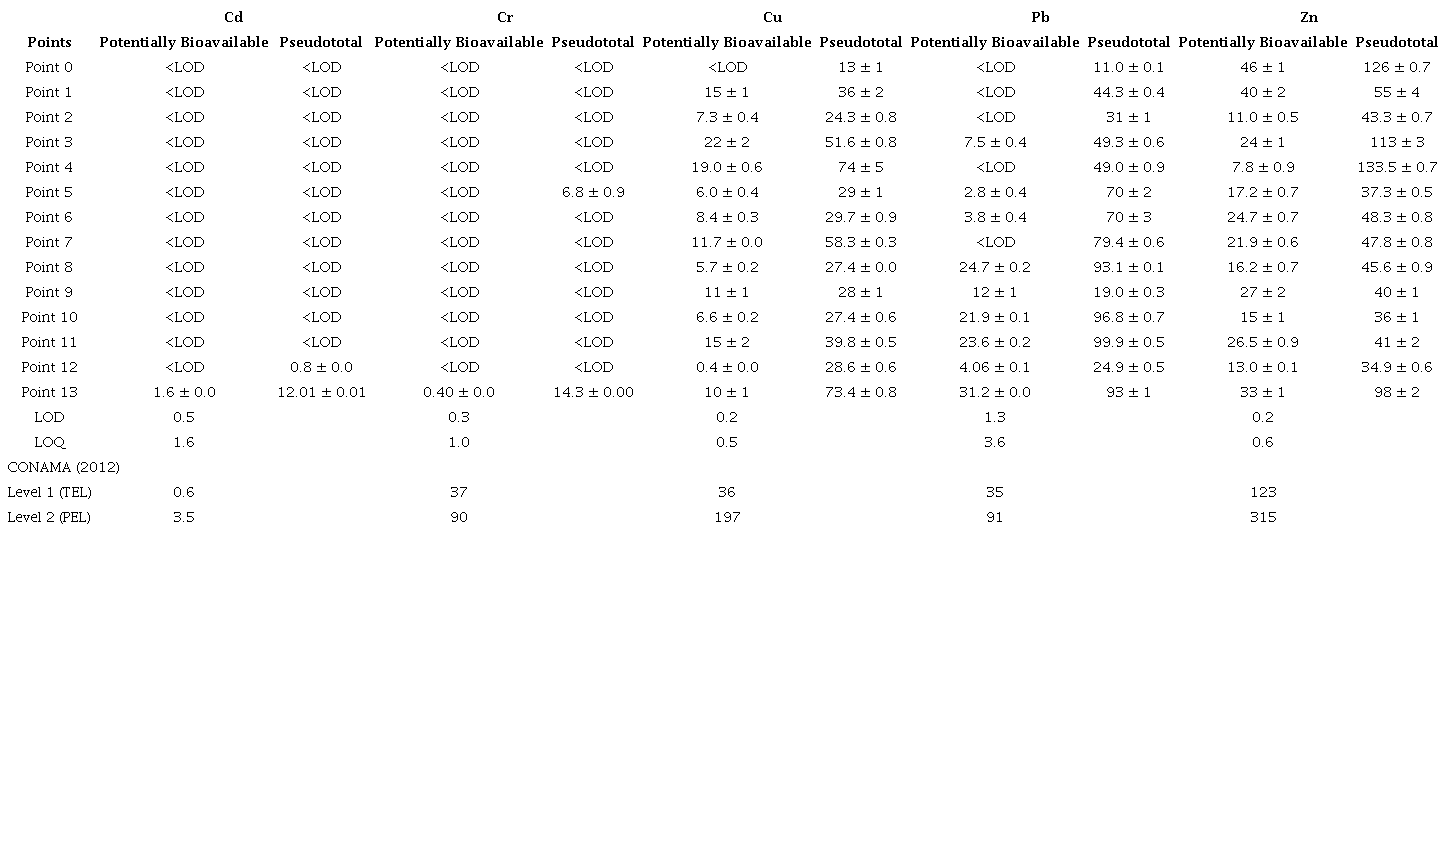
LOD = Detection Limit; LOQ = Quantification Limit; Level 1 (TEL) = unlikely adverse effects to biota; Level 2 (PEL) = likely adverse effects to biota.
5.3 Statistical Analysis of the Content of Trace Elements Using the Principal Component Analysis (PCA) in Water and Superficial Sediment Samples
The Principal Components Analysis - PCA correlated the variables involved in the measurements (dissolved and total Zn; dissolved and total Cu; dissolved and total Pb; dissolved and total Cd; total Cr; turbidity, conductivity, TDS, pH and temperature) with the water samples collected at different urban points (Figures 2A and 2B). The closer the collection points were positioned on the PCA, the greater their similarities were. In Figure 2A, it was possible to verify that there are some correlations between the variables evaluated. By factor 1, a correlation is observed among all variables evaluated with samples 11 and 13 (Figure 2B). By factor 2, the variables Zn (dissolved and total), Cu (dissolved and total), Cd (dissolved and total) and total Cr were inversely correlated with the variables pH, conductivity, TDS, turbidity and Pb, separating sample 11 from sample 13. In the positive and negative quadrants of the y-axis, there was a grouping of the other collection points, which is due to the lower concentrations of metals and physicochemical parameters quantified.
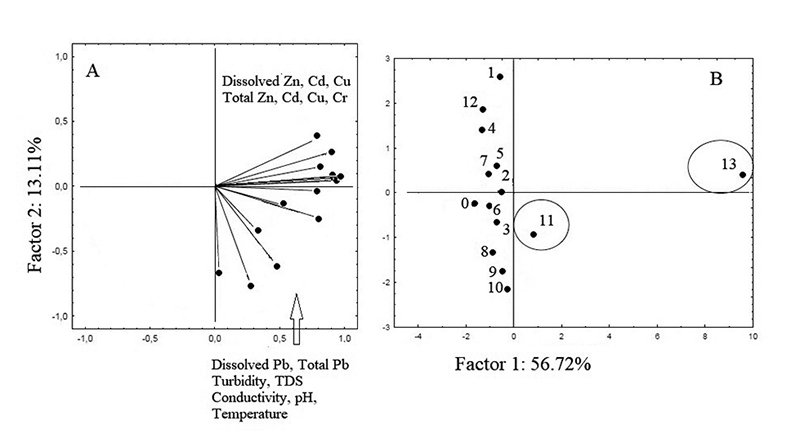
Figure 2
Graphics obtained for water samples: A. Weight; B. Score.
The trace element Pb, dissolved and total, was correlated with pH, STD, conductivity, temperature, and turbidity. The separation of collection point 13, in the upper right quadrant, was due to the high concentrations of trace elements. This sample is located in the center of the city, near two car washes, a tire repair shop, and an automotive battery reconditioning plant.
Regarding the sediment samples collected at the same points in the city, the PCA (Figure 3A) separated the points into four groups (G1 to G4). A correlation betw0een sand contents and Zn concentrations (labile and pseudo-total) for the sediment samples of groups G3 and G4 can be observed by factor 1 (Figures 3A and 3B).
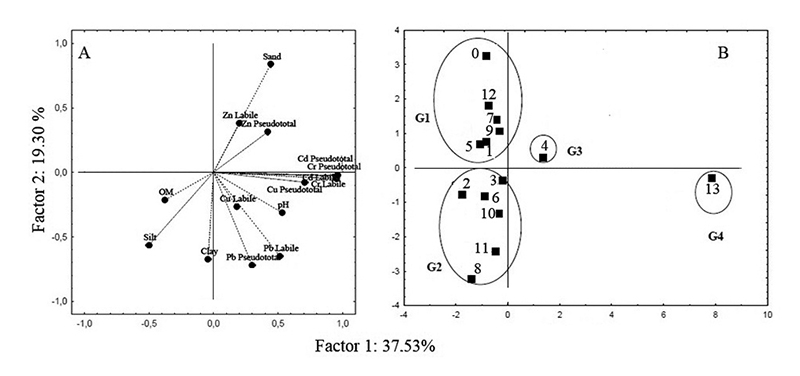
Figure 3
Graphic obtained for the surface sediment samples: A. Weights; B. Scores.
By factor 2, the most correlated variables were the Zn concentrations with the sand contents, that is, the samples that presented high sand contents tended to have higher Zn concentrations (groups G1 and G3). These variables were inversely correlated with the variables OM (organic matter), clay, silt, pH, and the concentrations of Cd, Cr, Cu, and Pb, which separated the groups G2 and G4. The contents of trace elements such as Cu and Pb, besides correlating among themselves, also presented strong correlations with the pH values in the samples. The sediments grouped in G2 showed a strong correlation with silt, clay and organic matter. The collection point that stood out the most was sample point 13 due to the highest concentrations of the trace elements and strong correlation with the variables in the lower right quadrant of the weight plot (Figure 3A and 3B).
5.4 Geo-Accumulation Index (Igeo)
The geo-accumulation index assesses the level of sediment contamination by trace elements. Collection points 1 to 13 were evaluated in relation to the local background point (protected urban forest and free of anthropic pollution source). According to the classification by Muller (1969), Igeo values < 0 are classified as class 0, with no indications of contamination; values > 0 - 1 are classified as class 1, with indications of absent to moderate contamination; values > 1 - 2 are classified as class 2, with indications of moderate contamination; values > 2 - 3 are classified as class 3, indicating moderate to heavy contamination; values > 3 - 4 are classified as class 4, indicating high contamination; values > 4 - 5 are classified as class 5, indicating high to extreme contamination; and values > 5 are classified as class 6, indicating extreme contamination. Table 8 presents the Igeo values for the sediments evaluated.
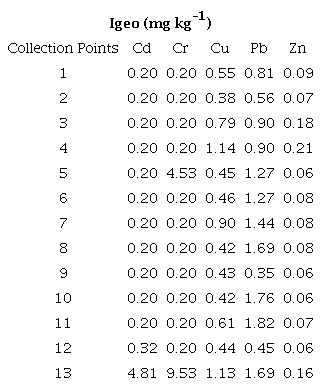
The Igeo values for Cd presented Igeo > 0 - 1 for points 1 - 12, indicating sediments with absent to moderate contamination. As for point 13, the Igeo was greater than 4 (4.81), indicating class 5, corresponding to highly contaminated sediments. For Cr, points 5 and 13 indicated contaminated sediments. Point 5 had an Igeo > 4, which indicates class 5, corresponding to high contamination, and point 13 had an Igeo > 5 (9.53), indicating class 6, which corresponds to extreme contamination. For Cu, the Igeo values were > 0 - 2, indicating sediments with absent to moderate contamination. The Igeo indices for Pb presented Igeo > 0 -1 (class 1) and Igeo > 1 - 2 (class 2), indicating sediments with absent to moderate contamination. For Zn, the Igeo values at all sampling points were lower than 1, indicating sediments with absent to moderate contamination. Based on the Igeo values, it was possible to obtain a clearer vision of the anthropic contamination of the sediments. It is possible to observe that the majority of the sediments of the sampled points were found to be moderately contaminated by the elements. While the element Cd obtained an Igeo > 4 in the sediment from point 13 with indications of high contamination, Cr obtained an Igeo > 4 in the sediment from point 5 and an Igeo > 5 in the sediment from point 13, indicating highly contaminated sediments. Thus, there seems to be greater contamination caused by the elements Cd and Cr at point 13 in relation to the others. This reinforces that there may be a continuous contribution of trace elements through anthropic activities.
6 Conclusion
Some critical points were observed for the elements evaluated which presented concentrations higher than the values recommended by the resolutions. For the water samples, points 11 and 13 presented high concentrations of Pb, both for the dissolved fraction and for the contents in the total fraction. The critical points in the sediment samples were 8, 10, 11 and 13, presenting pseudo-total concentrations greater than level 2 (PEL) of CONAMA resolution No. 454 from 2012, which cause adverse effects on the biota. The point that presented the greatest concentrations of the investigated elements, both for water and sediment samples, was point 13, indicating that there may be a possible contribution of these analytes coming from automobile degassing, such as parts, tires and brakes. In addition to the determined analyte contents, the calculated geo-accumulation indices pointed to moderate lead contamination at collection points 5, 6, 7, 8, 10, 11 and 13, high Cd contamination at collection point 13, moderate to high contamination for point 5, and extreme contamination for point 13, regarding the presence of Cr. Finally, although most of the analyzed points presented analyte concentrations lower than the maximum values recommended by responsible agencies, it is necessary to question how much anthropic activities are affecting the quality of water and sediments that cross urban centers. In addition, it is necessary to think about how this contamination can cause long-term environmental impacts and if there are some practices in these places that differentiate them from others, such as activities developed and waste management.
7 Acknowledgements
This study was financed in part by the Coordenação de Aperfeiçoamento de Pessoal de Nível Superior - Brasil (CAPES) - Finance Code 001.
8 References
Abata, E.O., Aiyesanmi, A.F., Adebayo, A.O. & Ajayi, O.O. 2013, 'Assessment of heavy metal contamination and sediment quality in the urban river: a case of ala river in Southwestern - Nigeria', IOSR Journal of Applied Chemistry, vol. 4, no. 3, pp. 56-63, DOI:10.9790/5736-0435663.
Akhter, M.S. & Madany, I.M. 1993, 'Heavy metals in street and house dust in Bahrain', Water, Air, and Soil Pollution, vol. 66, pp. 111-9, DOI:10.1007/BF00477063.
Ashraf, S., Rizvi, N.B., Rasool, A., Mahmud, T., Huang, G.G. & Zulfajri, M. 2020, 'Evaluation of heavy metal ions in the groundwater samples from selected automobile workshop areas in Northern Pakistan', Groundwater for Sustainable Development, vol. 11, 100428, DOI:10.1016/j.gsd.2020.100428.
Belhadj, H., Aubert, D. & Youcef, N.D. 2017, 'Geochemistry of major and trace elements in sediments of Ghazaouet Bay (western Algeria): an assessment of metal pollution', Comptes Rendus Geoscience, vol. 349, no. 8, pp. 412-21, DOI:10.1016/j.crte.2017.09.013.
CONAMA − Conselho Nacional do Meio Ambiente 2005, Resolução CONAMA nº 357, de 17 de março de 2005, viewed 20 February 2021, <CONAMA − Conselho Nacional do Meio Ambiente 2005, Resolução CONAMA nº 357, de 17 de março de 2005, viewed 20 February 2021, http://www2.mma.gov.br/port/conama/legiabre.cfm?codlegi=459>.
CONAMA − Conselho Nacional do Meio Ambiente 2012, Resolução CONAMA nº 454, de 01 de novembro de 2012, viewed 20 February 2021, <CONAMA − Conselho Nacional do Meio Ambiente 2012, Resolução CONAMA nº 454, de 01 de novembro de 2012, viewed 20 February 2021, http://www2.mma.gov.br/port/conama/legiabre.cfm?codlegi=693>.
Cotta, J.A.O., Rezende, M.O.O. & Piovani, M.R. 2006, 'Avaliação do teor de metais em sedimento do Rio Betari no parque estadual turístico do Alto Ribeira - PETAR, São Paulo, Brasil', Quimica Nova, vol. 29, no. 1, pp. 40-5, DOI:10.1590/S0100-40422006000100009.
dos Santos, J.S., dos Santos, M.J.S. & dos Santos, M.L.P. 2009, 'Parâmetros Indicativos do Processo de Salinização em Rios Urbanos do Semi - árido Brasileiro', Química Nova, vol. 32, no. 6, pp. 1534-8, DOI:10.1590/s0100-40422009000600033.
EMBRAPA − Empresa Brasileira de Pesquisa Agropecuária 1997, Manual de métodos de análise de solo, Centro Nacional de Pesquisa de Solos, Rio de Janeiro.
Esteves, F.A. 2011, Fundamentos da limnologia, 2nd edn, Interciência, Rio de Janeiro.
Frohlich, M.F. & Naspolini, B.F.J.I.V. 2015, 'A evolução do processo de avaliação e gerenciamento de material relacionado às atividades de dragagem no Brasil: uma análise comparativa entre as Resoluções CONAMA n° 344/04 e n° 454/12', Engenharia Sanitária e Ambiental, vol. 20, no. 1, pp. 131-40, DOI:10.1590/S1413-41522015020000123410.
Ganugapenta, S., Nadimikeri, J., Chinnapolla, S.R.R.B., Ballari, L., Madiga, R., Nirmal, K. & Tella, L.P. 2018, 'Assessment of heavy metal pollution from the sediment of Tupilipalem Coast, southeast coast of India', International Journal of Sediment Research, vol. 33, no. 3, pp. 294-302, DOI:10.1016/j.ijsrc.2018.02.004.
Katana, C., Jane, M. & Harun, M. 2013, 'Speciation of zinc and copper in open-air automobile mechanic workshop soils in Ngara area-Nairobi Kenya', Resources and Environment, vol. 3, pp. 145-54, DOI:10.5923/j.re.20130305.06.
Kiehl, E.J. 1985, Fertilizantes orgânicos, Ceres, São Paulo.
Lee, P.K., Touray, J.C., Baillif, P. & Ildefonse, J.P. 1997, 'Heavy metal contamination of settling particles in a retention pond along the A-71 motorway in Sologne, France', Science Total Environmental, vol. 201, no. 1, pp. 1-15, DOI:10.1016/S0048-9697(97)84048-X.
Ma, J., Liu, Y., Yu, G., Li, H., Yu, S., Jiang, Y., Li, G. & Lin, J. 2016, 'Temporal dynamics of urbanization - driven environmental changes explored by metal contamination in surface sediments in a restoring urban wetland park', Journal of Hazardous Materials, vol. 309, pp. 228-35, DOI:10.1016/j.jhazmat.2016.02.017.
Melo, V.F., Andrade, M., Batista, A.H., Favaretto, N., Grassi, M.T. & de Campos, M.S. 2012, 'Chumbo e zinco em águas e sedimentos de área de mineração e metalurgia de metais', Química Nova, vol. 35, no. 1, pp. 22-9, DOI:10.1590/S0100-40422012000100005.
Moraes, G.M., Mortatti, J. & Lopes, R.A. 2011, 'Utilização de diferentes critérios para avaliação do potencial de biodisponibilidade de metais pesados em sedimentos do alto Tietê (São Paulo)', Revista Brasileira de Geociências, vol. 41, no. 3, pp. 463-71.
Muller, G. 1969, 'Index of geoaccumulation in the sediments of the Rhine River', GeoJournal, vol. 2, pp. 108-18.
Nascimento, B.L.M., Gomes, D.R.C.S., Costa, G.P., Araújo, S.S., Santos, L.C.A. & Oliveira, J.D. 2015, 'Comportamento e avaliação de metais potencialmente tóxicos (Cu (II), Cr (III), Pb(II) e Fe(III)) em águas superficiais dos Riachos Capivara e Bacuri Imperatriz-MA, Brasil', Engenharia Sanitária e Ambiental, vol. 20, no. 3, pp. 369-78, DOI:10.1590/S1413-41522015020000113620.
Nduka, J.K., Kelle, H.I. & Amuka, J.O. 2019, 'Health risk assessment of cadmium, chromium and nickel from car paint dust from used automobiles at auto-panel workshops in Nigeria', Toxicol Reports, vol. 6, pp. 449-56, DOI:10.1016/j.toxrep.2019.05.007.
Parks, J.L., Mcneill, L., Frey, M., Eaton, A.D., Haghani, A., Ramirez, L. & Edwards, M. 2004, 'Determination of total chromium in environmental water samples', Water Research, vol. 38, no. 12, pp. 2827-38, DOI:10.1016/j.watres.2004.04.024.
Pellerano, R.G., Uñates, M.A., Cantarelli, M.A., Camiña, J.M. & Marchevsk, E.J. 2012, 'Analysis of trace elements in multifloral Argentine honeys and their classification according to provenance', Food Chemistry, vol. 134, no. 1, pp. 578-82, DOI:10.1016/j.foodchem.2012.02.125.
Qadeer, A., Saqib, Z.A., Ajmal, Z., Xing, C., Khhalil, S.K., Usman, M., Huang, Y., Bashir, S., Ahmad, Z., Ahmed, S., Thebo, K.H. & Liu, M. 2019, 'Concentrations, pollution indices and health risk assessment of heavy metals in road dust from two urbanized cities of Pakistan: Comparing two sampling methods for heavy metals concentration', Sustainable Cities and Society, vol. 53, 101959, DOI:10.1016/j.scs.2019.101959.
Reis, C.F., Pegoraro, T., Coelho, S.R.M., Lucas, S.D.M., Limberger, C. & Watthier, E. 2011, 'Avaliação de quatro tipos de aberturas de amostras na determinação de cromo, cobre, zinco em águas residuárias', Engenharia Ambiental, vol. 8, pp. 17-25.
Ribeirinho, V.S. 2015, 'Metais pesados e matéria orgânica do solo oito anos após a última aplicação de lodo de esgoto', PhD Thesis, Instituto Agrônomico de Campinas.
Silva, M.O.S.A. 1997, Análises físico-químicas para controle das estações de tratamento de esgotos, CETESB, São Paulo.
Soliman, N.F. & Nasr, S.M. 2015, 'Assessment of metals contamin55ation in sediments from the Mediterranean Sea (Libya) using pollution indices and multivariate statistical techniques', Global Journal of Advance Research on Classical and Modern Geometries, vol. 2, pp. 120-36.
Tukura, B.W., Kagbu, J.A. & Gimba, C.E. 2007, 'Effects of pH and total organic carbon (TOC) on the distribution of trace metals in kubanni dam sediments, Zaria, Nigeria', The Scientific World Journal, vol. 2, no. 3, pp. 25-31, DOI:10.4314/swj.v2i3.51743.
USEPA − United States Environmental Protection Agency 1996, 'Screening values for chemicals evaluated', in USEPA, The national sediment quality survey: a report to congress on the extent and severity of sediment contamination in surface water of the United State, United States Environmental Protection Agency, Washington, DC, pp. 225-43, viewed 20 July 2022, < 225-43, viewed 20 July 2022, https://nepis.epa.gov/Exe/ZyPDF.cgi/9101MYNO.PDF?Dockey=9101MYNO.PDF>.
Vazquez-Arias, A., Martín-Peinado, F.J. & Parviainen, A. 2023, 'Effect of parent material and atmospheric deposition on the potential pollution of urban soils close to mining areas', Journal of Geochemical Exploration, vol. 244, 107131, DOI: 10.1016/j.gexplo.2022.107131.
Vithanage, M., Bandara, P.C., Novo, L.A.B., Kumar, A., Ambade, B., Naveendrakumarf, G., Ranagalage, M. & Magana-Arachchi, D.N. 2022, 'Deposition of trace metals associated with atmospheric particulate matter: Environmental fate and health risk assessment', Chemosphere, vol. 303, no. 3, 135051, DOI:10.1016/j.chemosphere.2022.135051.
Funding information
Data availability statement
Author notes
E-mail: jee.almeida@yahoo.com.brE-mail: spquinaia@unicentro.brE-mail: chaldernunes@gmail.comE-mail: alinebortolanza13@gmail.comE-mail: izabelly.palinski@gmail.com
Conflict of interest declaration