Article
Analysis of the Dynamics of Vegetation Cover and Land Use in Forest Management Unit 00-004 and its Surroundings on the Coast of Cameroon
Análise da Dinâmica do Cobertura Vegetal e do Uso dos Solos na Unidade de Gestão Florestal 00-004 e seus Arredores na Costa dos Camarões
 Lacatuce Kenne Tene lacatuskenne@gmail.com
Marie Caroline Momo Solefack mcarofr@yahoo.fr
Delanot Armand Tanougong armand_tanougong@yahoo.com
Alex Bruno Dong Etchike etchikealex@yahoo.fr
Serge Rodrigue Monthe casanovaserge@yahoo.fr
Arnaud Tchokomeni a.tchokomeni@sefeccam.com
Lacatuce Kenne Tene lacatuskenne@gmail.com
Marie Caroline Momo Solefack mcarofr@yahoo.fr
Delanot Armand Tanougong armand_tanougong@yahoo.com
Alex Bruno Dong Etchike etchikealex@yahoo.fr
Serge Rodrigue Monthe casanovaserge@yahoo.fr
Arnaud Tchokomeni a.tchokomeni@sefeccam.com
Analysis of the Dynamics of Vegetation Cover and Land Use in Forest Management Unit 00-004 and its Surroundings on the Coast of Cameroon
Anuário do Instituto de Geociências, vol. 46, 56870, 2023
Universidade Federal do Rio de Janeiro
Received: 09 February 2023
Accepted: 28 August 2023
Abstract: In Cameroon, the government gives serious attention to protect Forest Management Units (FMU). Unfortunately, vegetation cover of FMU 00-004 decreases in the area as years ago due to anthropogenic pressures. The present study aimed to analyse the dynamics of the vegetation cover and land use of the FMU 00-004 and its surroundings in Cameroon, in the period between 1988-2020. Landsat images (1988, 2001 and 2020) and field investigations were used and processed by ENVI 5.3 software. 175 people around the forest were interviewed to obtain their perceptions on the causes of forest landscape degradation. In 1988, the FMU 00-004 and its surroundings consisted of seven types of land cover, the most important being dense forest, open forest and woody savannah. Cropland, building area, water area and eroded soil were less than 2%. In 2020, building area and croplands surface areas increased while dense and open forests cover decreased. Change in vegetation was more pronounced between 1988 and 2020 and the deforestation rate was 2.55%. The degradation main causes were settlements of the forest exploitation companies and agricultural practices. For sustainable production systems, landscape planning should be put in place by logging company to reduce Land use / Land cover challenges.
Keywords: Landscape, Satellite images, Deforestation.
Resumo: Em Camarões, o governo dedica muita atenção à proteção da Unidade de Manejo Florestal (UMF). Infelizmente, a cobertura vegetal da UMF 00-004 diminui na área com o passar dos anos devido às pressões antrópicas. O presente estudo teve como objetivo analisar a dinâmica do uso da cobertura vegetal da UMF 00-004 e seu entorno em Camarões, no período 1988-2020. Imagens Landsat (1988, 2001 e 2020) e investigações de campo foram utilizadas e processadas pelo software ENVI 5.3. Foram entrevistados 175 pessoas do entorno da floresta para obter suas percepções sobre as causas da degradação da paisagem florestal. Em 1988, a UMF 00-004 e seu entorno apresentavam sete tipos de cobertura do solo, sendo os mais importantes a mata fechada, a mata aberta e o cerrado lenhoso. A terra cultivada, a área de construções, a área de água e o solo erodido foram inferiores a 2%. Em 2020, as construções e as terras de cultivo aumentaram em área, enquanto a cobertura de florestas densas e abertas reduziram consideravelmente. A mudança na vegetação foi mais pronunciada entre 1988 e 2020 e a taxa de desmatamento foi de 2,55%. As principais causas dessa degradação foram assentamentos de empresas de exploração florestal e práticas agrícolas. Para sistemas de produção sustentáveis, o planejamento da paisagem deve ser implementado pela empresa madeireira para reduzir os desafios de uso/cobertura da terra.
Palavras-chave: Paisagem, Imagens de satélite, Desmatamento.
1 Introduction
Forests harbour most of Earth’s terrestrial biodiversity. The Congo Basin contains about 70% of Africa’s forest cover (Megevand et al. 2013). Of the 200 million ha of dense moist forest in Central Africa (Vancutsem et al. 2021), nearly 54 million ha (27%) are classified as production forests of various types, mainly in the form of forestry concessions (Eba’a Atyi et al. 2022). For many forest owners and managers, wood products are by far the most important source of income and employment in forestry and thus are playing a major role in rural recovery and development (FAO 2022). Industrial logging represents an extensive land use in the area, with about 44 million ha of forest under concession (8.3% of the total land area) (Megevand et al. 2013). Forests are dynamic reservoirs of forest resources, carbon and biodiversity. About 60% of all vascular plants occur in tropical forests (Burley 2002). Biodiversity is indispensable for food security, sustainable development and the supply of ecosystem services (FAO 2019).
Analysis of changes shows a considerable increase in the annual disturbance rate in the tropical moist forests of Central Africa over a five-year period (2015-2020). Biodiversity continues to decline and the main drivers of deforestation in Central Africa remain the increase in cultivated areas, demographic growth and infrastructure development (Eba’a Atyi et al. 2022). In the Congo basin, the deforestation rate increased by 0.09% between 1990-2000 and by 0.17% between 2000-2005 (Bozongo 2018; De Wasseige et al. 2012; Ndobe & Mantzel 2014). In Cameroon, this deforestation rate was 0.14% and the degradation rate at 0.01% for the period between 1990-2000 (Ndobe & Mantzel 2014). The main cause of these factors is usually the intensification of anthropogenic activities creating forest fragments like wood cutting, agriculture and search for firewood (Nangndi et al. 2021). These forest fragments will transform the vegetation landscape into other forms of land use (Nasi & Forni 2006; Zoungrana et al. 2018). This variation is also followed with a loss of biological diversity (Akodéwou et al. 2020).
Cameroonian forests are divided into two domains (art. 20, Republic of Cameroon 1994): the permanent forest domain (land permanently allocated to forests and/or wildlife habitats), and the non-permanent forest domain (forested lands that can potentially be allocated to other land uses). The permanent forest domain includes: protected areas, Forest Management Units (FMUs), communal forests, forest reserves and in the non-permanent forest domain we have community forests and private forests (Cerutti, Nasi & Tacconi 2008).
Remote-sensing-based monitoring techniques are more effective for forest management and to formulate land-use policies (Wu, De Pauw & Zucca 2013). Analysis of forest formation dynamics can also be part to reduce global climate change (Mamane et al. 2018). Today, the use of remote sensing and geo-spatial data for land cover mapping have proven to be essential technologies for determining land cover at different scales (Akodéwou et al. 2020; Kouassi et al. 2021; Zoungrana et al. 2018). Satellite imagery is used to characterize and manage ecosystems. Many studies adopting remote sensing and GIS approaches for the analysis of ecosystem dynamics have been carried out in the Cameroonian vegetation (Momo et al. 2012; Tanougong & Tchamba 2022; Temgoua et al. 2018; Tsewoue et al. 2020).
The Forest Management Unit 00-004 was attributed in the year 2013 and is managed on a 30 years rotation period (art. 20, République du Cameroun 1994). Specific and current works on its landscape dynamics after logging is lacking. The present study seeks to fill this gap. The main goal of this paper is to analyse dynamics of land use and land cover changes over the temporal extent of 32 years (1988-2021) of FMU 00-004 and its surroundings.
2 Materials and Method
2.1 Study Site Location
This study was carried out in the Forest Management Unit 00-004 (FMU 00-004) and its surroundings. It is a forest concession with a surface area of 94917 ha belonging to five sub-divisions, namely Makenene (9853 ha), Ndikinimeki (56069 ha), Nkondjock (1 656 ha), Nord Makombe (4 180 ha) and Yingui (23159 ha). It is located on one of the slopes of the South West and West regions towards the sea. This forest is located between latitudes 4°53'48'' and 4°28'33'' North and longitudes 10°15'33'' and 10°45'37'' East (Figure 1).
The relief of this concession varies throughout its entire area. It includes hills, flatlands, plateaus and valleys. It is generally marked by steep slopes at the level of the rivers. It belongs to the transition zone between the equatorial forests and the tropical forests. The climate is wet tropical type characterized by two seasons including long dry season and short rainy season. Temperatures vary from 25 ˚C to 28 ˚C. Annual rainfall varies from 1800 mm to 2000 mm (MINFOF 2011). The soils of the zone are mainly ferralitic, and tropical ferruginous. The vegetation of FMU 00-004 is a dense humid forest of ombrophilous type at low and medium altitude. The flora consists of precious species such as Azobe (Lophira alata), Ilomba (Pycnanthus angolensis), Frake (Terminalia superba), Bilinga (Nauclea diderrichii), Padouk (Pterocarpus soyauxii), Iroko (Milicia excelsa). The families specific to this area are the Annonaceae, Olacaceae, Ebenaceae and Euphorbiaceae (PNDP 2012).
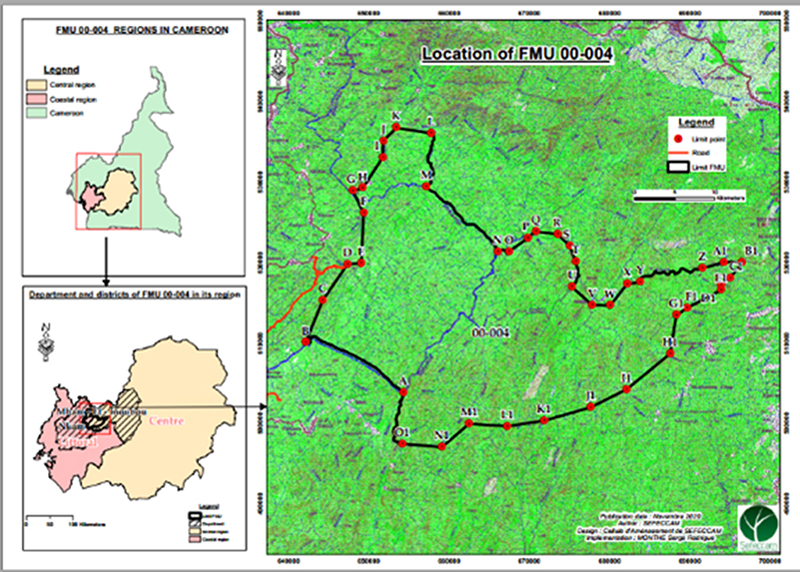
Figure 1
Location of FMU 00-004 in the Coastal and Centre Regions of Cameroon.
2.2 Image Acquisition
Three types of images were used in this study, namely Landsat 5 Thematic Mapper sensor - TM of 1988; Landsat 7 Enhanced Thematic Mapper Plus sensor - ETM+ of 2001 and Landsat 8 Operational Land Imager - OLI sensor and Thermal Infrared Sensor - TIRS of 2020. To select satellite images, two factors were considered. Firstly, these images were acquired at the same time of year (during the dry season) to reduce problems related to differences in solar angles, ecological change in vegetation, and difference in soil moisture (Table 1) and secondly images with less than 10% cloud filtering, were chosen and loaded from Landsat archive via Earth Explorer (https://www.seequent.com/blog/).
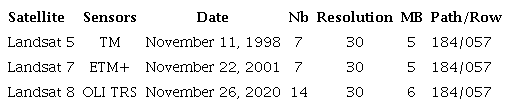
Nb: Number of bands; MB: Multispectral band
2.3 Image Pre-Processing
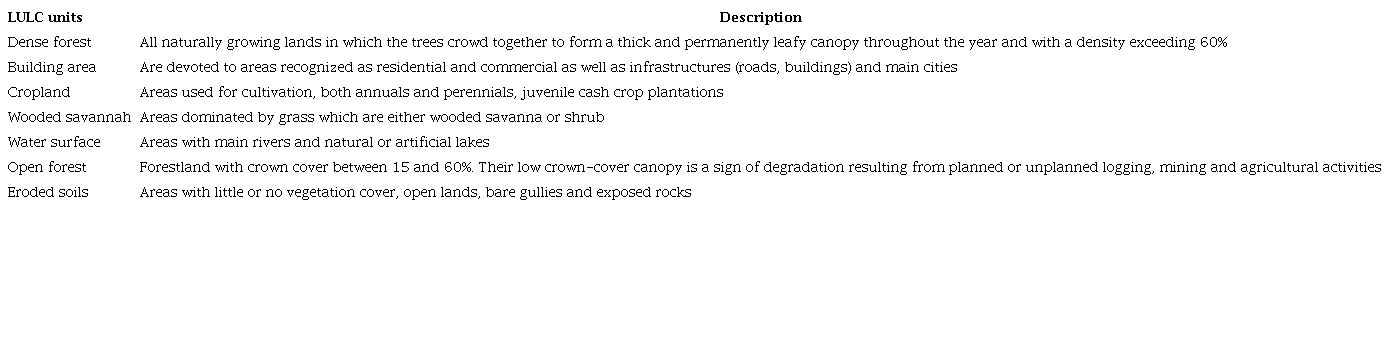
The pre-processing consisted of enhancing the three Landsat images (1988, 2001 and 2020) to facilitate their exploitation. To do this, the bands were unzipped and assembled. The scenes obtained were subjected to geometric, atmospheric, and radiometric corrections in order to enhance the quality of the images and make the spatial features present on the images close to the real world (Caloz & Collet 2001; Nangndi et al. 2021). The area of interest was extracted from the limits of the study area. Therefore, the false colour composition with the combination of bands 2, 3 and 4 for the TM and ETM+ image and 3, 4 and 5 for the Landsat 8 OLI-TIR image were used to obtain a better view of the image objects (Sarr 2009). These different images were processed using ENVI 5.3 software to extract desired information. Extraction of the study zone was made using a geo-rectified vector map (UTM 34, WGS 84). The spatial resolution of these images was 30 m. The identified independent LULC classes through colour composite and signature check and their description are presented in Table 2.
2.4 Image Classification
Supervised classification (based on the Land Cover Classification System model - LCCS (Hussain et al. 2013; Nangndi et al. 2021; Tsewoue et al. 2020)) was adopted with the maximum likelihood algorithm, which was used for images from 1988, 2001 and 2020 based on the composition chosen for this purpose.
The choice of this algorithm is explained by its widespread use in remote sensing because it is mathematically very satisfactory as the pixels are classified according to a probabilistic method. For each pixel in the image, the probability of being attached to each class is calculated.
The calculation of the probability function of a pixel to a class is based on the mean of the training area, the pixel's linearity, and the standard error margin of the covariance matrix of the pixels in the training area. The pixel is then classified, into the class with the highest probability. Furthermore, this algorithm assumes that the statistics of the training site of each class follow a Gaussian distribution (Duminili 2007).
After the classification, a verification step is required before confirmation. The validation of this classification was done in three steps. The first validation was based on the comparison between the colourful image and the classified image. The second on the confusion matrix, based on the exclusive distribution of pixels to the one based on ground truth points (Chalifoux et al. 2006), to better appreciate the reliability of the maps produced, especially those of the 2020 maps.
Finally the last one based on the data collected in the field and the view points of the people. For each land use identified, the surface areas of each period were calculated in ArcGis 10.8 software (Esri 2020). Figure 2 shows the different phases of image processing.
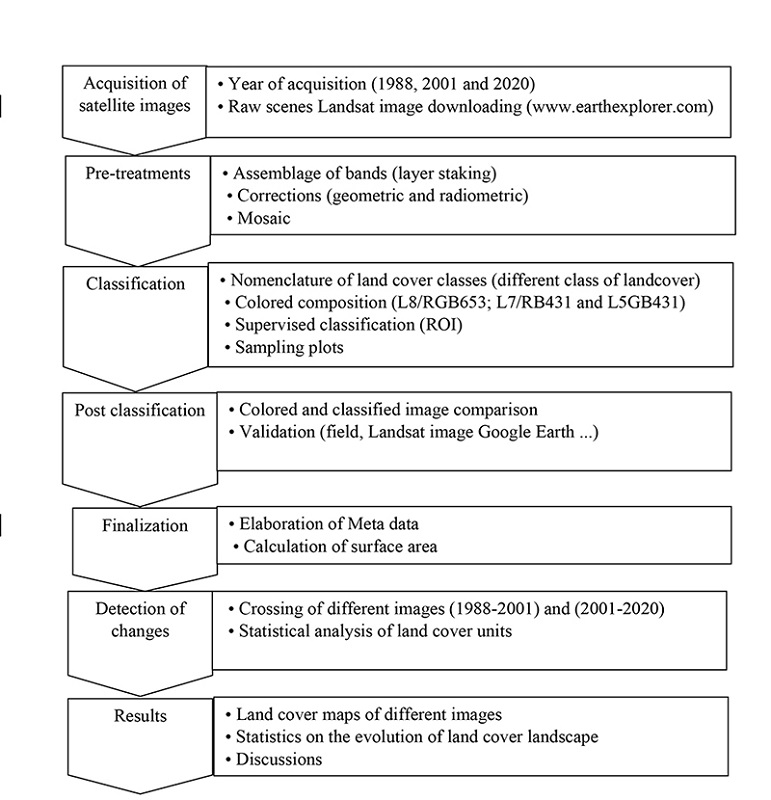
Figure 2
Flowchart showing the different stages of processing satellite images to obtain land cover maps.
2.5 Change Detection
To characterize the dynamics of land use and the transitions between the different thematic classes from one year to another (1988-2001; 2001-2020 and 1988-2020), a quantitative analysis was carried out. It allowed us to show the different forms of conversion undergone by the land use units and described the changes that have occurred. These changes provided a measure of the growth of macroeconomic aggregates between two periods (Noyola, Mering & Rojas 2009). It allowed us to determine the annual rate of change of each land use category in terms of expansion and regression between two periods. Mathematically, the annual rate of change formula refers to FAO (1996) and used by Mamane et al. (2018) and Tsewoue et al. (2020). The formula is demonstrated in Equation 1.
Where, S1 and S2: are surface areas of the landscape unit at dates t1 and t2 respectively; t2 - t1: Number of years of change; ln: Neperian logarithm; e: Base of the neperian logarithm (e = 2.71828). The study used a combination of approaches and techniques, including GIS-based processing and descriptive statistics analysis for data analysis. LULC analysis was carried out using QGIS.
2.6 Population Perceptions
This research focused on the perception of different agents of deforestation and land degradation in FMU 00-004 and its surrounding. Surveys mainly involved household heads and 175 persons were interviewed. These surveys were conducted in four villages: Ndocktiba, Bindjen, Tam and Nerviens. The ethnic groups encountered in these villages are of Eton, Bamenda, Banen, Baden and Bamileke.
These villages were selected because of their proximity in FMU 00-004. Household interviews were conducted using semi-structured questionnaires designed and consisting of both open and closed-ended questions. The Key items of the questionnaire included age, gender, level of education, the time period spent in the village, activities carried out in the forest, causes and local perceptions of forest degradation. The interviews were supplemented by participatory observations. The processing of survey data was based on the calculation of relative frequency of citation (RFC) using Excel 2013. It was expressed by the Equation 2 used by Temgoua et al. (2018).
3 Results and Discussions
3.1 Land Use/Land Cover Status Between 1988 and 2020
In this study, three maps were produced showing the land use types of the land cover of FMU and its surrounding during the last 32-year from 1988 to 2020.
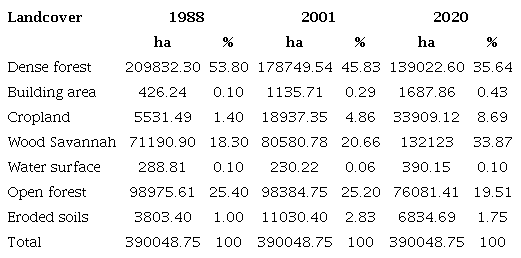
In 1988, the ecological landscape of FMU 00-004 and its surrounding was mainly constituted of dense and open forests (Figure 3). Dense forests were the most represented with a total surface area and followed by open forests. During this period, building area, water surface, cropland and eroded soils were poorly represented (Table 3).
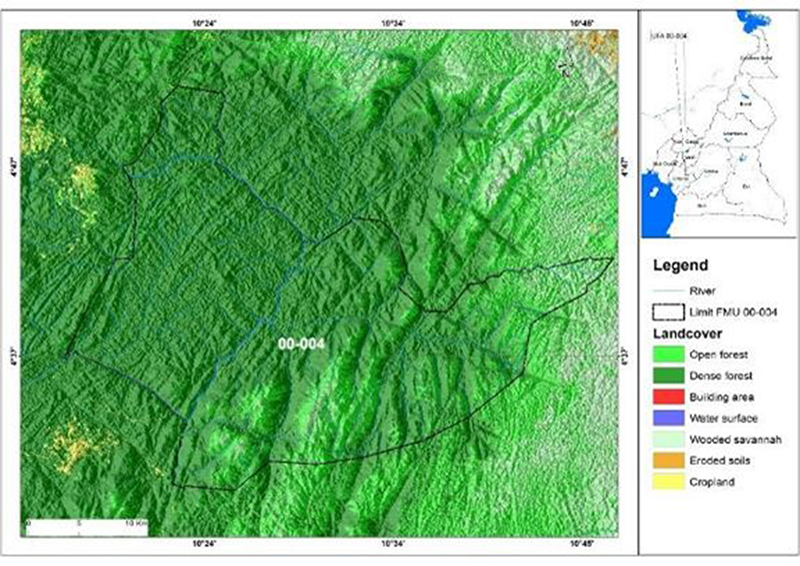
Figure 3
Land use of FMU 00-004 and its surroundings in 1988.
In 2001, the forest landscape of FMU 00-004 and its surroundings remained forested but with a decrease in the area of dense forest. Open forest remained relatively stable during this period. Subsequently, building surface, cropland areas, and eroded soils are still poorly represented, although they have increased in FMU 00-004 and its surroundings (Table 3). Finally, the water surface decreased from 288.8 ha in 1988 to 230.22 ha in 2001 (Figure 4).
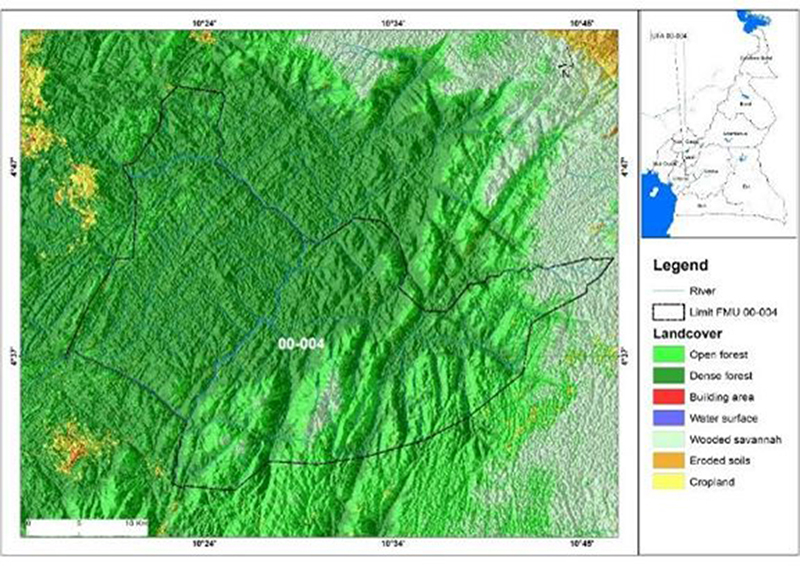
Figure 4
Land use of FMU 00-004 and its surroundings in 2001.
In 2020, the ecological landscape of FMU 00-004 and its surroundings has changed considerably (Figure 5). Dense forests and open forests have decreased in area while wooded savannahs, Building area, cropland areas, and eroded soils have increased in surface area (Table 3). Lack of control in FMU 00-004 and its surroundings allowed population to practice various illegal activities that affected forest cover. These results are similar to those found by Avakoudjio et al. (2014) in and around the periphery of the Benin part of Regional Park of W where the open forest disappeared over the years.
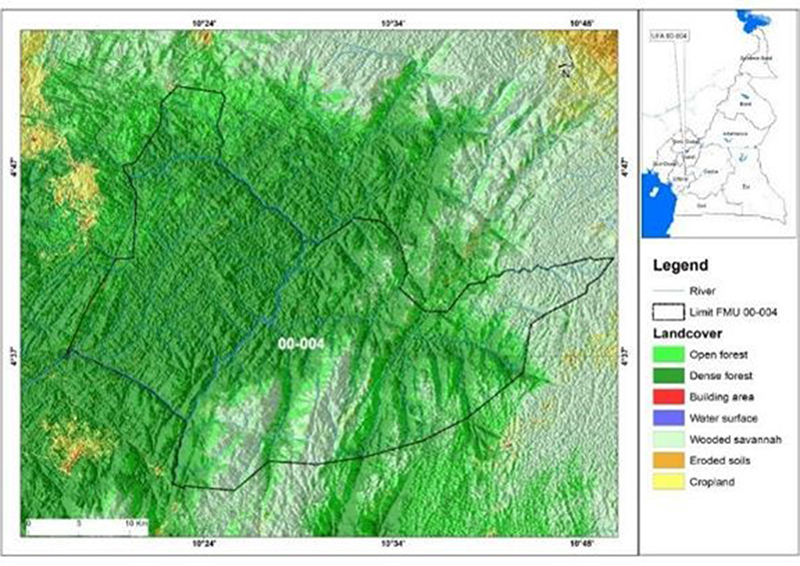
Figure 5
Land use of FMU 00-004 and its surroundings in 2020.
During the last decades, the study area is mostly forested, since forest concession with industrial logging represents an extensive land use and contributes significantly to revenues and employment. Unlike other tropical regions, logging as in the Congo Basin is highly selective and extensive and production forests remain permanently forested (Megevand et al. 2013).
3.2 Land Use Changes
3.2.1 Transition Matrix
Between 1988 and 2001, the most important land use category in terms of changes is cultivated land, which shows a huge increase at a relatively high rate, accounting for almost 4.86% of land consumption. This increase is at the expense of forest land. On the other hand, the most persistent classes are open forests and water surfaces.
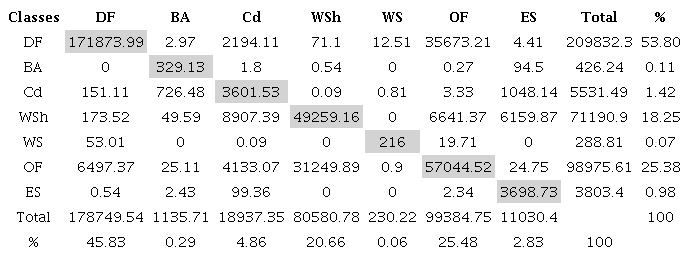
DF=Dense Forest, BA= Building area, Cd=Cropland, WSh= Wood Savannah, WS= Water surface, OF=Open Forest, ES= Eroded soils
The statistics in Table 5, derived from the cross-referencing of land use maps between 2001 and 2020, show that two categories have persisted overall, namely water areas and settlements areas, which have undergone some minor changes. Crop areas and wooded savannahs showed important gains in surface area over the whole study area. Forests are the main contributors. In general, the area under cultivation is increasing at a relatively high rate, accounting for almost 8.69% of land consumption, at the expense of forest land.
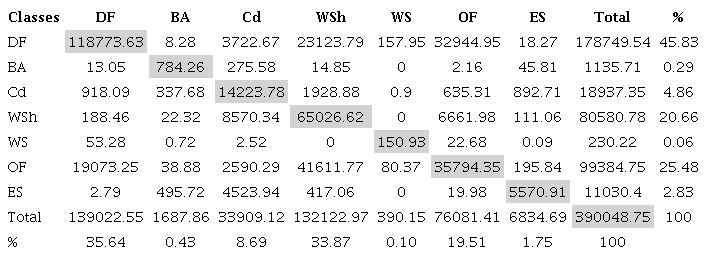
DF=Dense Forest, BA= Building area, Cd=Cropland, WSh= Wood Savannah, WS= Water surface, OF=Open Forest, ES= Eroded soils
Tables 4 and 5 show that the evolution of anthropogenic formations has been more important in the area over the last thirty-two years (1988-2020), where settlements, cropland and eroded soils have increased in area. The conversions of natural vegetation to anthropogenic formation and non-vegetated area were also observed by Houessou et al. (2013) in Benin Republic and Nyamekye et al. (2018) in Burkina Faso. The extension rate was 2.55 % during the period.
This evolution of anthropogenic formations is more pronounced in the North East and North West sides of FMU 00-004. The magnitude of this increase could be explained by the anarchic creation of pioneer villages in 1966 and 1981 in the periphery of FMU 00-004. The work of Tene (2016) confirms that the creation of pioneer villages further increases the phenomenon of migration to FMU 00-004. The work of Harouna (2005) supports the fact that the increase of anthropogenic formations is linked to the migration of populations to those areas, searching for available resources.
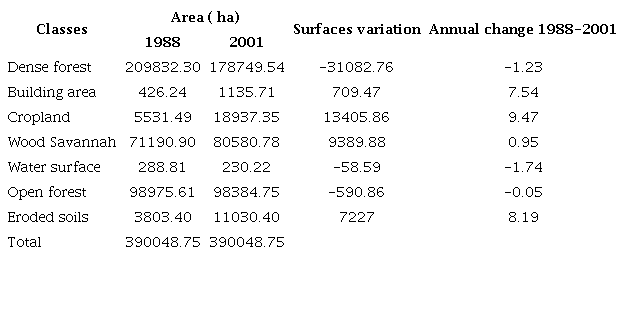
3.2.2 Annual Rate of Change
The evolution of the different land use categories between 1988 and 2001 is presented in the Table 6. The land use class that has increased most is cropland, with an annual rate of change of 9.47%. The building areas also show an important increase, with an annual rate of change of 7.54%. There was also a salient increase in eroded soils with an annual rate of 8.19%. Dense forests, however, have noticeably declined, with an annual rate of change of 1.23%. Open forests are more or less stable with an annual rate of change of 0.05%.
During the period between 2001 and 2020, crops and wooded savannahs cover increased noticeably (Table 7). Dense forests, however, show a foremost decline in area. The same trend is observed with open forests and eroded soils.
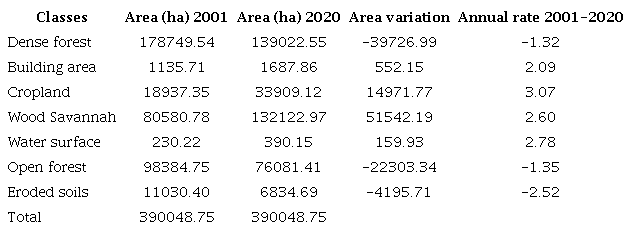
As concern the dense forest class, analyses of deforestation rates for the considered time periods of 1988-2001 and 2001-2020 show deforestation rates of 1.23% per year and 1.32% per year respectively. This high rate of deforestation, mostly observed for the second period, reveals that the forest management unit is under increasing pressure over time. This is due to the fact that this period was marked by significant population growth (Bidou et al. 2013) and extensive agriculture without the use of soil fertilisers. The rate of deforestation observed in our study area is higher than that reported by De Wasseige et al. (2012) (0.10%) for the period of 1990-2000 in Cameroon. Since industrial logging has become one of the most extensive use of land in Central Africa (Megevand et al. 2013), illegal logging caused damage in the vegetation which favours the reduction of natural vegetation. Many studies have shown that the loss of landscape is linked to anthropogenic activity (Madjigoto et al. 2015; Momo et al. 2018; Temgoua et al. 2021).
3.3 Causes of Forest Degradation in FMU 00-004 and its Surrounding
According to interviews with local populations and field observations, deforestation around FMU 00-004 is historically linked to agriculture and in particular to the expansion of agricultural land through the slash-and-burn technique, as observed in the Congo basin countries (Tchatchou et al. 2015). This technique takes advantage of the fertility of the soil acquired through humus, as slash-and-burn mineralises the organic matter and makes it quickly available for crops. However, after the trees have been felled, the fertility is only maintained for a short period of time, which makes it necessary to clear new plots, hence the itinerant nature of this practice. According to Binkley et al. (1992), annual burning application harmed the soil, due to the loss of nutrients resulting from volatilization, which is when the temperature reaches high degrees on the soil surface.
Agricultural activities as shown by increasing of cropland area in satellite images are also implicated in the reduction of natural formations (Madjigoto et al. 2015; Temgoua et al. 2021). We will therefore look at the link between agriculture and deforestation in this section, focusing particularly on the types of crops grown. Indeed, due to the constant high price of cocoa and other cash crops, farmers migrate into the region to grow cash crops, mainly cocoa, which substantially threatens biodiversity (Kone 2013). In addition, the interviewees also highlighted the more recent impact of logging (57.16%), which is currently a major loss of biomass. Although it is not a major cause of deforestation, it leads to a significant degradation of the forest cover, weakening its functioning and the ecosystem services it can provide by removing indigenous and even endemic species that structure forest environments.
Thus, the establishment of logging company in the study area (Figure 6) promotes population growth and subsequently leads to the loss of biodiversity and disappearance of ecological services even such as carbon sequestration (Brun et al. 2018; Djohy et al. 2016). In addition, it can make the forest cover more vulnerable to fire or extreme weather events.
According to respondents, other causes of the loss or degradation of forest cover include bush fires, low rainfall and population increase, which nevertheless have a low impact on the forest landscape. The causes of the loss of landscape could also be of climatic origin. The study area is characterized by a long dry season, which prevents an efficient recovery of vegetation. Usually, logging is more intense during the dry season leading to reduce the natural formations. Temgoua et al. (2018) and Gansaonré, Zoungrana and Yanogo (2020) have indicated that climatic variations influence the dynamics of a vegetation formation while causing modifications on the naturals resources.
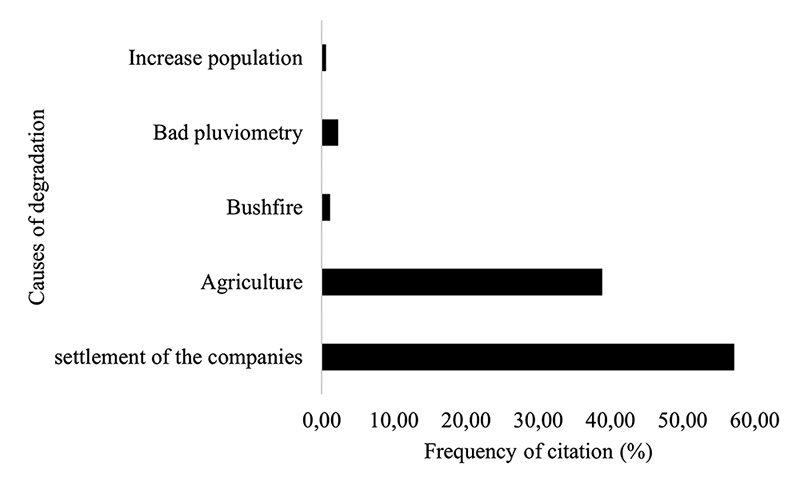
Figure 6
Perception of degradation’s causes of the forest landscape in FMU 00-004.
4 Conclusion
The trend of the change observed in FMU 00-004 and its surroundings over three decades was a conversion of the natural dense forest into sparse vegetation and croplands. The rate of deforestation is higher than that reported in Cameroon. The increase in human settlements area around the FMU 00-004 indicates that most of the agricultural land was used for developmental activities, so agriculture is the primary driver of deforestation. Deforestation was very intense between 1988 and 2020, due to establishment of logging company after the year 2000. The study shows that the forested areas are more prone to transformation and the increasing human pressure on forest makes it highly vulnerable to deforestation activities. The knowledge of these dynamics enables us to predict the future and to supply the competent authorities with tools to assist in the development and sustainable management of forests.
5 Acknowledgments
The authors wish to thank the managers of SEFECCAM/SIENCAM for facilitating the fieldwork.
6 References
Akodéwou, A., Oszwald, J., Saïdi, S., Akpavi, L.G.S., Akpagana, K. & Gond, V. 2020, 'Land use and land cover dynamics analysis of the togodo protected area and its surroundings in southeastern Togo, West Africa', Sustainability, vol. 12, no. 13, 5439, DOI:10.3390/su12135439.
Avakoudjio, J., Mama, A., Toko, I., Kindomihou, V. & Sinsi, B. 2014, 'Dynamique de l’occupation du sol dans le Parc National du W et sa périphérique au Nord-Ouest du Benin', International Journal of Biological and Chemical Sciences, vol. 8, no. 6, pp. 2608-25, DOI:10.4314/ijbcs.v8i6.22.
Bidou, E.J., Palibrk, M., Andrieu, J. & Mering, C. 2013, 'Vulnérabilité, dynamique de population et occupation des sols: Réflexion sur les indicateurs de vulnérabilité au Bénin et au Niger', Actes des congrès nationaux des sociétés historiques et scientifiques, no. 6.4, pp. 41-56.
Binkley, D., Richter, D., David, M.B. & Caldwell, B. 1992, 'Soil chemistry in a loblolly/longleaf pine forest with interval burning', Ecological Applications, vol. 2, no 2, pp. 157-64, DOI:10.2307/1941772.
Bozongo, J. 2018, 'Les déterminants de la déforestation: Cas du Bassin du Congo', Annales de l’Université Marien N’gouabi, vol. 18, no. 2, pp. 45-56.
Brun, L.E., Gaudence, D.J., Gibigaye, M. & Tente, B. 2018, 'Dynamique de l’occupation du sol dans les zones humides de la commune d’Allada, au Sud-Benin (Sites Ramsar 1017 et 1018)', European Scientific Journal Edition, vol. 14, no. 12, pp. 59-77, DOI:10.19044/esj.2018.v14n12p59.
Burley, J. 2002, 'Forest biological diversity: An overview', Unasylva, vol. 209, no. 53, pp. 3-9.
Caloz, R. & Collet, C. 2001, Précis de télédétection. Volume 3: Traitements numériques d’images de télédétection (Universités francophones), Presses Polytechniques du Québec, Québec, Canada.
Cerutti, P. O., Nasi, R. & Tacconi, L. 2008, 'Sustainable forest management in Cameroon needs more than approved forest management plans', Ecology and Society, vol. 13, no. 2, 36.
Chalifoux, S., Miroslav, N., Charles, L., Rasim, L. & Richard, F. 2006, 'Cartographie de l’occupation et de l’utilisation du sol par imagerie satellitaire Landsat en hydrogéologie', Télédétection, vol 6, no. 1, pp. 9-17.
De Wasseige, C., de Marcken, P., Bayol, N., Hiol Hiol, F., Mayaux, P., Desclée, B., Nasi, R., Billand, A., Defourny, D. & Eba’a Atyi, R. 2012, The Forests of the Congo Basin - State of the Forests 2010, Publications office of the European Union, Luxembourg.
Djohy, G.L., Vodounon, T.H. & Kinzo, E.N. 2016, 'Dynamique de l’occupation du sol et évolution des terres agricoles dans la commune de Sinende au Nord-Benin', Cahier du CBRST, Lettres, Sciences Humaines et Sociales, no. 9, pp. 101-21.
Duminili, T. 2007, Exploitation de données de télédétection en vue d’étudier la mise en place de l’écotourisme dans la région de Andavadoaka (Madagascar), Rapport de stage Université Montpellier, Montpellier.
Eba’a Atyi, R., Hiol Hiol, F., Lescuyer, G., Mayaux, P., Defourny, P., Bayol, N., Saracco, F., Pokem, D., Sufo Kankeu, R. & Nasi, R. 2022, The Forests of the Congo Basin: State of the Forests 2021, CIFOR, Bogor, Indonesia.
Esri2020, Global Land Use Cover from Sentinel-2, Samapriva Roy, viewed 24 June 2020, <Esri2020, Global Land Use Cover from Sentinel-2, Samapriva Roy, viewed 24 June 2020, http://gee-community-catalog.org/projet/esric2020:>.
FAO - Forest Resources Assessment 1996, Forest resources assessment, Survey of tropical forest cover and study of change processes, forestry Paper, 130, FAO, Roma.
FAO - Forest Resources Assessment 2019, The State of the World’s Biodiversity for Food and Agriculture, FAO Commission on Genetic Resources for Food and Agriculture Assessments, Rome.
FAO - Forest Resources Assessment 2022, The State of the World’s Forests 2022: Forest pathways for green recovery and building inclusive, resilient and sustainable economies, FAO, Rome, DOI:10.4060/cb9360en.
Gansaonré, R.N., Zoungrana, B.J.B. & Yanogo, P.I. 2020, 'Dynamique du couvert végétal à la périphérie du Parc W du Burkina Faso', Belgeo, vol. 21, no. 1, pp. 1-23, DOI:10.4000/belgeo.40786.
Harouna, M. 2005, Rapport d’étude sur la migration de colonisation agricole et dynamique territoriales dans les communes rurales de Say et de Tamou, Université Abdou Moumouni de Niamey, Niger.
Houessou, L.G., Teka, O., Imorou, I.T., Lykke, A.M. & Sinsin, B. 2013, 'Land use and land cover change at “W” Biosphere reserve and its surroundings areas in Benin Republic (West Africa)', Environment Natural Resources Research, vol. 3, no. 2, pp. 87-101, DOI:10.5539/enrr.v3n2p87.
Hussain, M., Chen, D., Cheng, A., Wei, H. & Stanley, D. 2013, 'Change detection from remotely sensed images: From pixel based to object-based approaches', ISPRS Journal of Photogrammetry and Remote Sensing, no. 80, pp. 91-106, DOI:10.1016/j.isprsjprs.2013.03.006.
Kone, I. 2013, 'Wildlife in Jeopardy Inside and Outside Protected Areas in Côte d’Ivoire: The combined effects of disorganization, lack of awareness, and institutional weakness', in N.S. Sodhi, L. Gibson & P.H. Raven (eds), Conservation biology: Voices from the Tropics, John Wiley & Sons, Hoboken, pp. 26-32.
Kouassi, J.L., Gyau, A., Diby, L., Bene, Y. & Kouamé, C. 2021, 'Assessing Land Use and Land Cover Change and Farmers’ Perceptions of Deforestation and Land Degradation in South-West Côte d’Ivoire, West Africa', Land, vol. 10, no. 4, 429, DOI:10.3390/land10040429.
Madjigoto, R., Ouya, B., Libar, J., Djim-Assal, D., Kemsol, A. & Dénénodji, A. 2015, Dégradation des massifs forestiers du Logone oriental: enjeux et perspectives: quelles stratégies pour une conservation durable, Sociétés et Environnement des Presses Universitaires de Zinder, pp. 1859-5103.
Mamane, B., Amadou, G., Barrage, M., Comby, J. & Ambouta, J.M.K. 2018, 'Dynamique spatio-temporelle d’occupation du sol dans la Réserve Totale de Faune de Tamou dans un contexte de la variabilité climatique (Ouest du Niger)', International Journal of Biological and Chemical Sciences, vol. 12, no. 4, pp. 1667-87, DOI:10.4314/ijbcs.v12i4.13.
Megevand, C., Mosnier, A., Hourticq, J., Sanders, K., Doetinchem, N. & Streck, C. 2013, Deforestation trends in the Congo Basin: Reconciling economic growth and forest protection, The World Bank.
MINFOF - Ministère des Forêts et de la Faune 2011, Rapport d’activités de la sous-direction des inventaires et des Aménagements Forestiers (SDIAF), MINFOF.
Momo Solefack, M.C., Njouonkou, A.L., Temgoua, L.F., Djouda, R., Zangmene, J.B. & Ntoupka, M. 2018, 'Land-Use/ Land-Cover change and anthropogenic causes around Koupa Matapit Gallery Forest, West-Cameroun', Journal of Geography and Geology, vol. 10, no. 2, pp. 201-19, DOI:10.5539/jgg.v10n2p56.
Momo, S.M.C., Chabrerie, O., Gallet, M.E., Nkongmeneck, A.B., Leumbe, L.O.N. & Decocq, G. 2012, 'Analyse de la dynamique de déforestation par télédétection couplée aux modèles d’équations structurales: Exemple de la forêt néphéliphile du mont Oku (Cameroun)', Acta Botanica Gallica: Botany Letters, vol. 159, no. 4, pp. 451-66, DOI:10.1080/12538078.2012.750583.
Nangndi, B., Tientcheu, A.M.L., Dong, E.B.A., Taffo, W.B.J., Tanougong, D.A. & Fonkou, T. 2021, 'Dynamique spatio-temporelle de l’occupation des terres en zones soudano guinéennes au Tchad: cas du paysage écologique de Larmanaye', Journal of Applied Biosciences, vol. 160, no. 1, pp. 16536-52, DOI:10.35759/JABs.160.9.
Nasi, R. & Forni, E. 2006, 'Exploitation industrielle du bois, aménagement forestier et impacts environnementaux', in R. Nasi, J.C. Nguinguiri & D.E. Blas, Exploitation et gestion durable des forêts en Afrique Centrale: La quête de la durabilité, Hamathan, Paris, pp. 1-16.
Ndobe, N.S. & Mantzel, K. 2014, Déforestation, REDD et le Parc national de Takamanda au Cameroun - une étude de cas, Forest Peoples Programme.
Noyola, M.C., Mering, C. & Rojas, B.A. 2009, 'Évaluation du changement de l’occupation du sol à l’aide des images Landsat et Spot : Champ volcanique de la Sierra Chichinautzin (Mexique)', 24th Internacional Cartography Conference: The World’s Geo-Spatial Solutions.
Nyamekye, C., Thiel, M., Schönbrodt-Stitt, S., Zoungrana, B.J.-B. & Amekudzi, L.K. 2018,'Soil and water conservation in Burkina Faso, West Africa', Sustainability, vol. 10, no. 9, 3182, DOI:10.3390/su10093182.
PNDP 2012, Plan communal de développement de Yabassi, Rapport.
République du Cameroun 1994, Loi n° 94/01 du 20 janvier 1994 portant régime des forêts, de la faune et de la pêche, Cameroun.
Sarr, M.A. 2009, 'Cartographie des changements d’occupation du sol entre 1990 et 2002 dans le nord du Sénégal (Ferlo) à partir des images Landsat', Cybergeo, European Journal of Geography, vol. 472, DOI:10.4000/cybergeo.22707.
Tanougong, A.D. & Tchamba, N.M. 2022, 'Time series analysis of remote sensing images of vegetation cover change in the Faro-Bénoué-Bouba Ndjidda ecological landscape, north region of Cameroon', Remote Sensing Applications: Society and Environment, vol. 27, 100792, DOI:10.1016/j.rsase.2022.100792.
Tchatchou, B., Sonwa, D.J., Ifo, S. & Tiani, A.M. 2015, Deforestation and forest degradation in the Congo Basin: State of knowledge, current causes and perspectives, Occasional Paper 144, CIFOR, Bogor, Indonesia.
Temgoua, F.L., Allaissem, B., Tchamba, M., Saradoum, G., Osée, M.M. & Momo, S.M.C. 2018, 'Spatio-temporal dynamic of Land use and Land cover in the classified forest of Djoli-Kera, South-Eastern Chad', Open Journal of Forestry, vol. 8, no. 3, pp. 283-96, DOI:10.4236/ojf.2018.83019.
Temgoua, L.F., Meyabeme Elono, A.L., Njiaghait, Y.M., Ngouh, A. & Kengne, C.N. 2021, 'Land use and land cover dynamics in the Melap Forest Reserve, West Cameroon : implications for sustainable management', Geology, Ecology and Landscapes, vol. 6, no. 4, pp. 305-315, DOI:10.1080/24749508.2021.1923269.
Tene, B. 2016, Mutation et devenir des paysanneries de l’opération Yabassi-bafang, Mémoire de Maîtrise, Université de Yaoundé.
Tsewoue, M.R., Tchamba, M., Avana, L.M. & Tanougong, D.A. 2020, 'Dynamique spatio-temporelle de l’occupation du sol dans le Moungo, Région du Littoral, Cameroun: Influence sur l’expansion des systèmes agroforestiers à base de bananiers', International Journal of Biological and Chemical Sciences, vol. 14, no. 2, pp. 486-500, DOI:10.4314/ijbcs.v14i2.15.
Vancutsem, C., Achard, F., Pekel, J.-F., Vieilledent, G., Carboni, S., Simonetti, D., Gallego, J., Aragao, L. & Nasi, R. 2021, 'Long-term (1990-2019) monitoring of tropical moist forests dynamics', Science Advances, vol. 7, no. 10, eabe1603, DOI:10.1126/sciadv.abe1603.
Wu, W., De Pauw, E. & Zucca, C. 2013, 'Using remote sensing to assess impacts of land management policies in the Ordos rangelands in China', International Journal Of Digital Earth, vol. 6, no. 2, pp. 81-102, DOI:10.1080/17538947.2013.825656.
Zoungrana, B.-J.B., Conrad, C., Thiel, M., Amekudzi, L.K. & Dapola, D.A.E. 2018, 'MODIS NDVI trends and fractional land cover change for improved assessments of vegetation degradation in Burkina Faso West Africa', Journal of Arid Environments, vol. 53, pp. 66-75, DOI:10.1016/j.jaridenv.2018.01.005.
Funding information
Data availability statement
Author notes
E-mail: lacatuskenne@gmail.comE-mail: mcarofr@yahoo.frE-mail: armand_tanougong@yahoo.comE-mail: etchikealex@yahoo.frE-mail: casanovaserge@yahoo.frE-mail: a.tchokomeni@sefeccam.comCorresponding author: Marie Caroline Momo Solefack; mcarofr@yahoo.fr
Conflict of interest declaration