Article
Evaluation of Precipitation Simulations at the Subseasonal Range in the Sao Francisco River Basin, Brazil
Avaliação de Simulações de Precipitação em Escala Subsazonal na Bacia do Rio São Francisco, Brasil
 Maria Luisa Rocha Santos malurochasantos@hotmail.com
Nicole Costa Resende Ferreira nicole.resende@yahoo.com.br
Claudine Dereczynski claudine.dereczynski@igeo.ufrj.br
Fernanda Cerqueira Vasconcellos fernandavasconcellos@igeo.ufrj.br
Sin Chan Chou chou.sinchan@gmail.com
Maria Luisa Rocha Santos malurochasantos@hotmail.com
Nicole Costa Resende Ferreira nicole.resende@yahoo.com.br
Claudine Dereczynski claudine.dereczynski@igeo.ufrj.br
Fernanda Cerqueira Vasconcellos fernandavasconcellos@igeo.ufrj.br
Sin Chan Chou chou.sinchan@gmail.com
Evaluation of Precipitation Simulations at the Subseasonal Range in the Sao Francisco River Basin, Brazil
Anuário do Instituto de Geociências, vol. 46, 59421, 2023
Universidade Federal do Rio de Janeiro
Received: 29 June 2023
Accepted: 11 October 2023
Funding
Funding source: Agência Nacional de Águas e Abastecimento
Funding source: Coordenação de Aperfeiçoamento de Pessoal de Nível Superior
Contract number: 88881.144894/2017-01
Funding
Funding source: Conselho Nacional de Desenvolvimento Científico e Tecnológico
Contract number: 312742/2021-5
Funding
Funding source: CNPq
Contract number: 800353/2018
Funding
Funding source: CAPES
Contract number: 88887.351539/2019-00
Abstract: The objective of this work is to evaluate the subseasonal precipitation simulations of the Eta model during the onset of the rainy season in the Sao Francisco River Basin (SFB). Accumulated precipitation every 20 days in September and October (2011 to 2015) was evaluated based on subseasonal simulations (integration period of up to 60 days) of the Eta-20-km model, nested within the Climate Forecast System Reanalysis (CFSR), here called Eta-CFSR. MERGE precipitation data were used to evaluate Eta-CFSR simulated precipitation. A statistical method was employed to evaluate the model’s ability to simulate the onset of the rainy season in the Upper SFB. The main results are: i) The Eta-CFSR accurately represents the seasonality of the precipitation pattern in the SFB and the seasonal and interannual variation of the accumulated precipitation in all of the chosen three consecutive 20-day periods of years 2011 to 2015; ii) The model can represent the transition pattern from the dry to the rainy season, showing better results in 2011 and 2015, which were marked, respectively, by La Niña and El Niño, and by anomalies of sea surface temperature favorable and unfavorable for the occurrence of precipitation; iii) Although the model underestimates the amount of precipitation, it effectively captures the seasonal patterns and the onset of the rainy season, with a maximum advancement of two pentads in wetter years and delaying it in drier years.
Keywords: Rainy season onset, Eta Regional Climate Model, CFSR.
Resumo: O objetivo deste trabalho é avaliar as simulações subsazonais de precipitação do modelo regional Eta na detecção do início da estação chuvosa na Bacia Hidrográfica do Rio São Francisco (BHSF). Foram avaliados acumulados de precipitação a cada 20 dias dos meses de setembro e outubro (2011 a 2015), a partir de simulações em horizonte subsazonal (prazo de integração de até 60 dias) do modelo Eta-20-km, aninhado ao Climate Forecast System Reanalysis (CFSR), aqui denominado Eta-CFSR. Dados de precipitação do MERGE foram utilizados para avaliação da precipitação simulada pelo Eta-CFSR. Um método estatístico foi aplicado para avaliar a habilidade do modelo em simular o início da estação chuvosa na região do Alto São Francisco. Os principais resultados do trabalho foram: i) O Eta-CFSR representa bem a sazonalidade do padrão de precipitação na BHSF e a variação sazonal e interanual da precipitação acumulada a cada 20 dias; ii) O modelo é capaz de representar o padrão da transição da estação seca para a chuvosa, exibindo melhores resultados nos anos de 2011 e 2015, anos marcados por, respectivamente, La Niña e El Niño, e por anomalias de temperatura da superfície do mar no Oceano Atlântico Tropical favoráveis e desfavoráveis à ocorrência de precipitação; iii) Ainda que o modelo não simule corretamente a magnitude da precipitação, subestimando-a, ele captura sua sazonalidade e o início da estação chuvosa, adiantando-a em no máximo duas pêntadas nos anos mais úmidos e atrasando-a em anos mais secos.
Palavras-chave: Início da estação chuvosa, Modelo regional Eta, CFSR.
1 Introduction
The Sao Francisco River Basin (SFB) is one of the major rivers in Brazil. It extends from 21°S up to 8°S and from 48°W up to 38°W ( Figure 1). In the SFB, one can find several power generation plants, extensive agricultural areas, mineral extraction, large and medium-sized urban areas, rainfed agricultural practices, and areas subject to flooding, forestry, and fishing ( Molinas 2019). Thus, the SFB is characterized by the complexity and diversity of water uses, which are constantly in conflict due to the scarcity of this resource ( Mascarenhas 2008). For study purposes, the SFB is divided into four sub-basins: Upper, Middle, Sub-Middle, and Lower Sao Francisco (SF), as shown in Figure 1.
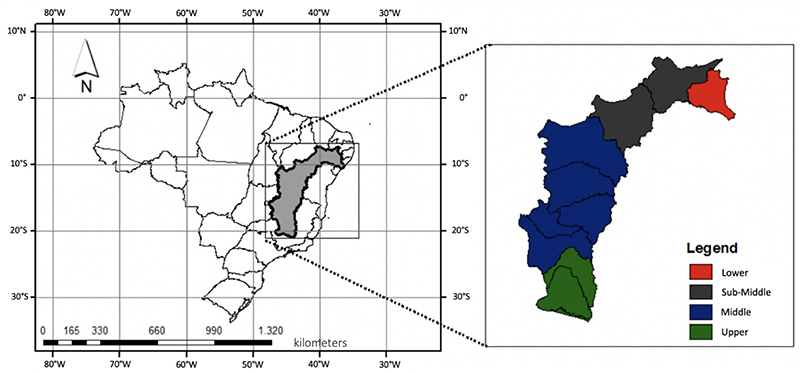
Figure 1.
Sao Francisco River Basin and its four major subbasins (Upper SF, Middle SF, Sub-Middle SF, and Lower SF).
The SFB is the third largest Brazilian hydrographic basin, and due to its large territorial extension, several atmospheric systems occur over the SFB. At lower levels, the Intertropical Convergence Zone (ITCZ), the South Atlantic Convergence Zone (SACZ), frontal systems, cyclones, and the Easterly Wave Disturbances (EWD) operate ( Satyamurty, Nobre & Silva Dias 1998). At upper levels, the Northeast Cyclonic Vortex (NCV) is the meteorological phenomenon that stands out. In addition, part of the SFB is located in the semi-arid region of Northeast Brazil, therefore, precipitation has significant space-time variability ( Marengo et al. 2011). Some of the variability modes that affect the precipitation regime in the study region are El Niño-Southern Oscillation (ENSO), Sea Surface Temperature (SST) anomalies in the Atlantic Ocean ( Reboita & Santos 2015), and the Madden-Julian Oscillation (MJO; Kayano & Andreoli 2009).
The study of precipitation predictability during the transition period from the dry to the rainy season in the Upper SF sub-basin (September and October) is valuable, as the rainfall regime in this region is crucial for the water availability in the other sub-basins. Furthermore, the subseasonal forecasts (from 30 to 60 days ahead) are helpful to the management of water resources, as they fill the gap between medium-range weather forecasts (up to 2 weeks) and long-term seasonal projections (3 to 6 months). However, it is essential to emphasize that such predictions have limitations ( White et al . 2017), mainly in areas far from the equatorial region, such as the Upper and Middle SF. In these regions, the subseasonal forecast highly depends on the initial conditions, and therefore, the influence of the boundary conditions is limited. Thus, a well-performing model should be able to adequately predict the traveling transient systems four to eight weeks in advance. Improving forecast accuracy in a subseasonal time scale requires investigating predictability sources associated with atmospheric, oceanic, and land-surface processes ( Vitart & Robertson 2019). According to Robertson, Vitart and Camargo (2020), the essential sources of predictability identified so far are the MJO ( Vitart 2017; Zhang et al. 2013), soil moisture ( Koster et al. 2010), snow cover ( Lin & Wu 2011; Sobolowski, Gong & Ting 2010), stratosphere-troposphere interactions ( Baldwin et al. 2003; Byrne & Shepherd 2018; Domeisen et al. 2019; Kuroda & Kodera 1998; Lim et al. 2019; Thompson et al. 2005) and ocean conditions ( Li & Robertson 2013; Saravanan & Chang 2019; Woolnough et al. 2007). High-resolution or mesoscale models can better identify severe convection and improve extreme weather and climate conditions ( WMO 2013), thus producing more accurate simulations at subseasonal scales when initialized with known predictability sources.
Many studies have been conducted to determine the onset of the rainy season. However, precisely definition of a rainy period's initial and final phase poses a complex challenge. Due to the irregular and intermittent nature of tropical precipitation, there is the possibility of dry days within a rainy period and vice versa ( Calbete, Lira & Sansigolo 2006). Reboita et al. (2014) found that the onset of the rainy season in the tropics occurs between pentad 56 and pentad 60 in October. Alves et al. (2005), based on a joint analysis of daily precipitation data produced by the Climate Prediction Center, concluded that the onset of the rainy season occurs from pentad 60 to pentad 62 in the SFB, that is, between the end of October and the beginning of November. Minuzzi et al. (2006) analyzed the interannual precipitation variability using data from meteorological stations in Minas Gerais (Brazil). They concluded that the rainy season begins between the end of September and the beginning of November. With a methodology based on Outgoing Longwave Radiation (OLR), Marengo et al. (2003) applied Kousky (1988) method, and they identified that in the Upper SF, the onset of the rainy season happens in September, and that the rains intensify in October, and peak in December and January.
This work aims to evaluate the subseasonal precipitation simulations produced by the Eta regional model nested within the Climate Forecast System Reanalysis (CFSR), referred to as Eta-CFSR. Such simulations were carried out at 20-km horizontal resolution, over the SFB region, from September to October and using data from 2011 to 2015. Furthermore, a statistical method is employed to evaluate the performance of the Eta-CFSR in simulating the onset of the rainy season in the Upper SFB.
This work is divided into four sections, including this Introduction. Section 2 describes the methodology and data used in this work. Section 3 presents the results, with the climatology of accumulated precipitation in September and October, the analysis of the teleconnection patterns during the analyzed period, the results of the evaluation of the simulations of precipitation of the Eta-CFSR model, and finally, the results of determining the onset of the rainy season in the Upper SF. The conclusions are summarized in Section 4.
2 Methodology and Data
2.1 The Eta Model
The Eta model ( Mesinger & Veljovic 2017; Mesinger et al . 2012) has been used by the National Institute for Space Research (INPE) to produce forecasts for South America in different time ranges, for example, for weather forecasting ( Seluchi et al. 2011; Seluchi & Chou 2009; Siqueira et al. 2016), subseasonal and seasonal forecasts ( Chou et al. 2005; Chou et al. 2018; Chou et al. 2019; Ferreira & Chou 2019; Pilotto et al. 2012; Rezende & Chou 2014), projections of climate change ( Chou et al. 2012; Dereczynski et al. 2020; Lyra et al. 2018; Marengo et al. 2012), and for paleoclimate simulations ( Marchi et al. 2022).
The model has the following prognostic variables: air temperature, zonal and meridional wind components, specific humidity, surface pressure, turbulent kinetic energy, cloud hydrometeors, and land-surface temperature and moisture.
The equations solved in the model are on the Arakawa E grid using a split-explicit time integration scheme. The gravity wave terms are computed using the forward-backward scheme as modified by Mesinger (1974), summarized in Janjić (1979), note however some misleading statements made, addressed by Mesinger and Popovic (2010). For the horizontal advection terms, a first forward-then-over-centered scheme is employed. Eta is a fully finite volume model since the horizontal advection of the model follows the Arakawa approach ( Janjić 1984), and the vertical advection uses a van Leer type of piecewise linear scheme ( Mesinger et al. 2012). In its climate version, the model's physics package uses the Betts-Miller scheme (Betts & Miller 1986) to represent convective precipitation and the Zhao scheme (Zhao & Carr 1997) to reproduce the cloud microphysics processes. The longwave radiation component is solved by Schwarzkopf and Fels (1991), and the shortwave component is solved by Lacis and Hansen (1974). The surface layer is based on the Monin-Obukhov similarity theory, and Paulson’s (1970) stability functions and turbulence transports on a modified Mellor-Yamada 2.5 scheme (Mellor & Yamada 1982; Mesinger 1993). The NOAH scheme represents Earth's surface processes ( Ek et al . 2003).
2.1.1 Evaluation of Eta Model Simulations
The Eta simulations at the subseasonal range were generated for a 60-day integration period, from September 1st to October 30th, from 2011 to 2015. The horizontal resolution of the model used was 20 km, and the initial and boundary conditions of the model were obtained from the CFSR ( Saha et al. 2010). This period was chosen to capture the transition from the dry season to the rainy season in Upper SF and Middle SF.
The MERGE precipitation product ( Rozante et al. 2010), which combines surface observations with satellite estimates and reanalyses precipitation by Barnes' objective analysis as an interpolation method at regularly spaced grid points in South America, was used to evaluate the Eta subseasonal integrations. This observational MERGE data was interpolated to the Eta 20-km grid to enable the calculations between the two datasets. The evaluation of the Eta Model performance involved assessing the accumulated precipitation in three 20-day periods and comparing it with the MERGE precipitation product. The simulations were evaluated for three consecutive periods of 20 days within each of the years from 2011 to 2015. The simulation from September 01st until September 20th is named T1, from September 21st to October 10th is T2, and from October 11th to October 30th is T3.
To quantify the correspondence between simulation results and observed data, the spatial correlation (CORR) between MERGE data and the Eta Model simulation is calculated. CORR highlights the link between two spatially distributed variables, either positively or negatively ( Wilks 2011). Equation 1 shows the correlation between variables x and y. In this work, the CORR was calculated only within the SFB, with x representing the forecast and y the observed data. The CORR classification was based on thresholds proposed by Mukaka (2012), namely: i) Very High (CORR ≥ 0.9); ii) High (0.7 ≤ CORR < 0.9); iii) Moderate (0.5 ≤ CORR < 0.7); iv) Low (0.3 ≤ CORR < 0.5); and Very Low (0 ≤ CORR < 0.3).
2.1.2 Observed Data for Analysis of Teleconnection Systems
The Multivariate ENSO Index version 2 (MEIv.2), provided by the Physical Sciences Laboratory at the National Weather Service ( Wolter & Timlin 2011), served as a classification criterion for identifying ENSO-neutral conditions. MEIv.2 is calculated based on an analysis of five critical variables related to ENSO indices at bi-monthly intervals, including Mean Sea Level Pressure (MSLP), Sea Surface Temperature (SST), 10-meter zonal wind (U), 10-meter meridional wind (V), and Outgoing Longwave Radiation (OLR). MEIv.2 is derived using Empirical Orthogonal Function (EOF) statistical analysis on a matrix consisting of column vectors representing standardized anomalies of MSLP, SST, U, V, and OLR within the geographical region spanning from 30°S to 30°N and 100°E to 70°W ( Wolter & Timlin 1993, 1998). It is noteworthy that, as per the findings of Wolter and Timlin (2011), MEIv.2 demonstrates superior stability compared to most real-time ENSO indices and more effectively captures the seasonal variability of ENSO.
Observed data, including monthly SST and OLR global anomaly fields, were obtained from the Global Monitoring dataset provided by INPE, utilizing data from the National Centers for Environmental Prediction (NCEP) reanalysis. The monthly SST and OLR anomaly fields show a deviation from the average of the climatology monthly field from 1981 and 2010. Furthermore, the OLR anomaly fields from Global Monitoring and INPE were used to analyze the MJO phases. For interpretation, we examined the connection between anomalous precipitation patterns and Sea Surface Temperature (SST) anomalies in the Tropical North Atlantic, Tropical South Atlantic, and Northeast Brazil (NEB). Our analysis focused specifically on regions defined by latitudes 25°N to 25°S and longitudes 20°E to 80°W during the September, October, and November quarters (SON), following the methodology of Reboita and Santos (2015).
2.2 Onset of the Rainy Season
This methodology was applied only to the Upper SF sub-basin, considering the dry season period in the southern winter months and the transition period from the dry to the rainy season in September and October ( ANA, GEF, PNUMA & OEA 2004). The method evaluates the average yearly rainfall for every 5 days, called pentads, totaling 73 fixed pentads. The standard deviation (Dppi) and the mean precipitation (Mdpi) are calculated for the pentads of the winter months in the Southern Hemisphere, from June 20th until September 22nd, which is climatologically the dry season in the Upper SF ( Molinas 2019). This period corresponds to the pentads 35 to 53.
This study introduces a novel method for identifying the onset of the rainy season based on statistical properties of average precipitation in pentads during the dry season, employing a threshold calculation using the mean and standard deviation of pentad precipitation. The average precipitation in pentads of the dry season is similar to a normal distribution. As such, the pentads characteristic of the onset of the rainy season is defined for each analyzed year as the first pentad that exceeds (Mdpi) + 2(Dppi). The threshold is calculated for both data, MERGE and Eta simulations, enabling the comparison. In this way, statistical consistency in the results is guaranteed as the threshold comprises results from a sample of pentads from the same year and database.
Thus, the representative pentad of the onset of the rainy season is the one that results in the mean precipitation greater than the threshold in two subsequent pentads.
3 Results
3.1 Precipitation Climatology at SFB in September and October
This subsection presents precipitation climatology in the SFB region in September and October ( Figure 2), using MERGE data from 2001 to 2020. It is observed that September is a dry month across most parts of the basin, with accumulated precipitation ranging up to 25 mm/month in the Middle and Sub-Middle SF. The total rainfall is slightly higher in the Upper and Lower SF, ranging from 25 to 40 mm in September. In October, precipitation amounts in the upper course of the river’s upper course exceed 70 mm/month, while the middle course experiences precipitation exceeding 55 mm/month.
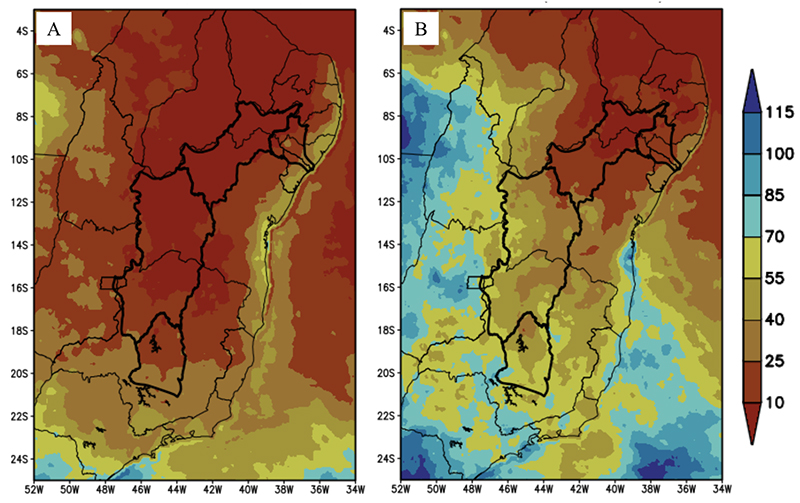
Figure 2.
Monthly mean precipitation (mm/month) in Sao Francisco River Basin and sub-basins (thick contour), an average of 2001 to 2020 for A. September and B. October using MERGE data. Thin contours refer to the states.
3.2 Variability Modes
In this section, a brief analysis of the factors that may influence or hinder the occurrence of precipitation in the study region during the designated period is conducted. For this purpose, the phases of ENSO were evaluated through the MEI index, the SST anomalies in the North and South Atlantic Ocean, and the phases of the MJO through the OLR anomaly during the period of interest.
Firstly, several studies have indicated that the occurrence of El Niño (EN) can lead to a deficit of precipitation in the North and NEB Regions ( Barros, Grimm & Doyle 2002; Grimm 2003; Hastenrath & Greischar 1993; Hastenrath & Heller 1977; Marengo et al. 2011; Nobre & Shukla 1996), while La Niña (LN) is associated with excessive precipitation ( Aceituno 1988; Grimm 2003; Grimm, Barros & Doyle 2000; Meggers 1994). According to the classification of the MEI index, in 2011, the bimonthly period of interest indicated an LN episode (-1.4), while in 2015, it indicated an EN episode (2.1). The other years, 2012, 2013, and 2014, were classified as neutral.
Next, an investigation of SST anomalies in the tropical North and South Atlantic Oceans was carried out based on the data provided by INPE. Negative temperature anomaly gradients are associated with increased rainfall, while positive anomaly gradients are associated with decreased precipitation in the Lower SF. During September and October, a positive anomaly was observed in the Tropical North Atlantic in 2011 (approximately 0.5 ºC ̶ 1.0 °C). In October 2014 and 2015, a positive anomaly (approximately 0.5 ºC ̶ 1.0 °C) was recorded in the Tropical North Atlantic, while the anomaly in the Tropical South Atlantic was nonsignificant, with absolute values lower than 0.5 °C. On the other hand, 2012 and 2013 showed non-significant anomalies in both sectors.
Lastly, the MJO phases were analyzed using OLR anomaly data from the Global Monitoring provided by INPE. This variable provides information on ascending (negative values) and descending (positive values) movements in the atmosphere, making it possible to understand where the formation of convective clouds is favored or inhibited, and these results can be related to the phases of the MJO. In September and October of the analyzed years, the OLR anomalies were nearly zero in the region of interest, suggesting that the MJO did not significantly influence the analysis.
Thus, from these analyses and the classifications mentioned above, it is concluded that precipitation was enhanced in September and October 2011 due to the LN phase and suppressed due to the positive anomaly in the Tropical North Atlantic. 2012, 2013, and 2014 were ENSO-neutral years with no relevant anomalies. In 2015, with intense EN and positive Tropical North Atlantic anomaly, precipitation was not favored.
3.3 Evaluation of Simulated Precipitation
In this section, we present the assessment of precipitation at the subseasonal range from the Eta-CFSR simulations for initial conditions in September and October. The evaluation calculates the mean error and the spatial correlation between the Eta simulation and the observed MERGE data in the three 20-day periods, T1, T2, and T3.
Precipitation in the SFB increases from T1 to T3, particularly in the Upper and Middle SF, indicating the transition from the dry to the rainy period in these sub-basins, as mentioned by Marengo et al. (2003). In 2011, higher precipitation accumulations were observed compared to other years, mainly in T3 when the rainy season was already established due to the strong LN and positive anomaly in the Tropical North Atlantic (figure not shown). 2012, 2013, and 2014 were ENSO-neutral years, with no significant SST anomalies in the Atlantic Ocean, and were out of phase with the MJO. Thus, these years did not exhibit strong anomalies. Finally, 2015 was marked by an intense EN episode, which did not favor the occurrence of rain in the NEB (figure not shown). Overall, the model simulates a precipitation pattern similar to the observed data within the SFB and can reproduce the interannual variability (figures not shown).
Figure 3 shows the differences between the simulated and observed accumulated precipitation in T3. These results show the underestimation of precipitation in the Middle and Sub-Middle SF sub-basins, especially in 2011, 2013, and 2014. The largest overestimates are found in the Upper SF, especially in 2012. Therefore, errors are most significant in the period and the region of largest accumulated rains, in T3 and in the Upper and Middle SF.
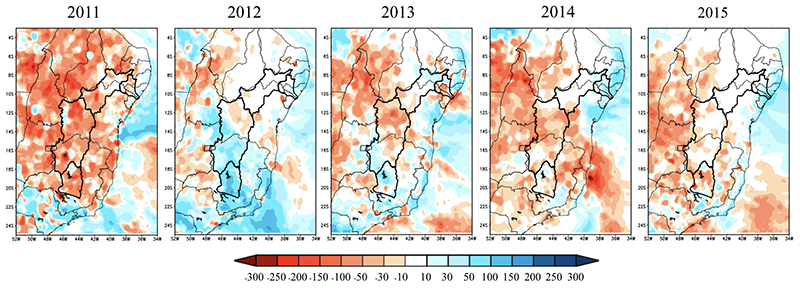
Figure 3.
Precipitation errors (mm/20 days) from Eta-CFSR simulations with respect to MERGE data from October 11th to October 30th (T3) from 2011 to 2015.
Table 1 presents the pattern correlation of 20-day accumulated precipitation between the Eta simulation and the observed data. Values close to 1 indicate that the model accurately simulated the areas of maximum and minimum precipitation within the SFB. There is no negative correlation, suggesting that the overall pattern is generally well captured by the simulations.
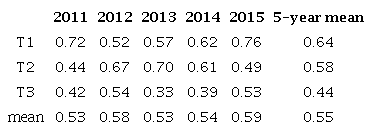
Figure 4 displays the cumulative precipitation data in boxplot format for the SFB region and its sub-basins. The "boxes" represent spatial precipitation averages for each sub-basin and the SFB for each year (2011 to 2015) based on Eta-CFSR simulations and MERGE data for the T1, T2, and T3 periods. With these results, it is possible to compare the interannual variability between the simulations and the observed data for these three 20-day periods, and the difference between the mean values obtained by the model and the observations.
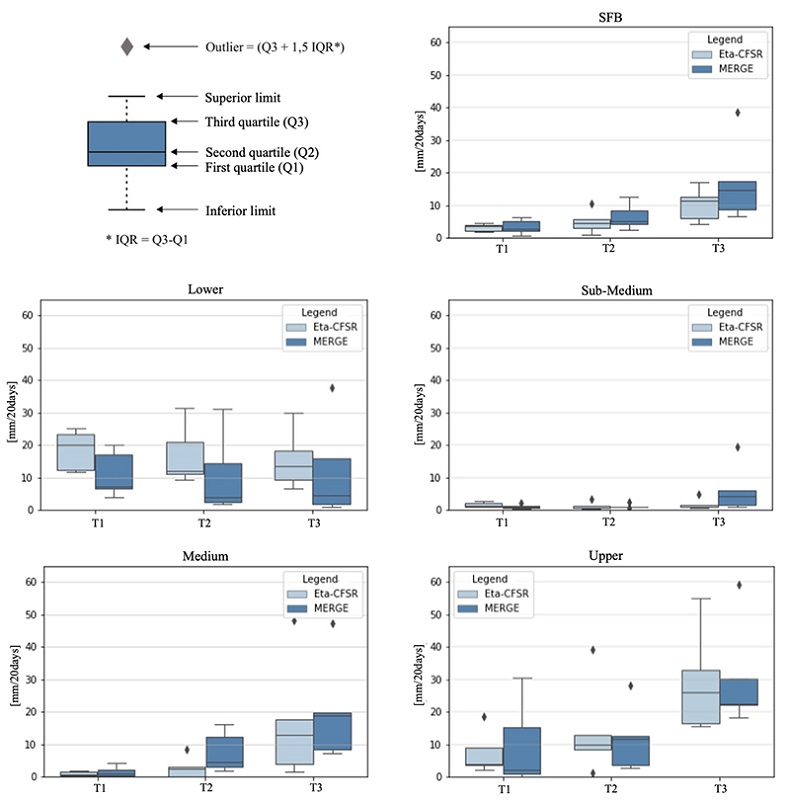
Figure 4.
Boxplots of precipitation (mm/20 days) simulated (light blue) and observed (dark blue) for the periods T1, T2, and T3 for the entire SFB and the four sub-basins. The "box" consists of minimum, maximum, first quartile (Q1), second quartile or median (Q2), and third quartile (Q3) of data distributions. The outliers (diamond) are classified as values lower than (Q1 - 1.5 IQR) and higher than (Q3 + 1.5 IQR), where IQR = Q3-Q1.
The simulations capture the variability from T1 until T3 in all the basins and sub-basins. The decreasing trend of the "boxes" in the Lower SF indicates a reduction in precipitation with the onset of the dry period in NEB during October. Conversely, Figure 4 shows an increasing trend in precipitation amounts from T1 to T3 in the Middle and Upper SF with the onset of the rainy period in Southeast Brazil during October.
3.4 The Onset of the Rainy Season in the Upper Sao Francisco
The Upper SF sub-basin is critical due to high water demand in various economic sectors. Figure 5 illustrates the 5-day average precipitation from pentad 40 to 73 from 2011 to 2015 in the Upper SF sub-basin. Vertical lines represent the characteristic pentads of the rainy season onset for the observations and simulations.
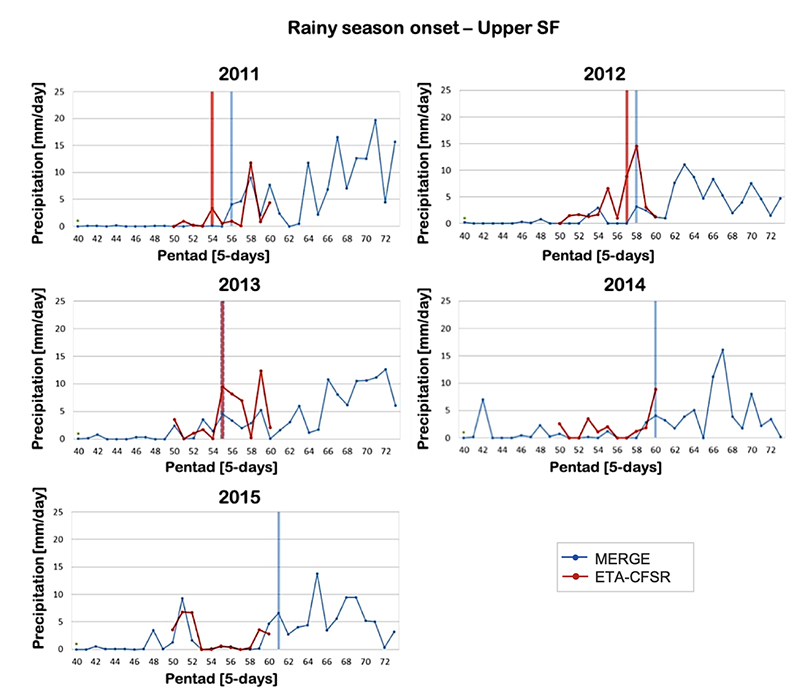
Figure 5.
5-day mean precipitation (mm/day) from pentad 40 until pentad 73, for the Upper SF, for 2011 to 2015, from the 60-day Eta simulations (red curves) and MERGE observations (blue curves). The vertical bars indicate the characteristic pentad of the onset of the rainy season for simulations (red) and observations (blue).
Figure 5 shows an increase in precipitation rates towards the end of the simulation period in the Upper SFB. In 2011 and 2012, the simulation advanced the onset of the rainy season by two pentads and one pentad, respectively. In 2013, the simulation accurately reproduced the onset pentad of the observations. In 2014 and 2015, the simulations did not indicate the onset of the rainy season within the 60-day integration period. In these years, the observations showed that the onset of the rainy season occurred after October 30th. Hence, the simulations of 2014 and 2015 correctly captured the delayed onset of the rainy season.
Despite the few years analyzed, the model accurately reproduced or closely approximated the onset pentads of the rainy season in 2011, 2012, and 2013 and successfully captured the delayed rainy season onset in 2014 and 2015.
4 Conclusions
In this study, we evaluated the Eta Model’s precipitation simulations conducted by the CFSR at a horizontal resolution of 20 km and in the subseasonal time interval from 2011 to 2015. The simulations focused on the SFB region and started in September and October. The results indicate that while the model did not accurately simulate the magnitude of accumulated precipitation, it successfully captured the subseasonal precipitation trends. Moreover, most of the time, it correctly reproduced the interannual variation of accumulated precipitation every 20 days, showing, as observed, larger precipitation amounts in 2011 and lower amounts in 2015, for example.
During the transition months from the dry season to the rainy season in the Upper SF and Middle SF, precipitation in the SFB increases from the first twenty days to the last twenty days of the simulations. In general, the model underestimated precipitation in the basin, except for 2012 and the Upper SF in 2013. The simulations performed notably well in 2011 and 2015, aligning with the influence of ENSO phases and SST anomalies that were favorable to precipitation in 2011 and unfavorable in 2015.
The technique applied to determine the onset of the rainy season in Upper SF revealed that the model effectively captured the subseasonal distribution of precipitation in pentads. The onset of the rainy season in the Upper SF sub-basin was accurately represented by the model in 2013, advanced by one pentad in 2012 and two pentads in 2011. In contrast, the model correctly delayed the onset in the dry years of 2014 and 2015.
5. Acknowledgments
This work is partially funded jointly by the Agência Nacional de Águas e Abastecimento and the Coordenação de Aperfeiçoamento de Pessoal de Nível Superior: Project ANA/CAPES No. 88881.144894/2017-01. S.C. Chou thanks Conselho Nacional de Desenvolvimento Científico e Tecnológico (CNPq) for grant 312742/2021-5. M.L.R.S. Silva thanks CNPq PIBIC/INPE for the grant 800353/2018. N. Resende thanks CAPES for grant 88887.351539/2019-00.
References
Aceituno, P. 1988, 'On the functioning of the Southern Oscillation in the South American sector, Part I: Surface climate', Monthly Weather Review , vol. 116, pp. 505-24, DOI:10.1175/1520-0442(1989)002<0341:OTFOTS>2.0.CO;2.
Alves, L.M.J.A., Camargo Júnior, H. & Castro, C. 2005, 'Início da estação chuvosa na região sudeste do Brasil: parte 1 - Estudos observacionais', Revista Brasileira de Meteorologia , vol. 20, no. 3, pp. 385-94.
ANA - Agência Nacional de Águas, GEF - Fundo para o Meio Ambiente Mundial, PNUMA - Programa das Nações Unidas para o Meio Ambiente, OEA - Organização dos Estados Americanos 2004, Subprojeto 4.5C - Plano Decenal de Recursos Hídricos da Bacia Hidrográfica do Rio São Francisco-PBHSF (2004-2013), Projeto de gerenciamneto integrado das Atividades desenvolvidas em terra na bacia do Rio São Francisco , Brasília.
Baldwin, M.P., Stephenson, D.B., Thompson, D.W., Dunkerton, T.J., Charlton, A.J. & O'Neill, A. 2003, 'Stratospheric memory and skill of extended-range weather forecasts' , Science , vol. 301, no. 5633, pp. 636-40, DOI:10.1126/science.1087143.
Barros, V.R., Grimm, A.M. & Doyle, M.E. 2002, 'Relationship between temperature and circulation in Southeastern South America and its influence from El Ninño and La Ninña events' , Journal of the Meteorological Society of Japan, Ser. II , vol. 80, no. 1, pp. 21-32, DOI:10.2151/jmsj.80.21.
Betts, A.K. & Miller, M.J. 1986, 'A new convective adjustment scheme. Part II: Single column tests using GATE wave, BOMEX, ATEX and arctic air‐mass data sets' , Quarterly Journal of the Royal Meteorological Society , vol. 112, no. 473, pp. 693-709, DOI:10.1002/qj.49711247308.
Byrne, N.J. & Shepherd, T.G. 2018, 'Seasonal persistence of circulation anomalies in the Southern Hemisphere stratosphere and its implications for the troposphere' , Journal of Climate , vol. 31, no. 9, pp. 3467-83, DOI:10.1175/JCLI-D-17-0557.1.
Calbete, N., Lira, A. & Sansigolo, C. 2006, 'Estimativas do início da estação chuvosa no Vale do Paraíba e Litoral Norte de São Paulo', in Congresso Brasileiro de Meteorologia, vol. 14, Florianópolis.
Chou, S.C., Bustamante, J.F. & Gomes, J.L. 2005, 'Evaluation of Eta Model seasonal precipitation forecasts over South America', Nonlinear Processes in Geophysics, vol. 12, pp. 537-55, DOI:10.5194/npg-12-537-2005.
Chou, S.C., Marengo, J.A., Lyra, A.A., Sueiro, G., Pesquero, J.F., Alves, L.M., Kay, G., Betts, R., Chagas, D.J., Gomes, J.L. & Bustamante, J.F. 2012, 'Downscaling of South America present climate driven by 4-member HadCM3 runs' , Climate Dynamics , vol. 38, pp. 635-53, DOI:10.1007/s00382-011-1002-8.
Chou, S.C., Marengo, J.A., Silva, A.J., Lyra, A.A., Tavares, P., Souza, C.R.D.G., Harari, J., Nunes, L.H., Greco, R., Hosokawa, E.K. & Aragão, L.E. 2019, 'Projections of climate change in the coastal area of Santos', in L.H. Nunes, R. Greco & J.A. Marengo (eds) , Climate change in Santos Brazil: Projections, impacts and adaptation options, Springer, Cham, pp. 59-73, DOI:10.1007/978-3-319-96535-2_4.
Chou, S.C., Resende, N., Rocha, M.L., Dereczynski, C.P., Gomes, J.L., & Sueiro, G. 2018, From Subseasonal to Seasonal forecasts over South America using the Eta Model, Numerial Weather, Belgrado.
Dereczynski, C., Chou, S.C., Lyra, A., Sondermann, M., Regoto, P., Tavares, P., Chagas, D., Gomes, J.L., Rodrigues, D.C. & de los Milagros Skansi, M. 2020, 'Downscaling of climate extremes over South America-Part I: Model evaluation in the reference climate' , Weather and Climate Extremes , vol. 29, 100273, DOI:10.1016/j.wace.2020.100273.
Domeisen, D.I., Garfinkel, C.I. & Butler, A.H. 2019, 'The teleconnection of El Niño Southern Oscillation to the stratosphere' , Reviews of Geophysics, vol. 57, no. 1, pp. 5-47, DOI:10.1029/2018RG000596.
Ek, M.B., Mitchell, K.E., Lin, Y., Rogers, E., Grunmann, P., Koren, V., Gayno, G. & Tarpley, J.D. 2003, 'Implementation of Noah land surface model advances in the National Centers for Environmental Prediction operational mesoscale Eta Model' , Journal of Geophysical Research: Atmospheres , vol. 108, no. D22, DOI:10.1029/2002JD003296.
Ferreira, N.C.R. & Chou, S.C. 2019, 'Influência do tipo de textura e umidade inicial do solo sobre a simulação da precipitação', Anuário do Instituto de Geociências, vol. 41, no. 3, pp. 680-9.
Grimm, A.M. 2003 , 'The El Niño impact on the summer monsoon in Brazil: Regional processes versus remote influences' , Journal of Climate, vol. 16, pp. 263-80, DOI:10.1175/1520-0442(2003)016<0263:TENIOT>2.0.CO;2.
Grimm, A.M., Barros, V.R. & Doyle, M.E. 2000, 'Climate variability in southern South America associated with El Niño and La Niña events' , Journal of Climate , vol. 13, no. 1, pp. 35-58. DOI:10.1175/1520-0442(2000)013<0035:CVISSA>2.0.CO;2.
Hastenrath, S. & Greischar, L. 1993 , 'Further work of Northeast Brazil rainfall anomalies' , Journal of Climate , vol. 6, pp. 743-58, DOI:10.1175/1520-0442(1993)006<0743:FWOTPO>2.0.CO;2.
Hastenrath, S. & Heller, L. 1977, 'Dynamics of climatic hazards in Northeast Brazil', Quarterly Journal of the Royal Meteorological Society, vol. 103, no. 435, pp. 77-92, DOI:10.1002/qj.49710343505.
Janjić, Z.I. 1979, 'Forward-backward scheme modified to prevent two-grid-interval noise and its application in sigma coordinate models', Contributions to Atmospheric Physics, vol. 52, pp. 69-84.
Janjić, Z.I. 1984, 'Nonlinear advection schemes and energy cascade on semi-staggered grids', Monthly Weather Review , vol. 112, no. 6, pp. 1234-45, DOI:10.1175/1520-0493(1984)112<1234:NASAEC>2.0.CO;2.
Kayano, M.T. & Andreoli, R.V. 2009, 'Clima da Região Nordeste do Brasil', in I.F.A. Cavalcanti, N.J. Ferreira, M.G.A. Justi da Silva & M.A. Silva Dias (orgs), Tempo e clima no Brasil, Oficina de Tetos, São Paulo, pp. 213-31.
Koster, R.D., Mahanama, S.P.P., Yamada, T.J., Balsamo, G., Berg, A.A., Boisserie, M., Dirmeyer, P.A., Doblas-Reyes, F.J., Drewitt, G., Gordon, C.T., Guo, Z., Jeong, J.-H., Lawrence, D.M., Lee, W.-S., Li, Z., Luo, L., Malyshev, S., Merryfield, W.J., Seneviratne, S.I., Stanelle, T., van der Hurk, B.J.J.M., Vitart, F. & Wood, E.F. 2010, 'Contribution of land surface initialization to subseasonal forecast skill: First results from a multi‐model experiment' , Geophysical Research Letters , vol. 37, no. 2 , DOI:10.1029/2009GL041677.
Kousky, V.E. 1988, 'Pentad outgoing longwave radiation climatology for the South American sector' , Revista Brasileira de Meteorologia , vol. 3, no. 1, pp. 217-31.
Kuroda, Y. & Kodera, K. 1998, 'Interannual variability in the troposphere and stratosphere of the Southern Hemisphere winter' , Journal of Geophysical Research: Atmospheres , vol. 103, no. D12, pp. 13787-99, DOI:10.1029/98JD01042.
Lacis, A.A. & Hansen, J.E. 1974, 'Atmosphere of Venus: Implications of Venera 8 sunlight measurements' , Science , vol. 184, no. 4140, pp. 979-82, DOI:10.1126/science.184.4140.979.
Li, S. & Robertson, A.W. 2013, 'Evaluation of sub-monthly forecast skill from global ensemble prediction systems' , AGU Fall Meeting Abstracts, vol. 2013, pp. A13E-0259.
Lim, E.-P., Hendon, H.H., Boschat, G., Hudson, D., Thompson, D.W., Dowdy, A.J. & Arblaster, J.M. 2019, 'Australian hot and dry extremes induced by weakenings of the stratospheric polar vortex' , Nature Geoscience , vol. 12, no. 11, pp. 896-901, DOI:10.1038/s41561-019-0456-x.
Lin, H. & Wu, Z. 2011, 'Contribution of the autumn Tibetan Plateau snow cover to seasonal prediction of North American winter temperature' , Journal of Climate , vol. 24, no. 11, pp. 2801-13, DOI:10.1175/2010JCLI3889.1.
Lyra, A., Tavares, P., Chou, S.C., Sueiro, G., Dereczynski, C., Sondermann, M., Silva, A., Marengo, J. & Giarolla, A. 2018, 'Climate change projections over three metropolitan regions in Southeast Brazil using the non-hydrostatic Eta regional climate model at 5-km resolution' , Theoretical and Applied Climatology , vol. 132, pp. 663-82, DOI:10.1007/s00704-017-2067-z.
Marchi, A.C., de Melo, M.L.D., de Arruda Lyra, A., Kubota, P.Y., Chou, S.C. & Rosas, P. 2022, 'Mid-Holocene climate simulations over Brazil using the Eta regional paleoclimate model' , Derbyana, vol. 43, e775, DOI:10.14295/derb.v43.775.
Marengo, J., Alves, L.M., Castro, C.A.C. & Mendes, D. 2003, Início da estação chuvosa nas Regiões Sudeste, Centro-Oeste e sul do Nordeste do Brasil, afetadas pela crise de energia, INPE, CPTEC, viewed 31 January 2019, < 2003, Início da estação chuvosa nas Regiões Sudeste, Centro-Oeste e sul do Nordeste do Brasil, afetadas pela crise de energia, INPE, CPTEC, viewed 31 January 2019, http://energia1.cptec.inpe.br/regiaoafetadas/pt>.
Marengo, J.A., Alves, L.M., Alvala, R., Cunha, A.P., Brito, S. & Moraes, O.L. 2017, ‘Climatic characteristics of the 2010-2016 drought in the semiarid Northeast Brazil region’. Anais da Academia Brasileira de Ciências , vol. 90, pp. 1973-1985, DOI: 10.1590/0001-3765201720170206.
Marengo, J.A., Alves, L.M., Beserra, E.A. & Lacerda, F.F. 2011, 'Variabilidade e mudanças climáticas no semiárido brasileiro' , Recursos Hídricos em Regiões Áridas e Semiáridas , vol. 1, pp. 385-422.
Marengo, J.A., Chou, S.C., Kay, G., Alves, L.M., Pesquero, J.F., Soares, W.R., Santos, D.C., Lyra, A.A., Sueiro, G., Betts, R. & Chagas, D.J. 2012, 'Development of regional future climate change scenarios in South America using the Eta CPTEC/HadCM3 climate change projections: Climatology and regional analyses for the Amazon, São Francisco and the Paraná River basins' , Climate Dynamics , vol. 38, pp. 1829-48, DOI:10.1007/s00382-011-1155-5 .
Mascarenhas, A.C.M. 2008, 'Conflitos e gestão de águas: O caso da bacia hidrográfica do rio São Francisco', Master Thesis, Universidade de Brasília, Brasil.
Meggers, B.J. 1994, 'Archeological evidence for the impact of mega-Niño events on Amazonia during the past two millennia', Climatic Change , vol. 28, no. 4, pp. 321-38, DOI:10.1007/BF01104077.
Mellor, G.L. & Yamada, T. 1982, ´Development of a turbulence closure model for geophysical fluid problems´, Reviews of Geophysics and Space Physics , vol. 20, pp. 851-875, DOI: 10.1029/RG020i004p00851.
Mesinger, F. & Popovic, J. 2010, 'Forward-backward scheme on the B/E grid modified to suppress lattice separation: the two versions, and any impact of the choice made?' , Meteorology and Atmospheric Physics , vol. 108, pp. 1-8, DOI:10.1007/s00703-010-0080-1.
Mesinger, F. & Veljovic, K. 2017, 'Eta vs. sigma: Review of past results, Gallus-Klemp test, and large-scale wind skill in ensemble experiments' , Meteorology and Atmospheric Physics , vol. 129, pp. 573-93, DOI:10.1007/s00703-016-0496-3.
Mesinger, F. 1974, 'An economical explicit scheme which inherently prevents the false two-grid-interval wave in the forecast fields', in Symposium on Difference and Spectral Methods for Atmosphere and Ocean Dynamics Problems, Academy of Sciences, Novosibirsk, 17-22 September 1973; Part II, 18-34.
Mesinger, F. 1993, ´Forecasting upper tropospheric turbulence within the framework of the Mellor-Yamada 2.5 closure, Research Activities in Atmospheric and Oceanic Modelling’, WMO, Geneva, CAS/JSC WGNE Rep. 18, pp. 428-429.
Mesinger, F., Chou, S.C., Gomes, J.L., Jovic, D., Bastos, P., Bustamante, J.F., Lazic, L., Lyra, A.A., Morelli, S., Ristic, I. & Veljovic, K. 2012, 'An upgraded version of the Eta Model' , Meteorology and Atmospheric Physics , vol. 116, pp. 63-79, DOI:10.1007/s00703-012-0182-z.
Minuzzi, R.B., Sediyama, G.C., da Motta Barbosa, E., de Melo Júnior, J.C.F. & Catalunha, M.J. 2006, 'Estudo climático do comportamento do período chuvoso no estado de Minas Gerais' , Revista Ceres , vol. 53, no. 306, pp. 266-75.
Molinas, P.A. 2019, Gestão e operações do projeto de integração do rio São Francisco com bacias hidrográficas no nordeste setentrional, Tanto Expresso, Belo Horizonte.
Mukaka, M.M. 2012, 'A guide to appropriate use of correlation coefficient in medical research' , Malawi Medical Journal , vol. 24, no. 3, pp. 69-71.
Nobre, P. & Shukla, J. 1996, 'Variations of sea surface temperature, wind stress, and rainfall over the tropical Atlantic and South America', Journal of Climate , vol. 9, no. 10, pp. 2464-79, DOI:10.1175/1520-0442(1996)009<2464:VOSSTW>2.0.CO;2.
Paulson, C.A. 1970, 'The mathematical representation of wind speed and temperature profiles in the unstable atmospheric surface layer', Journal of Applied Meteorology and Climatology, vol. 9, no. 6, pp. 857-61, DOI:10.1175/1520-0450(1970)009<0857:TMROWS>2.0.CO;2.
Pilotto, I.L., Chou, S.C. & Nobre, P. 2012, 'Seasonal climate hindcasts with Eta Model nested in CPTEC coupled ocean-atmosphere general circulation model' , Theoretical and Applied Climatology , vol. 110, pp. 437-56, DOI:10.1007/s00704-012-0633-y.
Reboita, M.S. & Santos, I. 2015, 'Influência de alguns padrões de teleconexão na precipitação no norte e nordeste do Brasil' , Revista Brasileira de Climatologia , vol. 15, no. 10, pp. 28-48, DOI:10.5380/abclima.v15i0.37686.
Reboita, M.S., da Rocha, R.P., Dias, C.G. & Ynoue, R.Y. 2014, 'Climate projections for South America: RegCM3 driven by HadCM3 and ECHAM5' , Advances in Meteorology, vol. 2014, 376738, DOI: 10.1155/2014/376738.
Rezende, N. & Chou, S.C. 2014, 'Influência das condições do solo na climatologia da previsão sazonal do modelo Eta' , Revista Brasileira de Climatologia , vol. 15, no. 10, pp. 64-79, DOI:10.5380/abclima.v15i0.37366.
Robertson, A.W., Vitart, F. & Camargo, S.J. 2020, 'Subseasonal to seasonal prediction of weather to climate with application to tropical cyclones' , Journal of Geophysical Research: Atmospheres , vol. 125, no. 6, e2018JD029375, DOI:10.1029/2018JD029375.
Rozante, J.R., Moreira, D.S., de Goncalves, L.G.G. & Vila, D.A. 2010, 'Combining TRMM and surface observations of precipitation: Technique and validation over South America' , Weather and Forecasting , vol. 25, no. 3, pp. 885-94, DOI: 10.1175/2010WAF2222325.1.
Saha, S., Moorthi, S., Pan, H.L., Wu, X., Wang, J., Nadiga, S., Tripp, P., Kistler, R., Woollen, J., Behringer, D. & Liu, H. 2010, 'Supplement: Supplement to the NCEP climate forecast system Reanalysis' , Bulletin of the American Meteorological Society , vol. 91, no. 8, pp. ES9-ES25, DOI:10.1175/2010BAMS3001.1.
Saravanan, R. & Chang, P. 2019, 'Midlatitude mesoscale ocean-atmosphere interaction and its relevance to S2S prediction', in A.W. Robertson & F. Vitart (eds) , Sub-seasonal to seasonal prediction, Elsevier, pp. 183-200, DOI:10.1016/B978-0-12-811714-9.00009-7.
Satyamurty, P., Nobre, C. & Silva Dias, P.L. 1998, 'Chapter 3C South America', in D.J. Karoly & D.G. Vincent (eds), Meteorology of the Southern Hemisphere, American Meteorological Society, Boston, pp. 119-39, DOI:10.1007/978-1-935704-10-2_5.
Schwarzkopf, M.D. & Fels, S.B. 1991, 'The simplified exchange method revisited: An accurate, rapid method for computation of infrared cooling rates and fluxes', Geophysical Research: Atmospheres, vol. 96, no. D5, pp. 9075-96, DOI:10.1029/89JD01598.
Seluchi, M.E. & Chou, S.C. 2009, 'Synoptic patterns associated with landslide events in the Serra do Mar, Brazil' , Theoretical and Applied Climatology , vol. 98, pp. 67-77, DOI:10.1007/s00704-008-0101-x.
Seluchi, M.E., Chan Chou, S. & Gramani, M. 2011, 'A case study of a winter heavy rainfall event over the Serra do Mar in Brazil' , Geofísica Internacional , vol. 50, no. 1, pp. 41-56, DOI:10.22201/igeof.00167169p.2011.50.1.121.
Siqueira, V.A., Collischonn, W., Fan, F.M. & Chou, S.C. 2016, 'Ensemble flood forecasting based on operational forecasts of the regional Eta EPS in the Taquari-Antas basin' , Revista Brasileira de Recursos Hídricos , vol. 21, no. 3, pp. 587-602, DOI:10.1590/2318-0331.011616004.
Sobolowski, S., Gong, G. & Ting, M. 2010, 'Modeled climate state and dynamic responses to anomalous North American snow cover' , Journal of Climate , vol. 23, no. 3, pp. 785-99, DOI:10.1175/2009JCLI3219.1.
Thompson, D.W.J., Baldwin, M.P. & Solomon, S. 2005, 'Stratosphere-troposphere coupling in the Southern Hemisphere', Journal of the Atmospheric Sciences, vol. 62, no. 3, pp. 708-15, DOI:10.1175/JAS-3321.1.
Vitart, F. & Robertson, A.W. 2019, 'Introduction: Why sub-seasonal to seasonal prediction (S2S)?', in A.W. Robertson & F. Vitart (eds) , Sub-seasonal to seasonal prediction, Elsevier, pp. 3-15, DOI:10.1016/B978-0-12-811714-9.00001-2.
Vitart, F. 2017, 'Madden-Julian Oscillation prediction and teleconnections in the S2S database' , Quarterly Journal of the Royal Meteorological Society, vol. 143, no. 706, pp. 2210-20, DOI:10.1002/qj.3079.
White, C.J., Carlsen, H., Robertson, A.W., Klein, R.J., Lazo, J.K., Kumar, A., Vitart, F., Coughlan de Perez, E., Ray, A.J., Murray, V. & Bharwani, S. 2017, 'Potential applications of subseasonal‐to‐seasonal (S2S) predictions' , Meteorological Applications , vol. 24, no. 3, pp. 315-25, DOI:10.1002/met.1654.
Wilks, D.S. 2011, Statistical methods in the atmospheric sciences, 2nd edn, vol. 100, Academic press.
WMO - World Meteorological Organization 2013, Subseasonal to seasonal prediction - Research implementation plan, WMO.
Wolter, K. & Timlin, M.S. 1998, 'Measuring the strength of ENSO events: How does 1997/98 rank?' , Weather , vol. 53, no. 9, pp. 315-24, DOI:10.1002/j.1477-8696.1998.tb06408.x.
Wolter, K. & Timlin, M.S. 2011, 'El Niño/Southern Oscillation behaviour since 1871 as diagnosed in an extended multivariate ENSO index (MEI. ext)' , International Journal of Climatology , vol. 31, no. 7, pp. 1074-87, DOI:10.1002/joc.2336.
Wolter, K. 1993, 'Monitoring ENSO in COADS with a seasonally adjusted principal component index', in Proceedings of the 17th Climate Diagnostics Workshop, Norman, 18-23 October, pp. 52-57.
Woolnough, S.J., Vitart, F. & Balmaseda, M.A. 2007, 'The role of the ocean in the Madden-Julian Oscillation: Implications for MJO prediction' , Quarterly Journal of the Royal Meteorological Society, vol. 133, no. 622, pp. 117-28, DOI:10.1002/qj.4.
Zhang, C., Gottschalck, J., Maloney, E.D., Moncrieff, M.W., Vitart, F., Waliser, D.E., Wang, B. & Wheeler, M.C. 2013, 'Cracking the MJO nut' , Geophysical Research Letters , vol. 40, no. 6, pp. 1223-30, DOI:10.1002/grl.50244.
Zhao, Q. & Carr, F.H. 1997, 'A prognostic cloud scheme for operational NWP models' , Monthly Weather Review , vol. 125, no. 8, pp. 1931-53, DOI:10.1175/1520-0493(1997)125<1931:APCSFO>2.0.CO;2.
Funding information
Data availability statement
Author notes
E-mail: malurochasantos@hotmail.comE-mail: nicole.resende@yahoo.com.brE-mail: claudine.dereczynski@igeo.ufrj.brE-mail: fernandavasconcellos@igeo.ufrj.brE-mail: chou.sinchan@gmail.com
Conflict of interest declaration