Artigo
Received: 12 July 2022
Accepted: 14 December 2022
DOI: https://doi.org/10.11137/1982-3908_2023_46_53432
Abstract: Despite the wide dissemination of information access, open data scarcity in fisheries science is still seen as a challenge. Thus, initiatives such as Sea Around Us and Fish Stats stand out. Particularly in developing countries, fishery data collection systems are precarious and there is a lack of national platforms to make fisheries data available. In Brazil, some states such as São Paulo and Santa Catarina have their own data repositories in web platforms, but there are limitations for dynamic queries. In addition, fisheries management based on the “Ecosystem Approach to Fisheries” (EAF) have been discussed and adopted, and environmental variables have been used as indicators to increase the robustness of fishery models. In this sense, the present work proposes a fishery data compilation platform named O mar está para peixes? (Are there fish in the sea?), which contains fishery data and fishery-related satellite remote sensing data (i.e. sea surface temperature, chlorophyll concentration) for the State of Rio de Janeiro, Brazil. The platform is divided in five sections: Fishery, Habitat, Map, Satellite and Download. These sections make data available for dynamic and personalized consultations, with the option of downloading the data. A standard spreadsheet developed for users to submit their own data is presented, with the goal of promoting participation and the collective construction of the platform. This is a new step towards the development of an EAF in Rio de Janeiro, which will potentially open the pathway for the integration of public agencies, research institutions, fishing industry and artisanal fishermen.
Keywords: Collaborative data repository, Web-based platform, Fisheries management.
Resumo: Apesar da ampla disseminação de acesso à informação na ciência pesqueira, a escassez de dados abertos ainda é vista como um desafio. Ao redor do mundo, iniciativas como Sea Around Us e Fish Stats se destacam, entretanto em países em desenvolvimento os sistemas de coleta são precários e há poucas plataformas em escala nacional de disponibilização de dados de pesca. Alguns estados, como São Paulo e Santa Catarina possuem plataformas web próprias, mas ainda com limitação para consultas dinâmicas. Além disso, abordagens de gerenciamento pesqueiro baseadas no “Ecosystem Approach to Fisheries” (EAF) tem sido discutidas e adotadas. Para tal, o conhecimento ecossistêmico é fundamental e variáveis ambientais tem sido usadas como indicadores para modelos pesqueiros mais robustos. Nesse sentido o presente trabalho propõe a plataforma O Mar está para peixes? que engloba a disponibilização de dados de pesca para o Estado do Rio de Janeiro integrado com dados de sensoriamento remoto orbital úteis ao manejo da pesca (e.g. temperatura da superfície do mar e concentração de clorofila). Foram incluídas cinco seções: Pesca, habitat, Mapa, Satélite e Download, onde os dados são disponibilizados para consultas dinâmicas e personalizadas, assim como a opção de obtenção dos dados apresentados. Também foi desenvolvida planilha padrão para submissão de dados pelos usuários, promovendo a participação e a construção coletiva da plataforma. Este trabalho pode ser visto como o primeiro passo para o desenvolvimento de EAF no Rio de Janeiro, além de abrir caminho para integração de agencias públicas, instituições de pesquisa, indústria pesqueira e pescadores artesanais.
Palavras-chave: Banco de dados Colaborativo, Plataforma em rede, Gerenciamento pesqueiro.
1 Introduction
In present times, with technological advances and the growing dissemination of internet access, the availability of information is seen as a standard. However, the lack of information is cited as a challenge in fisheries science (McManamay & Utz 2014), with fishery reports being vague (Watson 2017) and, often, essential information such as accurate catch data is rare or unsatisfactory (Pauly 2007; Freire et al. 2015). The lack of information is even worse for species with no commercial interest, especially in developing countries (Zeller et al. 2016).
Fishery databases are fundamental to determine the stocks’ exploitability status and to predict the consequences of climate change to biodiversity and the marine environment (Watson 2017). Therefore, the lack of data has an enormous negative impact over regulatory agencies, since fishery statistics is needed to guide governmental actions. Mora et al. (2009) showed that only 7% of the Brazilian coastal states apply strict scientific assessment for the generation of fishery management policies. Besides that, fisheries sustainability relies on a transparent and participative process (Mora et al. 2009), where scientific data is combined with law and policy (Davis & Hanich 2022). In addition, open-access databases play an important role in fisheries science, providing essential information to support fishery models, which allows their use in the management of target fishery stocks (McManamay & Utz 2014).
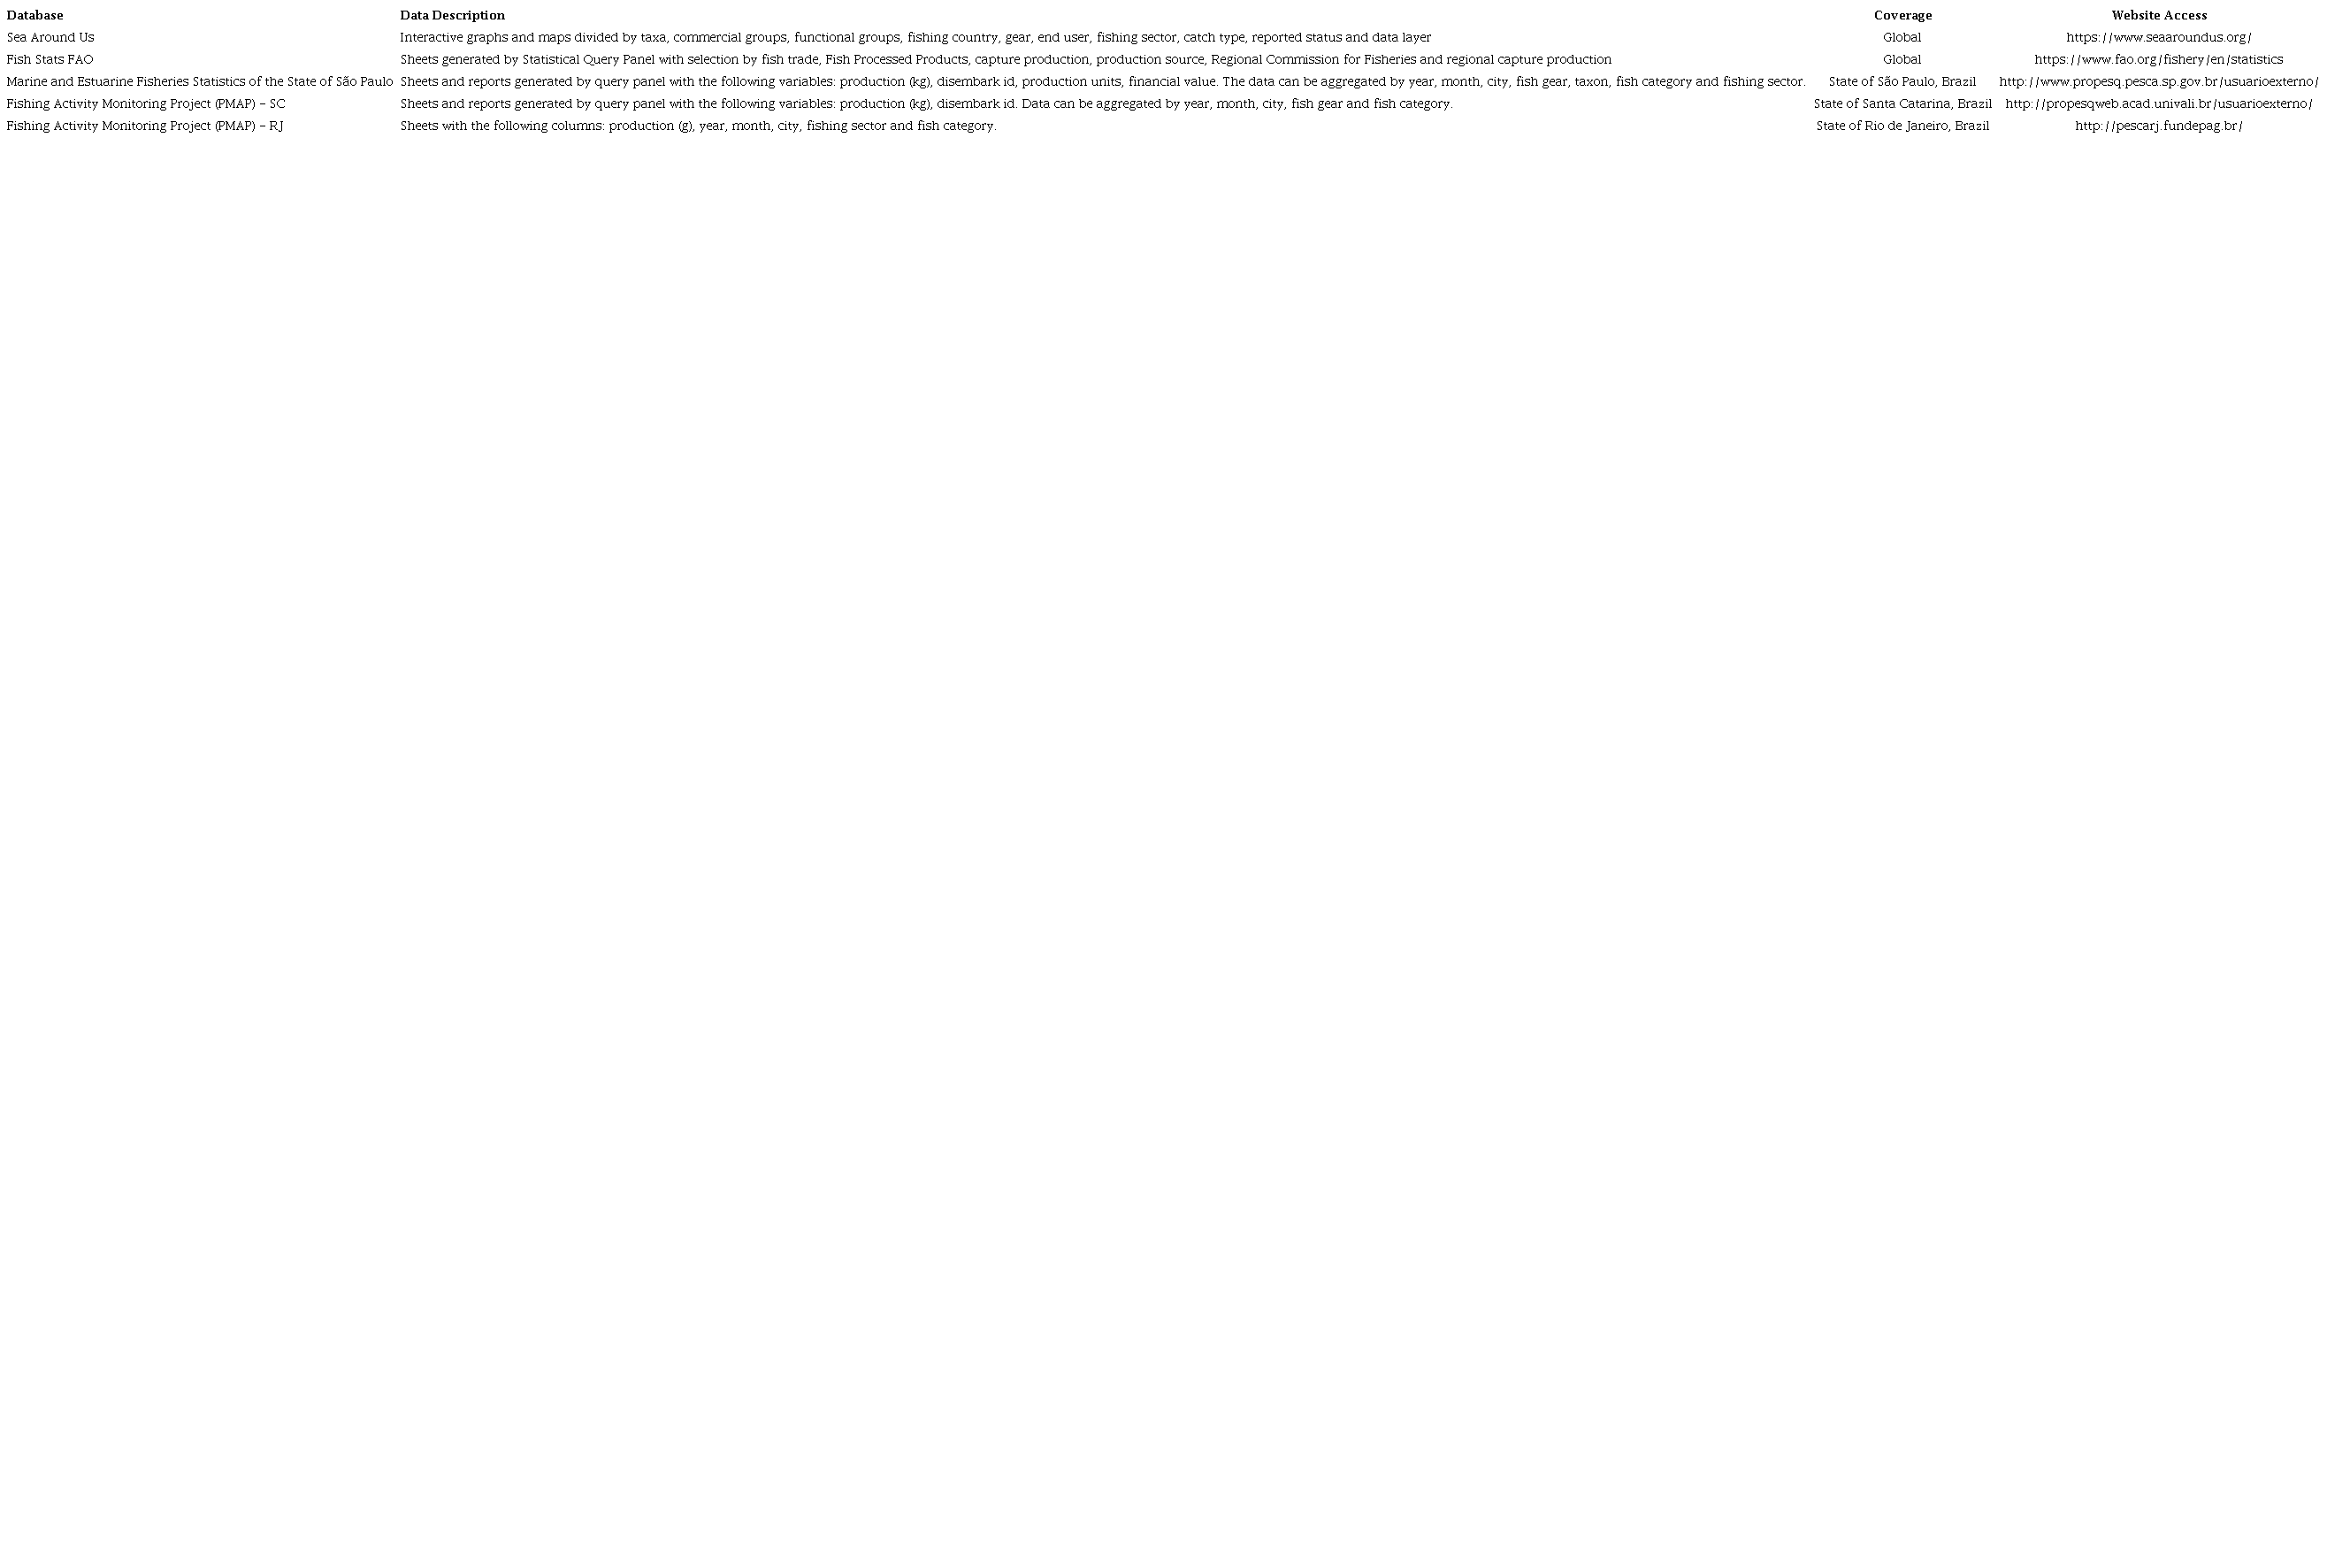
Substantial effort has been made towards the reconstruction and recalculation of total fisheries catch data (Pauly 2007; Freire et al. 2015; Zeller et al. 2016). In addition, there is a recent increase in the number of open-access fishery databases (McManamay & Utz, 2014), with projects such as Sea Around Us and FishStats serving as important references for global fisheries data (Table 1). In addition, the “Ecosystem Approach to Fisheries” (EAF) has been discussed, with further adoption by the Food and Agriculture Organization (FAO) through a consultation held in Reykjavik (Iceland) in 2002. While previous approaches were based on estimates of commercial catch data, the EAF also takes into account the environmental variables and relationships between biological compartments of marine ecosystems, in an attempt to balance human well-being and ecosystem health in order to preserve resources for present and future generations (Garcia et al. 2003; Morishita 2008).
On a national scale in developing and transition countries, the fishery collection system is deficient, leading to data-limited stock assessments. This is the case of Brazil, where the collection catch statistics collapsed and there is no standard system at present (Freire et al. 2015; Dias, Zamboni & Canton, 2022). According to the State of World Fisheries and Aquaculture - FAO (2020) publication of FAO, Brazil has not sent any official fisheries data since 2014. The last national report is dated from 2011 and points out the absence of quality-controlled fisheries statistical data in the country (MPA 2011). Despite the national gaps, some states such as Rio de Janeiro, São Paulo and Santa Catarina have their own fishery surveys, although limited by taxonomic imprecisions where many species are grouped under a same fish category or reported as unidentified. In these states, the project Fishing Activity Monitoring Project - PMAP was carried out between July 2017 and July 2020 and aimed at monitoring fishing landings (FIPERJ 2022; IP/APTA/SAA/SP 2022; UNIVALI/EMCT/LEMA 2022). Furthermore, the study of Freire et al. (2021) compiled and reconstructed annual fisheries catch data in every Brazilian state from 1950 to 2015.
Beyond fishery data, efficient fishery management relies on environmental monitoring (Klemas 2013). Environmental conditions such as water temperature, food availability, and ocean circulation are key to understand the distribution and seasonality of fishery resources. New technologies, such as remote sensing, are being increasingly implemented due to the possibility to collect data on a synoptic scale over time and space (Zagaglia et al. 2004). The correlation between fisheries and environmental variables is key to improve knowledge about the ecosystem dynamics.
In this regard, the objective of of this work is to develop an open-access interactive platform of fishery data for the State of Rio de Janeiro, Brazil, as well as remote sensing satellite data of environmental parameters that are important predictors in the Ecosystems Approach to Fisheries. This work also proposes a standard informational sheet for fishery data to be used in this collaborative platform. The platform is designed to attend governmental, academic, and social needs.
Examples of open-access fishery databases.
2 Methodology
2.1 Study Area
The platform is focused on the area restricted to the coastal ocean of Rio de Janeiro, based on maps published in the Statistical Bulletin of Fisheries of the State of Rio de Janeiro (FIPERJ 2013a) and the Fishing Activity Monitoring Project (PMAP) (Figure 1). Based on the geomorphological and environmental characteristics of the different sections of Rio de Janeiro’s coastal ocean, the Fish Diagnostics of Rio de Janeiro State (FIPERJ 2013a) classifies the coast in three sections: North, Central, and South (Figure 1). We consider this as essential information for geographical comparison, since fishery landing cities are often distant from fishery catch areas.
The North section is limited by the boundary between the States of Rio de Janeiro and Espirito Santo in the North, and extends southward to the City of Arraial do Cabo, where there is substantial change in coastline orientation. The Central section starts in Arraial do Cabo and ends at Itacuruça Island. The South section, also known as the Green Coast for being marked by the proximity between the Mountains and the ocean, extends from Itacuruça Island to the southern limit of the State of Rio de Janeiro (Figure 1). This division is used in the acquisition of satellite data. Satellite variables were extracted from the geographic area of interest, delimited by the following coordinates: -25º N, -20.5 N, -40° E and -45.5° E (Figure 1). The information of section classification is included in the standard fishery data sheet.
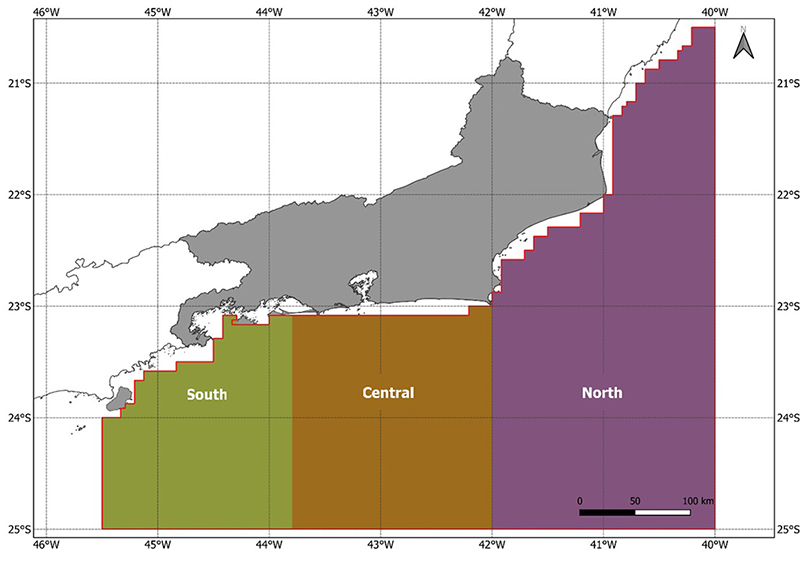
Figure 1
Study area divided in three sections: North, Central and South. The red line surrounds the total area.
2.2. Fishery Data
2.2.1 Data Description
The fisheries database was extracted from four different datasets, which are described below:
-
Fisheries in the State of Rio de Janeiro in 1997 (Jablonski & Moreira 1998), a product provided by the fishery monitoring program of the federal environmental agency IBAMA (IBAMA-SUPES/RJ), in partnership with local and state agencies through the 1990s. This dataset was provided by the Fisheries Institute Foundation of the State of Rio de Janeiro (FIPERJ);
-
Statistical Bulletin of Fisheries of the State of Rio de Janeiro (FIPERJ 2013a), a publication which compiles fish landing datasets of the years 2011 and 2012;
-
Fishing Activity Monitoring Project - PMAP (FIPERJ 2022), a monitoring program imposed by IBAMA to Petrobras as a condition for the Santos Basin exploration licenses. It includes the states of Rio de Janeiro, São Paulo e Santa Catarina. In Rio de Janeiro, it was performed by FIPERJ and the Agribusiness Research Development Foundation - FUNDEPAG
-
Reconstruction from Freire et al. (2021), a product based on the compilation of national official bulletins published in Brazil between 1950 and 2015, assessed in a historical reconstruction analysis.
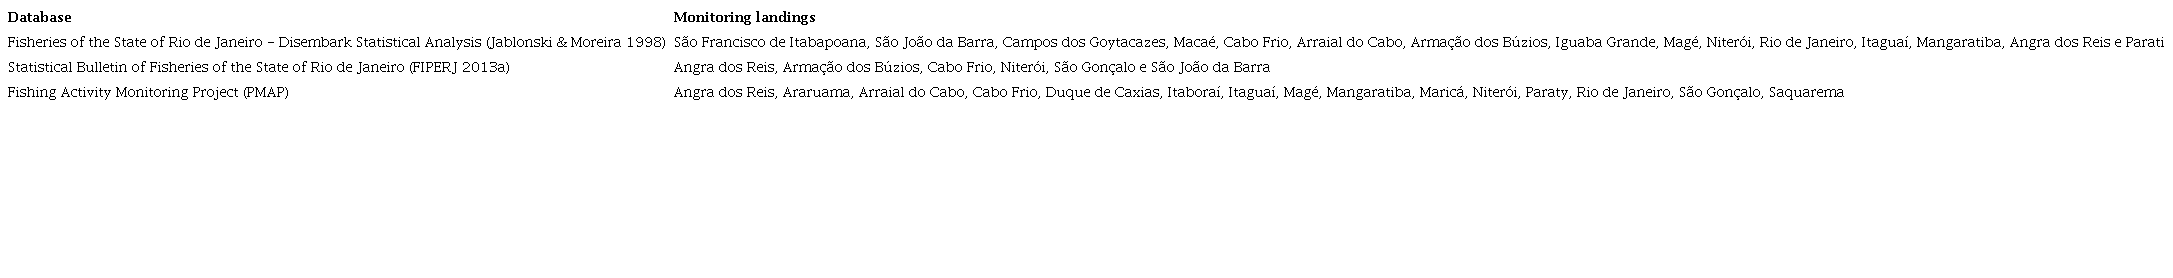
Although the second and third datasets are based on the same data collection methodology, there are differences in the landing data monitored by each study. The Statistical Bulletin of Fisheries of the State of Rio de Janeiro (FIPERJ 2013a) monitored landing points in six cities, while the PMAP (FIPERJ 2022) monitored 15 cities (Table 2), with only four cities in common between them. Nevertheless, it is important to note that the PMAP is focused on the Santos Basin, being limited to the Southern Rio de Janeiro coastal cities up to the city of Cabo Frio (~ 22.85° S).
It is also critical that the time scale of these datasets are different, with the first three databases having monthly resolution while the last is annual. Finally, a data gap is observed between 2013 and 2017.
Fisheries landings cities monitored in Rio de Janeiro.
2.2.2 Data Pre-processing
In addition to substantial methodological differences in the datasets used in this study, some of the data were available in pdf files (FIPERJ 2013a), while other datasets were provided in spreadsheet formats (.xls). To tackle this problem, the first step of the data compilation was to create a standard data sheet containing the target information, as listed in Table 3.
Standard data sheet metadata information and description.
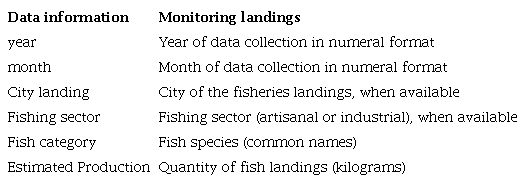
The standard sheet is presented in the Supplementary Material 1. It is worth noting that the sheet is also projected to be used by different stakeholders, such as scientists and fishermen who may provide their data to the plataform, since one of the main objectives of this study is develop a collaborative open access platform. The shared data will be verified and validated before being classified as reliable information to be used by the Academy and public agencies, thus removing observation errors from the lay public source, which is a common problem related to local ecological knowledge (Santos et al. 2022).
2.2.3. Habitat Classification
In order to observe ecological differences in the database, the species were grouped in four different habitat classes: Demersal/ Coastal Benthic, Demersal/ Shelf Benthic, Ocean Pelagic and Shelf Pelagic. This classification based on each species lifestyle and mobility was proposed in the fifth technical report of the PMAP (FIPERJ 2020). We expanded the methodology for uncited species in the report using information available in the Catalog of Fishes (https://researcharchive.calacademy.org/research/ichthyology/catalog/fishcatmain.asp) and the World Register of Marine Species (https://www.marinespecies.org/index.php). The fishery landings in which the species was undetermined was classified as Undetermined. The habitat classification sheet is available in the Supplementary Material 2.
2.3. Satellite Data
The prevalent environmental conditions in different fishery landing periods are described using satellite data (Aqua-MODIS, 4km, monthly composites from 2011 to 2020) of chlorophyll-a concentration and sea surface temperature, acquired using the Giovanni platform (link: https://giovanni.gsfc.nasa.gov/giovanni/) (Monthly product, Time Series - Area-averaged, “sea only”).
2.4. Visualization Platform
After datasets were pre-processed, the data were added to a master dataset using the data visualization software Power BI (Microsoft), where the platform “O mar está pra peixes?” (Are there fish in the sea?) was developed. The platform was divided in five sections: Fishery, Habitat, Map, Satellite, and Downloads, with interactive plots and data visualization figures created in every section. The master dataset was organized as described in Table 3, with information being as detailed as possible, which allowed the application of a fish category filter in all five sections of the platform.
The compiled dataset and associated figures and plots were made publicly available (link https://bit.ly/O_mar_esta_para_peixes). The platform O mar está para peixes? was developed in Portuguese to allow its use by the local community, educators, scientists and stakeholders. The English version is under development and will be available soon.
Since one of the purposes of the platform is the interaction, users are able to submit data in a format thst encourages dynamism and collaborative participation, such as the suggested standardized format (Supplementary Material 1). The choice for the institution responsible for the platform updates is currently being discussed with stakeholders, but FIPERJ is seen as the most capable institution to provide this service.
3 Results
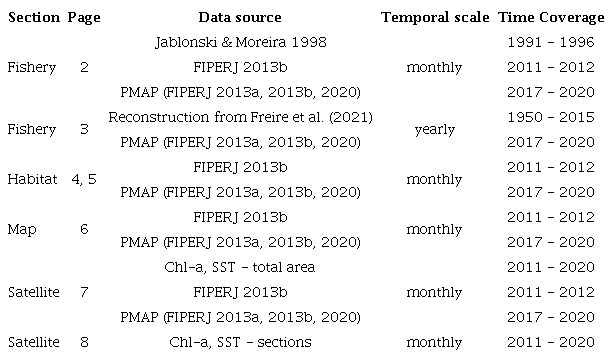
The platform “O mar está para peixes?” is composed of nine pages divided in five sections. The cover page (Figure 2) exposes the five sections as icons, which are clickable and lead the user to specific section pages. All section pages have a house button at the top left corner, which allows the user to return to the cover page. In the section pages, there is a right panel displaying boxes with calculations and filters which can be applied to the data. The sections also have a blue button to remove all the applied filters. Each section uses a different combination of datasets, as shown in Table 4. The sections are described below.
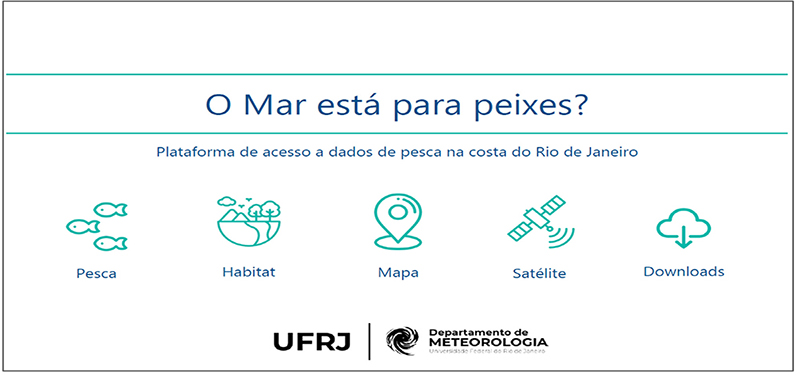
Figure 2
Cover page of the platform with five sections: Fishery, Habitat, Map, Satellite and Downloads. Page 1 of 9 in total.
Data source of each section and page of the O mar está para peixes? platform.
3.1 Fishery
By clicking on the Fishery button, the user is taken to page 1 (of 2) of the Fishery section (Figure 3). Page 1 displays barplots of monthly fishery catch budgets for three different time periods, with data categorized by colors representing the four seasons.
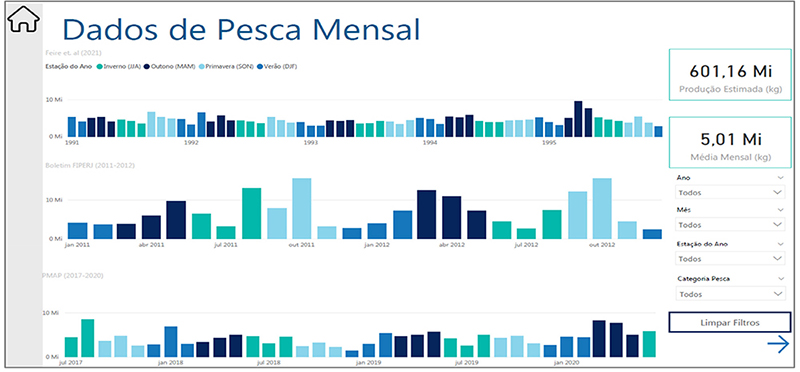
Figure 3
Page 1 (of 2) of the Fishery section, which displays monthly fishery data. Page 2 of 9 in total. Title: Monthly Fishery Data. Green bars represent the Winter, Spring in light blue, Summer in blue and Autumn in dark blue.
Page 2 of the Fishery section presents fishery data on an annual scale (Figure 4). This dataset can be filtered by fishing sector and fishing practise (artisanal or industrial). The top panel presents the estimated annual production and the bottom panel shows data categorized by fishing sector.
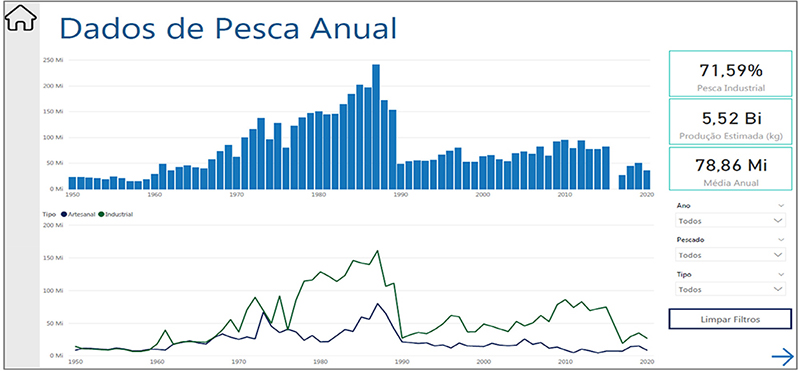
Figure 4
Page 2 (of 2) of the Fishery section, which shows annual fishery data. Page 3 of 9 in total. Title: Monthly Fishery Data. Blue bars represent fishery production (kg). Green line green represents industrial fishery and blue line artisanal.
3.2 Habitat
The Habitat section is divided in two pages. The first page (Figure 5) displays four panels where fishery data are grouped by habitat. The figures display four habitat classes: Coastal demersals/benthic, Shelf demersals/benthic, Oceanic Pelagic, and unknown. Since the fish catch of shelf pelagic species is 10 times higher than that of other habitat classes, this group is displayed in separate figures (lower panels).
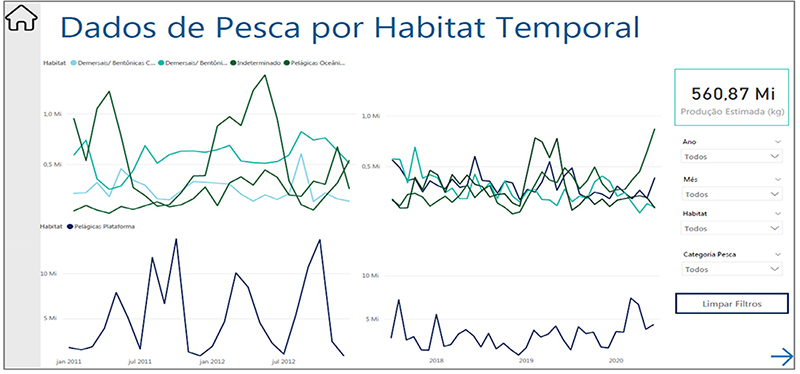
Figure 5
Page 1 (of 2) page of the Habitat section, showing the temporal variation of fishery catch for the periods of 2011 to 2012 and 2017 to 2020. Page 4 of 9 in total. Title: Habitat Classification - Fishery Data Temporal. Dark blue line represents Coastal demersals/benthic, light blue Shelf demersals/benthic, dark green unknown, darker green Oceanic Pelagic and cyano line Shelf Pelagic.
The second page of the Habitat section (Figure 6) displays a hierarchical tree where different data classification criteria can be assessed. This graph is entirely dynamic and interactive, where estimated production can be categorized by season, habitat, and fish category.
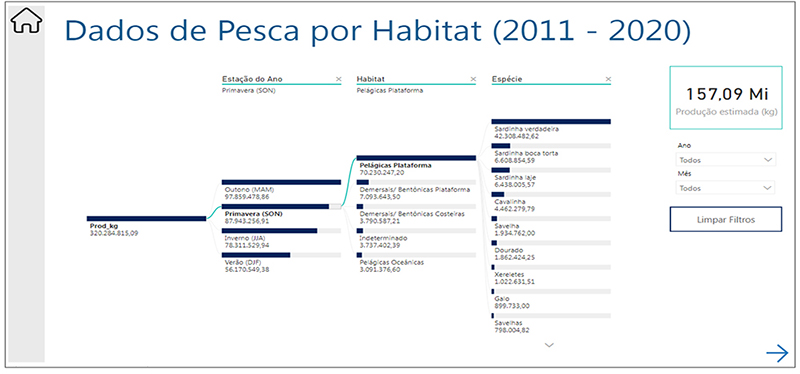
Figure 6
Page 2 (of 2) of the Habitat section, showing different data classification criteria. The page contains data for the periods of 2011 to 2012 and 2017 to 2020. Page 5 of 9 in total. Title: Habitat Classification - Fishery Data (2011 - 2020).
3.3 Map
The Map section presents the production estimated by fishery landing cities. On the left, a figure displays fishery landings in each city. At the center, a map shows the location of these cities, with each city having a different color (Figure 7).
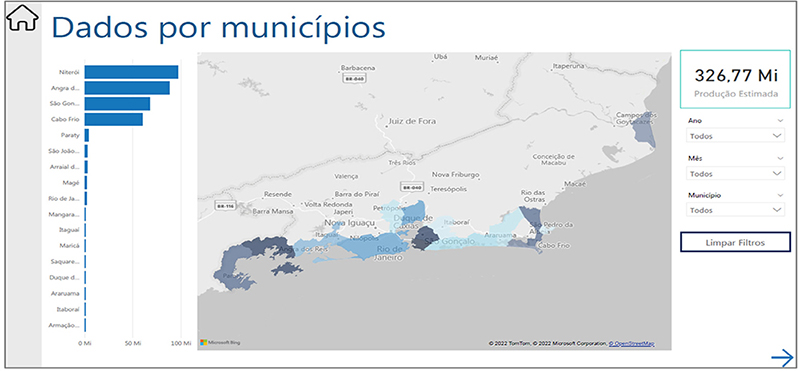
Figure 7
Page 1 (of 1) of the Map section, showing fishery disembark data divided by landing cities. This page contains data for the periods of 2011 to 2012 and 2017 to 2020. Page 6 of 9 in total. Title: Fishery per city.
3.4 Satellite
Satellite data are displayed in two pages. The first page of the Satellite section (Figure 8) displays two figures. The top panel shows Chlorophyll-a Concentration (bars) and Sea Surface Temperature (line) provided by Aqua-MODIS satellite. Satellite data were extracted as a monthly and spatial average of the geographic area described in the Study Area (Figure 1, red line). The bottom panel shows the fishery production in the same period.
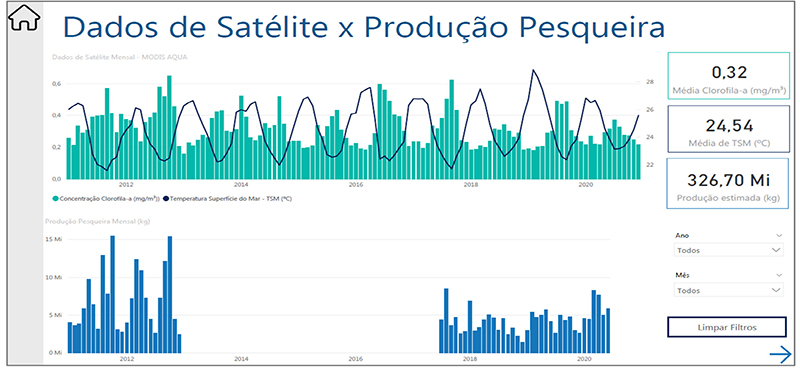
Figure 8
Page 1 (of 2) of the Satellite section, showing Chlorophyll-a Concentration and Sea Surface Temperature for the period between 2011 and 2020. This page shows monthly fishery catch data for comparison purposes. Page 7 of 9 in total. Title: Satellite data x Fishery production.
The second page of the Satellite section (Figure 9) shows three figures with satellite data of three geographic sectors: North (top panel), Central (center panel) and South (bottom panel).
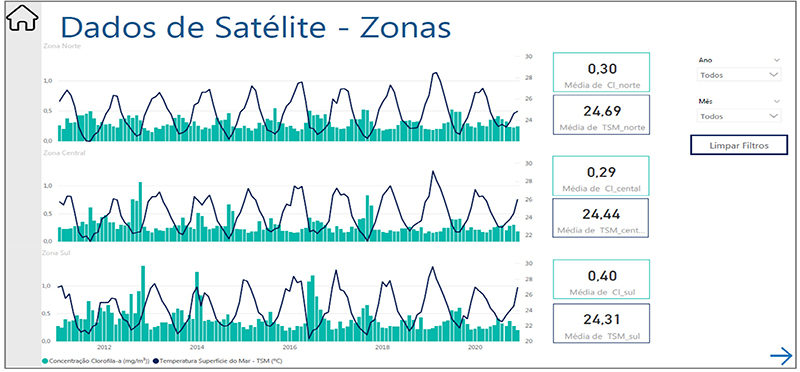
Figure 9
Page 2 (of 2) of the Satellite section, showing Chlorophyll-a Concentration and Sea Surface Temperature for the period between 2011 to 2020 divided by the three geographic sectors: North, Central and South. Page 8 of 9 in total. Title: Satellite data - sections.
3.5 Download
The last page of the O mar está para peixes? platform (Figure 10) displays links to download the raw data files (.xls) used in the platform, organized by Fishery data at the top, and Satellite data at the bottom. Data files can be downloaded by clicking on the hyperlinks.
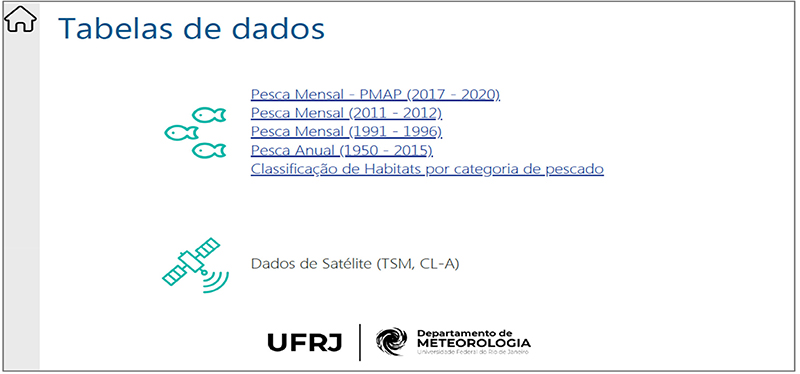
Figure 10
Downloads section, where data used in the platform are available for downloading in spreadsheet formats (.xls). Page 9 of 9 in total. Hiperlink for download data: Monthly Fishery Data - PMAP (2017 - 2020), Monthly Fishery Data (2011-2012), Monthly Fishery Data (1991-1996), Yearly Fishery Data (1950-2015), Habitat Classification for fishery category, Satellite Data (SST, CL-A).
3.6. Relevance of the Platform
Compared to others open-access fishery databases (Table 1), O mar está para peixes? has a similar structure to the platform Sea Around Us (Pauly, Zeller & Palomares 2020). Both platforms are driven by the user interactivity and display online graphs and maps for consultancy and easy data visualization, although Sea Around Us displays more group types and advanced map resources. Sea Around Us also includes information on fishery economics, biodiversity, marine protected areas, aquiculture and marine trophic indexes. However, Sea Around Us displays annual data, not allowing seasonal assessment.
When compared to other Brazilian fishery data platforms, the Marine and Estuarine Fisheries Statistics of the State of São Paulo and the Fishing Activity Monitoring Project (PMAP) - SC allow the selection, grouping and download of raw fishery data, whereas The Fishing Activity Monitoring Project (PMAP) - RJ only allows the download of raw fishery data. None of these platforms allow data visualization, interpretation and classification by habitat, geographic subsections and fishing practice.
O’Boyle et al. (2008), based on the effort to implement the EAF for the Eastern Scotian Shelf (Canada), demonstrated the importance of indicators and reference points that best describe the climatic and oceanographic systems that influence ecosystems that support fisheries and their fleets. Furthermore, the demand for reliable data hinders the development of a proper EAF, but opens a clear path to coordinate efforts from public agencies, research institutes, fishing industry and artisanal fishing communities in order to produce the necessary information and allow an effective fishery management (O’Boyle et al. 2008; Kirkfeldt 2019).
Thus, despite being an advance of fishery management in Rio de Janeiro State, O mar está para peixes? still needs to be submitted to a validation process with the fishery community, to discuss the gaps and improvement points. Mora et al. (2009) point out that fisheries sustainability depends on a transparent and participative process, including integration of scientific data and law and policy (Davis & Hanich 2022).
The effort is aligned with the Ecosystem Approach to Fisheries but also invites the interested parties to discuss what is perceived as a successful management and what the objectives are, increasing their awareness of how fishery management is evolving and leading to a more holistic marine planning, as recommended by Kirkfeldt (2019). This is a fundamental step to allow more ambitious management objectives, as the development of an operational management framework adapted to our regional context (Link et al. 2020). The platform data is intended to be periodically analyzed using local ecosystem models (Townsend et al. 2019), current laws and regulations, allowing the proposal of better practices that integrate the ecosystem approach to the management of the fishing sector (Muawanah et al. 2018).
Another limitation of O mar está para peixes? is the scarce map resources, since geographic data of fishery activities is not available in the dataset used by the platform (the datasets only display fishery landing sites, but not where fishery activities were conducted). On the other hand, there is a variety of other environmental satellite data, with different resolution and parameters, which can be integrated to the platform in the future.
In addition to combining different regional datasets in one repository, the innovation of the O mar está para peixes? platform is the availability of environmental remote sensing satellite data (Chlorophyll-a Concentration and Sea Surface Temperature) and the possibility to compare it with with fishery data. An open-access platform, that is both simple and adaptable, can provide accurate data from official sources and make that available to a wide variety of interested parties, from fishing communities to academics, or from NGOs to consumers. A relevant addition, the possibility to contribute catch data to the platform, will gather and validate data, filling gaps led by the lack of proper monitoring over decades, a feature that is also aimed at by other softwares (Noleto-Filho et al. 2021). In addition, to the authors knowledge, O mar está para peixes? is the first Brazilian open-access fishery database which allows collaborative participation of users.
4 Conclusion
The open-access interactive pilot platform named O mar está para peixes? compiles fisheries data of the State of Rio de Janeiro, Brazil, as well as satellite data of relevant environmental parameters. The platform is available in the link: https://bit.ly/O_mar_esta_para_peixes. A standard data sheet was developed to be used by users for fisheries’ data submission to the platform in the future.
O mar está para peixes? is the first interactive platform for open source fishery dataset in Rio de Janeiro State. The platform also innovates by bringing regional fishery data and environmental satellite data together, allowing the environmental assessment based in an Ecosystem Approach to Fisheries (EAF). Although still unmeasured, the impact of this tool for the local fishery management and science is expected to be significant, since it will facilitate fishery data access and analysis, tackling the difficulty of fishery data mining in the State of Rio de Janeiro.
The O mar está para peixes? Platform will be presented to scientists, fisherman, industry, educators and police makers to improve and adjust the platform, in order to attend the stakeholders’ needs. Besides that, it will be developed a method to improve the platform based on the user’s contribution, allowing the continuity of the platform’s relevance and update activities. This is an important step the development of a multidisciplinary approach in regional fishery management and science in the State of Rio de Janeiro.
5 Acknowledgments
All the data are used available at https://bit.ly/O_mar_esta_para_peixes homepage. We would like to thank the FIPERJ for providing the data from its publication. We also thank Freire et al. (2021) for the effort in the Fisheries catch reconstructions for Brazil’s as well as the availability of it.
References
Davis, R.A. & Hanich, Q. 2022, 'Transparency in fisheries conservation and management measures', Marine Policy, vol. 136, 104088, DOI:10.1016/j.marpol.2020.104088.
Dias, M., Zamboni, A. & Canton, L. 2022, Auditoria da pesca: Brasil 2021: uma avaliação integrada da governança, da situação dos estoques e das pescarias, 2nd edn, Oceana Brasil, Brasília.
FAO - Food and Agriculture Organization of the United Nations 2020, The State of World Fisheries and Aquaculture 2020, Sustainability in Action, Rome, DOI:10.4060/ca9229en.
FIPERJ - Fundação Instituto de Pesca do Estado do Rio de Janeiro 2022, Projeto de Monitoramento da Atividade Pesqueira no Estado do Rio de Janeiro, Estatística Pesqueira do Estado do Rio de Janeiro, On-line Consultancy, viewed 14 April 2022, <FIPERJ - Fundação Instituto de Pesca do Estado do Rio de Janeiro 2022, Projeto de Monitoramento da Atividade Pesqueira no Estado do Rio de Janeiro, Estatística Pesqueira do Estado do Rio de Janeiro, On-line Consultancy, viewed 14 April 2022, http://pescarj.fundepag.br/>.
FIPERJ - Fundação Instituto de Pesca do Estado do Rio de Janeiro 2013a, Boletim Estatístico da Pesca do Estado do Rio de Janeiro - Anos 2011 e 2012, FIPERJ, Niterói, viewed 14 April 2022, <FIPERJ - Fundação Instituto de Pesca do Estado do Rio de Janeiro 2013a, Boletim Estatístico da Pesca do Estado do Rio de Janeiro - Anos 2011 e 2012, FIPERJ, Niterói, viewed 14 April 2022, http://www.fiperj.rj.gov.br/index.php/publicacao/index/1>.
FIPERJ - Fundação Instituto de Pesca do Estado do Rio de Janeiro 2013b, Diagnóstico da Pesca do Estado do Rio de Janeiro, FIPERJ, Niterói , viewed 14 April 2022, <FIPERJ - Fundação Instituto de Pesca do Estado do Rio de Janeiro 2013b, Diagnóstico da Pesca do Estado do Rio de Janeiro, FIPERJ, Niterói , viewed 14 April 2022, http://www.fiperj.rj.gov.br/index.php/publicacao/index/1>.
FIPERJ - Fundação Instituto de Pesca do Estado do Rio de Janeiro 2020, Projeto de Monitoramento da Atividade Pesqueira no Estado do Rio de Janeiro - PMAP-RJ. Relatório Técnico Semestral - RTS - 05 - Maio 2020, FIPERJ, Niterói , viewed 14 April 2022, < Relatório Técnico Semestral - RTS - 05 - Maio 2020, FIPERJ, Niterói , viewed 14 April 2022, http://www.fiperj.rj.gov.br/index.php/publicacao/index/1>.
Freire, K.M.F., Almeida, Z.S., Amador, J.R.E.T., Aragão, J.A., Araújo, A.R.R., Ávila-da-Silva, A.O., Bentes, B., Carneiro, M.H., Chiquieri, J., Fernandes, C.A.F., Figueiredo, M.B., Hostim-Silva, M.N., Jimenez, É.A., Keunecke, K.A., Lopes, P.F.M., Mendonça, J.T., Musiello-Fernandes, J., Olavo, G., Primitivo, C., Rotundo, M.M., Santana, R.F., Sant’Ana, R., Scheidt, G., Silva, L.M.A., Trindade-Santos, I., Velasco, G. & Vianna, M. 2021, 'Reconstruction of Marine Commercial Landings for the Brazilian Industrial and Artisanal Fisheries From 1950 to 2015', Frontiers in Marine Science, vol. 8, 659110, DOI:10.3389/fmars.2021.659110.
Freire, K.M.F., Aragão, J.A.N., Araújo, A.R.R., Ávila-da-Silva, A.O., Bispo, M.C.S., Velasco, G., Carneiro, M.H., Gonçalves, F.D.S., Keunecke, K.A., Mendonça, J.T., Moro, P.S., Motta, F.S., Olavo, G., Pezzuto, P.R., Santana, R.F., Santos, R.A., Trindade-Santos, I., Vasconcelos, J.A., Vianna, M. & Divovich, E., 2015, 'Reconstruction of catch statistics for Brazilian marine waters (1950-2010)', in K.M.F. Freire & D. Pauly (eds), Fisheries catch reconstructions for Brazil’s mainland and oceanic islands, Fisheries Centre, University of British Columbia, Columbia, pp. 3-30.
Garcia, S.M., Zerbi, A., Aliaume, C., Do Chi, T. & Lasserre, G. 2003, The ecosystem approach to fisheries: Issues, terminology, principles, institutional foundations, implementation and outlook, FAO Fisheries Technical Paper 443, FAO, Rome.
IP/APTA/SAA/SP - Instituto de Pesca (IP)/ Agência Paulista de Tecnologia dos Agronegócios (APTA)/ Secretaria de Agricultura e Abastecimento do Estado de São Paulo (SAA/SP) 2022, Programa de Monitoramento da Atividade Pesqueira Marinha e Estuarina do Estado de São Paulo, viewed 14 April 2022, <IP/APTA/SAA/SP - Instituto de Pesca (IP)/ Agência Paulista de Tecnologia dos Agronegócios (APTA)/ Secretaria de Agricultura e Abastecimento do Estado de São Paulo (SAA/SP) 2022, Programa de Monitoramento da Atividade Pesqueira Marinha e Estuarina do Estado de São Paulo, viewed 14 April 2022, http://www.propesq.pesca.sp.gov.br/>.
Jablonski, S. & Moreira, L.H.A. 1998, A pesca no Estado do Rio de Janeiro em 1997: análise das estatísticas de desembarque, Fundação Instituto de Pesca do Estado do Rio de Janeiro, Rio de Janeiro.
Kirkfeldt, T.S. 2019, 'An ocean of concepts: why choosing between ecosystem-based management, ecosystem-based approach and ecosystem approach makes a difference', Marine Policy , vol. 106, 103541, DOI:10.1016/j.marpol.2019.103541.
Klemas, V. 2013, 'Fisheries applications of remote sensing: an overview', Fisheries Research, vol. 148, pp. 124-36, DOI:10.1016/j.fishres.2012.02.027.
Link, J.S., Huse, G., Gaichas, S. & Marshak, A.R. 2020, 'Changing how we approach fisheries: A first attempt at an operational framework for ecosystem approaches to fisheries management', Fish and Fisheries, vol. 21, no. 2, pp. 393-434, DOI:10.1111/faf.12438.
McManamay, R.A. & Utz, R.M. 2014, 'Open-access databases as unprecedented resources and drivers of cultural change in fisheries science', Fisheries, vol. 39, no. 9, pp. 417-25, DOI:10.1080/03632415.2014.946128.
Mora, C., Myers, R.A., Coll, M., Libralato, S., Pitcher, T.J., Sumaila, R.U., Zeller, D., Watson, R., Gaston, K.J. & Worm, B. 2009, 'Management effectiveness of the World’s marine fisheries', PLoS Biology, vol. 7, no. 6, e1000131, DOI:10.1371/journal.pbio.1000131.
Morishita, J. 2008, 'What is the ecosystem approach for fisheries management?', Marine Policy , vol. 32, no. 1, pp. 19-26, DOI:10.1016/j.marpol.2007.04.004.
MPA - Ministério da Pesca e Aquicultura 2011, Boletim estatístico da pesca e aquicultura, Ministério da Pesca e Aquicultura, Brasília.
Muawanah, U., Yusuf, G., Adrianto, L., Kalther, J., Pomeroy, R., Abdullah, H. & Ruchimat, T. 2018, 'Review of national laws and regulation in Indonesia in relation to an ecosystem approach to fisheries management', Marine Policy , vol. 91, pp. 150-60, DOI:10.1016/j.marpol.2018.01.027.
Noleto -Filho, E.M. Angelini, R. Steenbeek, J. & Carvalho, A.R. 2021, 'New, flexible and open-source fisheries self-reporting app: The Shiny4SelfReport', SoftwareX, vol. 16, 100843, DOI:10.1016/j.softx.2021.100843.
O’Boyle, R., Sinclair, M. & Worcester, T. 2008, 'Chapter 7: Research requirements of an ecosystem approach to fisheries', in H.R. Skjoldal & G. Bianchi (eds), The ecosystem approach to fisheries, CAB International/FAO, Rome, pp. 95-111.
Pauly, D. 2007, 'The sea around us project: documenting and communicating global fisheries impacts on marine ecosystems', Journal of the Human Environment, vol. 36, no. 4, pp. 290-5, DOI:10.1579/0044-7447(2007)36290:TSAUPD2.0.CO;2.
Pauly, D., Zeller, D. & Palomares, M.L.D. (eds) 2020, Sea Around Us concepts, design and data, viewed 14 April 2022, < (eds) 2020, Sea Around Us concepts, design and data, viewed 14 April 2022, https://www.seaaroundus.org>.
Santos, S.R., Macedo, M.L.C., Maciel, T.R., Souza, G.B.G, Almeida, L.S., Gadig, O.B.F. & Vianna, M. 2022, 'A tale that never loses in the telling: Considerations for the shifting ethnobaseline based on artisanal fisher records from the southwestern', Ethnobiology and Conservation, vol. 11, no. 3, DOI:10.15451/ec2022-01-11.03-1-20.
Townsend, H., Harvey, C.J., deReynier, Y., Davis, D., Zador, S.G., Gaichas, S., Weijerman, M., Hazen, E.L. & Kaplan, I.C. 2019, 'Progress on implementing ecosystem-based fisheries management in the United States through the use of ecosystem models and analysis', Frontiers in Marine Science, vol. 6, 641, DOI:10.3389/fmars.2019.00641.
UNIVALI/EMCT/LEMA - Laboratório de Estudos Marinhos Aplicados (LEMA)/ Escola do Mar, Ciência e Tecnologia (EMCT)/ Universidade do Vale do Itajaí (UNIVALI) 2022, Projeto de Monitoramento da Atividade Pesqueira do Estado de Santa Catarina, Estatística Pesqueira de Santa Catarina, On-line Consultancy, viewed 14 April 2022, <UNIVALI/EMCT/LEMA - Laboratório de Estudos Marinhos Aplicados (LEMA)/ Escola do Mar, Ciência e Tecnologia (EMCT)/ Universidade do Vale do Itajaí (UNIVALI) 2022, Projeto de Monitoramento da Atividade Pesqueira do Estado de Santa Catarina, Estatística Pesqueira de Santa Catarina, On-line Consultancy, viewed 14 April 2022, http://pmap-sc.acad.univali.br/>.
Watson, R.A. 2017, 'A database of global marine commercial, small-scale, illegal and unreported fisheries catch 1950-2014', Nature Scientific Data, vol. 4, 170039, DOI: 10.1038/sdata.2017.39.
Zagaglia, C.R., Lorenzzetti, J.A. & Stech, J.L. 2004, 'Remote sensing data and longline catches of yellowfin tuna (Thunnus albacares) in the equatorial Atlantic', Remote Sensing of Environment, vol. 93, no. 1-2, pp. 267-81, DOI:10.1016/j.rse.2004.07.015.
Zeller, D., Palomare, M.L.D., Tavakolie, A., Ang, M., Belhabib, D., Cheung, W.W.L., Lam, V.W.Y., Sy, E., Tsui, G., Zylich, K. & Pauly, D., 2016, 'Still catching attention: Sea Around Us reconstructed global catch data, their spatial expression and public accessibility', Marine Policy , vol. 70, pp. 145-52. DOI:10.1016/j.marpol.2016.04.046.
Funding information
Data availability statement
Author notes
E-mail: dianaroccoalbernaz@gmail.comE-mail: lino.sander@gmail.comE-mail: priscilalange@igeo.ufrj.brE-mail: srbs.ufrj@gmail.com
Conflict of interest declaration
