An assessment of development level of villages in Lorestan province using numerical taxonomy method
Evaluación del nivel de desarrollo de las aldeas en la provincia de Lorestan utilizando el método de taxonomía numérica
 Maryam Hasanvandian m.hassanvandiyan86@yahoo.com
Alireza Poursaeed a_poursaeed@yahoo.com
Roya Eshraghi Samani r_eshraghi@yahoo.com
Hamed Chaharsoughi Amin h_chaharsoughi@outlook.com
Maryam Hasanvandian m.hassanvandiyan86@yahoo.com
Alireza Poursaeed a_poursaeed@yahoo.com
Roya Eshraghi Samani r_eshraghi@yahoo.com
Hamed Chaharsoughi Amin h_chaharsoughi@outlook.com
An assessment of development level of villages in Lorestan province using numerical taxonomy method
Revista INGENIERÍA UC, vol. 27, núm. 3, pp. 353-366, 2020
Universidad de Carabobo
Recepción: 08 Septiembre 2020
Aprobación: 19 Noviembre 2020
Abstract: - In today’s society, achieving development and reducing regional inequalities is one of the most important challenges facing governments. The role and position of villages in the process of economic, social and political development on a local, regional and national scale and the consequences of underdevelopment of rural areas such as widespread poverty, growing inequality, rapid population growth, unemployment, migration, and urban marginalization has attracted attention to rural development, and many experts believe that the cause of urban problems in developing countries is underdevelopment of rural areas. In the current research, in order to determine the degree of development of villages in Lorestan province, various economic, social and cultural sectors were considered and their ranking based on the development level using numerical taxonomic analysis method has been done. To do this, we using the latest statistics and information related to 2016, and 101 variables in the form of 8 indicators (educational, demographic, infrastructure, economical, health, service, cultural, welfare and agricultural performance) have been evaluated. According to our results, it was observed that the distribution of facilities and services in the villages of Lorestan province is unbalanced, as out of 87 villages of Lorestan province, four villages were identified as heterogeneous areas and Bazvand village has a development coefficient of 0,765 as a most provided village in this province. The rest of the villages in Lorestan province are being deprived as semi-provided and deprived villages. In conclusion, it has been said that most of the villages in this province need proper management and planning to develop and increase facilities and services.
Keywords: Lorestan Province, numerical taxonomy, development indicators.
Resumen: - En la sociedad actual, lograr el desarrollo y reducir las desigualdades regionales es uno de los desafíos más importantes que enfrentan los gobiernos. El papel y la posición de las aldeas en el proceso de desarrollo económico, social y político a escala local, regional y nacional y las consecuencias del subdesarrollo de las zonas rurales, como la pobreza generalizada, la creciente desigualdad, el rápido crecimiento de la población, el desempleo, la migración y la marginación ha atraído la atención sobre el desarrollo rural, y muchos expertos creen que la causa de los problemas urbanos en los países en desarrollo es el subdesarrollo de las zonas rurales. En la presente investigación, se determinó el grado de desarrollo de las provincias de Lorestan, considerando sectores económicos, sociales y culturales y se realizó su clasificación en función del nivel de desarrollo mediante el método de análisis taxonómico numérico. Para ello, utilizamos las últimas estadísticas e información relacionada con 2016, y se han evaluado 101 variables en forma de 8 indicadores (educativo, demográfico, infraestructura, económico, salud, servicios, cultural, bienestar y desempeño agrícola). Se observó que la distribución de instalaciones y servicios en las aldeas de la provincia de Lorestan está desequilibrada, ya que de 87 aldeas de la provincia cuatro fueron identificadas como áreas heterogéneas y la aldea de Bazvand tiene un coeficiente de desarrollo de num 0,765 como pueblo más provisto en esta provincia. El resto de las aldeas de la provincia de Lorestan están siendo identificadas como aldeas semi-provistas y desfavorecidas. En conclusión, la mayoría de las aldeas de esta provincia necesitan una gestión y planificación adecuadas para desarrollar y aumentar las instalaciones y los servicios.
Palabras clave: Provincia de Lorestan, taxonomía numérica, indicadores de desarrollo.
1. Introduction
Today, rapid growth of the urban population in the last few decades, is one of the most important aspects of global change [1], and the lack of financial, technical, and infrastructure facilities to create public and social uses of the city has created a heterogeneity and imbalance in the distribution of various facilities in the city. Also, rapid population growth has provided the prelude to extensive urban growth and development, and has brought about extensive changes from local to global scales in land use [2], as it can be said, the population of cities has increased, but the services that supply their different needs are not suitable for the citizens [3]. According to the UN program in recent years, the main issues of human development have been various. In this regard, among the key axes in drawing and achieving human development, we can mention the following: emphasis on financing and human development, the effects of global dimensions of human development and people’s participation, human security, gender and human development, economic growth, human rights, etc [4]. Promoting human development depends on the capacity to acquire knowledge, access to the material possibilities of life, and enjoy a long and healthy life [5], and education and health centers also create social benefits, which is one of the factors influencing the human development index [6].
Hereof, inequality and its various dimensions are important signs of underdevelopment because regional inequalities in all their forms and levels can have dire consequences [7]. At the regional level, creating a logical balanced among people, employment and services is one of the most desirable ideals, and in recent years many governments and decision-makers have been trying to reduce the severity of regional inequalities [8]. Therefore, achieving the development and decrease of regional inequalities is one of the most important challenges for governments in today’s society. The history of development is very vast and dates back to the time of natural and social changes on the planet. From a natural view point, the history of development coincides with the evolution of geology and from a social view point is equal to the emergence of primitive human societies [9]. The prevalence of today’s concept of development that is mostly relative, dates back to the 1960s, and before that, concepts such as reclamation (colonization), reform, development, improvement, promotion, and ultimately growth over the past years were discussed.
On the other hand, with the expansion of urbanization and the rapid growth of industry and technology in the world, the backwardness of rural areas of the world became more than ever visible, because villagers had lower incomes than urban dwellers and had little social, welfare, and educational services, hence they contributed little to growth and development [10]. The reasons for this were: the geographical dispersal of the villages, the lack of economic efficiency to provide social, professional and specialized services, the lack of agricultural job (lack of productivity), limited land resources (as opposed to population growth), and lack of proper management of managers.
The foundation for all the problems of backwardness in rural areas were found to be a widespread poverty, growing inequality, rapid population growth and growing unemployment [11]. For this reason, rural development was born to alleviate the extreme poverty of rural areas, improve the living standards and rural life quality, create employment and increase their productivity. Rural development is a multidimensional concept with different economic, social, and cultural dimensions, and one of these dimensions, due to their influence on the rural environment, is of great significance, which has caused the rural sector to always be considered [12].
1.1. Background and theoretical foundations of research
Literature reviews showed that there have been done many studies on the development and leveling techniques that can be mentioned below:
In [13], the authors try to use the indicators selected by the defined objectives, the TOPSIS and VIKOR methods to study sustainable development. The results may be advised to choose the appropriate method to be used in similar studies. Amanpour [14] in a study titled Regional Analysis and Rural Development Assessment acknowledged that in the planning process, in order to achieve sustainable development and maintain it, all the necessary conditions of human societies and their needs must be considered. In this regard, despite Extensive studies have been conducted in Iran before, but not all aspects of development, especially rural development indicators, have been considered.
Dev [15] in his paper on the study of inequalities using the geographical distribution of income, examines spatial inequalities using geographic data, the findings show that the level of inequality between white and black neighborhoods is very acute.
Piketty & Saze [16], in a study on long-term inequality, explores and provides basic facts about the long-term evolution of income and wealth inequalities in Europe and the United States. It has been from Europe and now there is more inequality in America than in Europe. They acknowledge that it is possible for us to discuss this, but it is a lesson for the future.
Oliveira [17] in a study titled “A multivariate methodology to uncover regional disparities: A contribution to improve European Union and governmental decisions” using factor analysis to identify regional inequalities in 1991 and 1995 in Portugal. Lesher [18] in a research entitled “Analysis of the economics of investment provisions in regional trade agreements” have ranked developed and developing countries and classified them into different categories.
Molnar [19] by conducting a study titled “Factor influencing development level of settlements in South-Transdanubia”, development level of the settlements of this region in terms of 17 socio-economic and infrastructural social indicators for the years 2000 to 2004 has been determined using the combined development index method. Al-Hassan [20] studied on regional disparities in Ghana during 1990 to to 2000. The results showedthat economic growth during the period led to areduction in general poverty in Ghana, but sincethis growth was mainly due to agricultural exports,gap between the development of the northernregions and the southern regions has widened,because they have not been able to compete in agriculture.
Rosentstein [21] investigated cultural development and city neighborhoods. The results of this study demonstrate four characteristics of cultural development policy and argue the impact of these characteristics on cultural development and cultural life of neighborhoods. Jakub and Marcela [22] in a study titled “Factors affecting development of rural Areas in the Czech Republic: a literature review”, to detect effective indicators, 14 most frequently used indicators were identified based on the comprehensive analysis of the chosen Czech studies.
Summarizing the research conducted in Iran and outside the country shows that researchers have used different techniques and methods to measure development degree of regions and recognize and analyze inequalities and regional differences, and each of these methods has its advantages and disadvantages. Among the methods of measuring the level of development, multi-attribute decision-making (MADM) techniques have more application and generality. Therefore, the current research aims to investigate the inequalities between the villages of Lorestan province in terms of the level of development indicators using numerical taxonomic technique.
Nowadays, the issue of development is a concern for many countries, but there is no an equal definition for the development of which there is a universal agreement. Development is considered as a fundamental change in economic, social, and cultural variables in any society, and its realization requires the creation of harmony among its various dimensions. In general, development is a comprehensive process of economic, social, cultural and political activities that aim to continuously improve the lives of the population and its activities, freedom, participation and fair distribution of interests are among its basic bases [23]. In this regard, Charles Kindle Berger says: "In general, the term development implies a change in how production is done, as well as a revision in the allocation of resources and labor to different sectors of production". But Miradell believes that development as the movement of a one-handed social system forward. Hodder [24] believes that given that the main goal of development is to eliminate all social inequalities, the most appropriate concept for development is growth along with social justice.
1.2. The importance and necessity of research
Basically, rural areas, as a rule of the settlement system and national activity, play an important role in national development, because the sustainable development of the land depends on the stability of the rural system as a subset of the land system, and the sustainability of rural spaces in different dimensions can play an effective function in regional and national development. Unfortunately, the evidence and experience show that the right and duty to develop rural communities and spaces, in proportion to its share, position and function in the national economy, has been ignored and rural areas in completely unequal situation to access opportunities and benefits from growth. Thereto, adjusting the socio-economic and territorial imbalances in order to develop rural communities and facilitate the growth and development of these communities is an essential and inevitable necessity [25]. The development of a rural area should be designed within the general framework of national policies [26]. Rural development is a dynamic process, dealing mainly with rural areas, and includes a number of factors, including agricultural growth, economic and social infrastructure, fair wages for housing and housing for landless people, rural planning, general health, education and literacy, communication, etc. Achieving development depends on various factors and conditions that should be put together to reach development aims. Experience of development in third world countries (i.e., countries mostly in Asia and Africa), at least in the rural sector, shows that the attitude towards development and the role of indigenous culture and the methods and strategies adopted play a key role in the success or failure of development programs [27]. Today, rural development is one of the most important purposes in national development, because without rural development, development at higher levels will not be feasible. Unfortunately, although villages have been considered the country’s production hub, but they neglected in planning. Therefore, its effects in recent years have been in the form of declining rural populations, rural poverty, lack of employment opportunities in rural areas, lack of facilities and services in rural areas and widespread rural-urban migration and population growth and uncontrollable expansion of large cities [28].
Hence, this study aims to show the provide level of rural areas in Lorestan province in various sectors included economic, social, agricultural, educational, etc., and then show the lacks and shortcomings in the development path, which sometimes lead to environmental instability. To do this, solving the problems caused by regional imbalances is the first step in recognizing and classifying villages in terms of provide level in different aspects such as economic, infrastructure and communication, socio-cultural, health, educational and other aspects with numerical taxonomic method. This method can be an excellent strategy for planners to focus more on development indicators in future programs. Therefore, it is necessary to identify deprived areas and comprehensive development studies to moderate regional inequalities in the Lorestan province and in each village.
2. Research method
Multi-attribute decision-making techniques are a good tool for ranking in a set of available indicators due to their multidimensional and often contradictory characteristics [29]. The use of quantitative methods to measure the development of regions not only reveals the differences between regions based on different variables, but can also be identified by knowing these heterogeneities at the regional level and having comprehensive and useful information about facilities, limitations and inequality. By allocating resources to less developed areas, they have paved the way for inequality adjustment. Numerical taxonomy is one of these methods.
2.1. Numerical taxonomy method
A numerical taxonomic method was first proposed in 1763. This method was proposed in 1968 as a tool for classifying the degree of development of different nations by Professor Sigmund Hulling in UNESCO. This method is able to divide a set into more or less homogeneous subsets and provide a scale that is used in planning to understand development degree. Also, by combining a number of indicators related to the criterion under evaluation, prioritize the studied options. Nevertheless, despite its positive features and its great application in regional studies, this method faces limitations such as that it is similar to the correlated indicators and also considers the same degree of importance for all indicators [30]. Numerical taxonomy method has the following advantages in compare to other methods: 1) divides the survey set into homogeneous subsets based on the specified indicators, and 2) grading of elements and components of each homogeneous subset [31]. Taxonomic analysis is based on the analysis of some predetermined indicators used in prioritizing options and shows a complete degree of evaluation.
Numerical taxonomy method has the following steps:
1.The initial information matrix table should be formed based on the indicators used, thus the names of the study areas in a column and the values of the indicators used in the opposite columns should be placed.
After preparing the data matrix, due tothe fact that different indicators may havedifferent scales, it is necessary to abandon theindicators used in the scales and eliminate theheterogeneity of the indicators. To do this, thestandardization method can be used, whichby converting the main indicators to standardindicators, the average of all indicators will beequal to zero and their standard deviation willbe equal to one. The equations (1),(2) and (3) should be used to calculate the standard matrix:
where z: standardized values, xi j : the amount of change i in region j , xi : average variable i, and Si: Standard deviation of variable i. After standardizing the indicators used according to equation (1), a standardized table is obtained.
3.Calculate the distances between sections: After calculating the standard matrix, it is possible to obtain the difference between the distances of each section from the other sections for each of the indicators. To do this, we first subtract the first value of the first column from the first value of the first column, then subtract the first value of the first column from the value of the fourth row of the first column, and conduct these steps to the end for all columns.
4.Calculate the distance of each section from the other section based on the indicators used: To do this, we bring the obtained numbers to the power of two, we add them horizontally, and then we get their square root. This matrix is symmetric and its diameter is equal to zero, and each element represents the distance or difference between the two sections, which are showed in rows and columns. The minimum value in each row indicates the shortest distance.
5.Draw a figure: In this step, obtain the second shortest distance and, if necessary, the third shortest distance, so that all the sections are on the same graph.
6.Identify homogeneous sections: To achieve homogeneous sections, the upper and lower limits should be taken for the shortest distances. To do this step, we used the equation (4) [32, 33]:
where: D± = upper and lower limit, Sd = standard deviation, d = average of the shortest distance which is obtained by the equations (5) and (6):
The sections that are within the upper and lower limits are part of the homogeneous sections that can be drawn in a figure, and the upper and lower sections should be classified in the form of other homogeneous groups.
7.Calculate the compound distance of each region from the ideal region: At this step, sections or areas can be graded within each homogeneous group. For this, we should re-create the standard matrix for each of the homogeneous groups, and the largest number in each of the columns of the standard matrix being chosen as the ideal value. It should be denoted that if negative indicators are selected, the smallest number should be selected as the ideal value. It then calculated the compound distance of each section of the ideal section through the equation (7) and displayed it with the cio, which in fact represents the distance from section I to the ideal section o. The smaller value of cio indicate the more developmental of section [32, 33]. In other words, the distance of the desired section of io will be less, and on the contrary, the large value of the cio indicates the underdevelopment of the section.
where: cio = compound distance of each section of the ideal section, zi = values in the standard matrix, and zo = the ideal value of each column is in the above mentioned matrix.
8.Calculate the level of development of section: at this step, the relative development level of each sector can be calculated, and then arranged the sections according to the development level and their proximity or distance from the ideal section [32, 33].
3. Information and indicators
3.1. Information
Lorestan province is one of the western provinces of Iran. The province has an area of 28.308 square kilometers and a population of more than 1.760.000. This province is a mountainous land and, except for a few limited plains, it is covered by the Zagros Mountains. According to national divisions, Lorestan province has 11 cities, 29 districts and 87 villages. The cities in this province are Khorramabad, Borujerd, Dorud, Aligudarz, Kuhdasht, Azna, Selseleh(Aleshtar), Dowreh, delfan(noorabad), romeshgan and Pol-e Dokhtar. The importance of this province is due to its numerous natural resources and mines. The location of this province and its cities in the geographical map of Iran is shown in Figure 1.
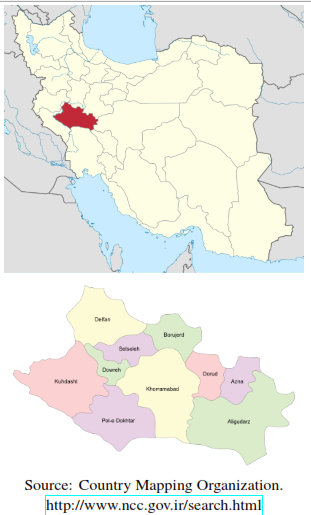
Figure 1
Location of the study area
Source: Country Mapping Organization. http://www.ncc.gov.ir/search.html
In this study, the desired indicators were selected to rank and determine the level of development of the villages of Lorestan province, and then the numerical taxonomic method was used. Therefore, in current study, sampling method was accorded to the available data, and all data were used. In this section, indicators for ranking the villages of Lorestan province are presented. Numerous and various indicators for measuring rural development have been introduced in research, programs and rural development projects in the country so far.
The nature and composition of the indicators used vary according to the objectives of the research, the approach used, the data available, and the research scope. For instance, in a research project to develop rural development indicators inIran, which was commissioned by the Sustainable Rural Development Subcommittee in 2007, these indicators are in the form of 3 environmental, social, and economical systems and 6 dimensions and in the form of 14 components and 32 criteria were used, and then introduce 217 indicatorsfor measuring rural development in the country[25]. Scientists and various organizations have also used different indicators to estimate the extent of regional development. For example, in 1995,the United Nations Commission on Sustainable Development adopted 59 indicators (CSD, 1996).Then, in 2007, the United Nations introduced new revised indicators that included a set of 50 indicators (UNCSD, 2007).
In Iran, as in other underdeveloped and developing countries, there is no data concerning about the United Nation indicators. Therefore, with a general view of the United Nation indicators, this research has considered 101 suitable indicators for Lorestan province. Selected indicators play an important role in the development of regions. In Iran, the statistical analysis of the provinces has been published by the Statistics Center of Iran (http://www.amar.org.ir). Because many data-related data were not accessible for a number of villages, villages with incomplete information were excluded.
3.2. Indicators
Selected indicators were classified into eight different categories, including education, population, infrastructure, economics, health care, cultural services, welfare, and agricultural performance. These indicators and sub-indicators are shown in Table 1.
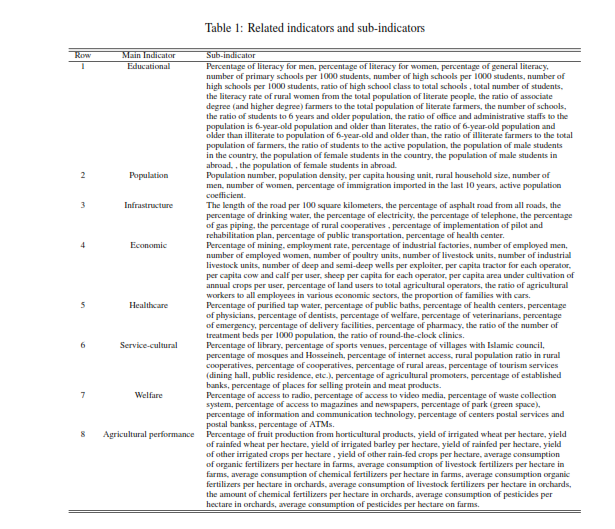
First, studies and surveys were performed using numerical taxonomy method for all villages based on all indicators and then separately, based on each of the indicators.
4. Results and discussions
4.1. The final ranking of the villages of Lorestan province by numerical taxonomy method
The results of using the taxonomy method and ranking the villages based on the development coefficient are shown in Table 2. According to the results, the development coefficient varies from a maximum of 0,761 for Bazvand village to 1,000 in the Keshvar village.
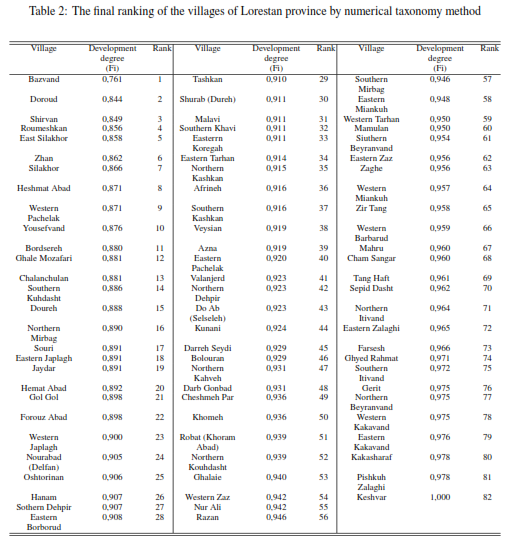
According to the results of numerical taxonomy analysis, it was found that the distribution of facilities and services between the villages of this province has been done in a completely inappropriate way, so that the first rank in the ranking is related to Bazvand village, which according to Table 4 has a village with provided level. The Doroud and Shirvan villages have also been ranked next and were considered semi-provided areas. The rest of the villages have a development coefficient (Fi) close to each other, therefore, the rest of the villages cannot be separated in terms of development. Thereto, other villages in Lorestan province are part of the semi-provided and deprived villages. It should be noted that the villages of Olad Ghobad have been removed from our list due to incomplete information, and also the four villages included Western Zalaghi, Romiani, Western Keragah, and Goodarzi have been identified as heterogeneous areas and we excluded them from list. The results show an unfair distribution and even lack of facilities and infrastructure in the villages of Lorestan province, so that the villages ranked 14 to 82 are considered deprived villages and were in one group. Considering the distances between the villages of this province, it is necessary to pay attention to the balanced distribution of services among different villages of the Lorestan province in order to achieve proper homogeneous development at the provincial level by adopting proper planning and management.
Therefore, with the results of data analysis based on numerical taxonomy method, and development coefficient of rural provinces that have small distances from each other, it can be concluded that other methods along with numerical taxonomy technique can be used to increase ranking accuracy.
4.2. General ranking of villages in Lorestan province based on each indicator by using the numerical taxonomy method
The ranking of villages in each of the indicators is shown separately in Table 4. First, all the data in the Excel software was sorted. Then, the following steps were done: standardization, calculation of compund distance, homogenization, development model determination (Cio), and development coefficient (Fi) separately for each of the studied indicators, calculation and final ranking based on the development coefficient index.
According to Table 4, the results are as follows:
§ Educational indicator: In terms of educational index, South Koohdasht village with a development score of 0,63 had the first rank and Zhan (0,65) and Doroud (0,65) villages obtained the next ranks, respectively. According to these results and Table 3, it can be concluded that the distribution of educational facilities is heterogeneous so that the villages ranked 1 to 18 are described as having privileged areas, and villages with ranking 19 to 54 are semi-provided, and next 20 villages are deprived villages. However, considering the high development coefficient of the first rank village and also the low difference between the first and last rank villages, it can be considered that the lack of planning or lack of supervision over the proper distribution of educational facilities and services is sensible and tangible.
The villages of South Dehpir, Western Zalaghi, Eastern Zaz, Shurab (Dureh), Western Tarhan, Western Kargah, Northern Kouhdashti, Golgol, Northern Mirbag, Noor Ali and Hemmat Abad were also identified as heterogeneous areas and were removed from the ranking list.

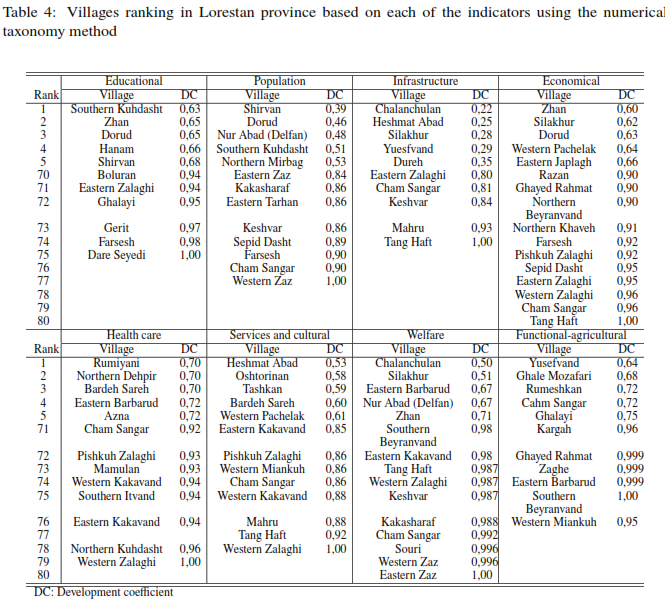
§ Population index: In terms of population index, Shirvan village with a development coefficient score of 0,39 has the first rank and Doroud (0,46) and Noor Abad (0,48) villages obtained the next ranks, respectively.
According to these results and Table 3, it can be said that the demographic conditions and the density of the active population are heterogeneous, so that the villages ranked 1 to 42 are described as provided areas, and the villages of ranks 43 to 73 are part of the semi-provided villages, as well as villages of Sepid Dasht, Farsesh, Cham Sangar, and Western Zaz were recognized as deprived villages. The villages of Southern Dehpir, Western Kargah, Goodarzi, Mahro, Hemmat Abad, Southern Khaveh, Eastern Zalaghi, Western Zalaghi, and Northern Kouhdasht were also identified as heterogeneous areas and were removed from our ranking list.
§ Infrastructure index: In terms of infrastructure index, Chalancholan village with the coefficient development score of 0,22 has the first rank and Heshmat Abad (0,25) and Silakhor (0,28) villages achieved the next ranks, respectively.
According to these results and Table 3, it can be said that the distribution of infrastructure facilities is relatively homogeneous and fair, so that villages 1 to 68 are described as providing areas, and the villages of ranks 69-72 are part of the semi-provided villages. Only Mahour and Tang Haft villages were recognized as deprived villages.
Based on the results, it can be concluded that the focus on the distribution of infrastructure structures among Lorestan villages is less visible, and a more equitable distribution are necessary. Western Zalaghi, Souri, Farsesh, Goodarzi, Bazvand, Romeshkan, Romiani, Eastern Borbrud, Western Barbroud, Razan, Eastern Tarhan, and Qalaei villages were found to be as heterogeneous areas and were removed from the ranking list.
§ Economical index: In terms of economical index, Zhan village with the coefficient development score of 0.60 has the first rank and Silakhur (0,62) and Dureh (0,63) villages obtained the next ranks, respectively. According to these results and Table 3, it can be said that the distribution of facilities, structures and units effective in economic conditions is heterogeneous. Villages with ranks of 1 to 22 are described as providing areas, and the villages of ranks 23 to 67 are part of the semi-provided villages, as well as villages with ranking from 68 to 80 were recognized as deprived villages.
The economic index as well as its infrastructure is among the factors affecting various indicators that should be given more attention, and lack of planning and mismanagement regarding the economic index can be one of the main reasons of underdevelopment and deprivation in different villages. It should be noted that the villages of Bolouran, Western Kargah, Northern Koohdasht, Western Miankooh, Bazvand and Noor Ali were found to be as heterogeneous areas and were omitted from the ranking list.
§ Health care index: In terms of health care index, Romiani village with a development coefficient score of 0,70 has the first rank and Western Zalaghi village (1,00) allotted the last rank, which has a difference of 0,30 coefficients with each other, which shows the lack of proper distribution of facilities and health infrastructure is at the village level of Lorestan province. According to these results and Table 3, the first to 21st rank villages are described as providing villages, and the villages of ranks 22 to 61 are part of the semi-provided villages, as well as villages with ranking from 62 to 79 were identified as deprived villages. The villages of Bazvand, Tang Haft, Shirvan, Goodarzi, Keshvar, Razan, and Romeshkan were identified as heterogeneous areas and were deleted from the ranking list.
Services and cultural index: In terms of service and cultural index, Heshmat Abad village, with a development coefficient score of 0,33 had the first rank and Western Zalaghi (1,00) gained the last rank. According to these results and Table 3, it can be seen that the villages with ranking from 1 to 50 are described as providing villages, and the villages of ranks 51 to 76 are part of the semi-provided villages, as well as Tang Haft and Western Zalaghi were identified as deprived villages. The villages of Bazvand, Eastran Japlagh, Goodarzi, Western Japlagh, Cheshmeh Par, Northern Khaveh, Romiani, and Silakhor were also identified as heterogeneous areas and were removed from the ranking list.
§ Welfare index: In terms of welfare index, Chalancholan and Eastern Zaz villages were ranked first and last, with a development score of 0,501 and 1,00, respectively. According to these results and Table 3, it can be seen that the villages with ranking from 1 to 18 are explained as providing villages, and the villages of ranks 19 to 45 are part of the semi-provided villages, as well as villages from ranks of 46 to 80 were identified as deprived villages. The villages of Bazvand, Ghayed Rahmat, Goodarzi, Western Pachelak, Northern Mirbag, and Eastern Silakhor were also identified as heterogeneous areas and were removed from the ranking list.
§ Functional-agricultural index: In terms of service and cultural index, Yousefvand village, with a development coefficient score of 0,638 had the first rank and Southern Beyranvand (1,00) obtained the last rank. According to these results and Table 3, it can be concluded that the villages with ranking from 1 to 6 are explained as providing villages, and the villages of ranks 7 to 21 are part of the semi-provided villages, as well as villages from ranks of 22 to 75 were identified as deprived villages. The villages of Bazvand, Cheshempar, Dare Seyedi, Romiani, Oshtorinan, Tang Haft, Souri, Mahru, and Eastern Silakhur were identified as heterogeneous areas and were omitted from the ranking list.
5. Conclusion
In recent decades, rural development has been one of the main examples of development in most third world countries, hence it is a strategy to improve the social and economic life of the poor people in village and make a comprehensive effort to reduce poverty, and efforts should be made in village areas to increase production and performance, and in the general context of national policies, this should be taken into account [26]. In fact, there is a connection between rural development and national development (Cochrane, 2007). However, by examining and evaluating the distribution of services and facilities at the provincial and intra-provincial level, especially at the rural level, the need for special awareness to services and facilities distributions is more expected.
Due to the geographical location of Lorestan province and being located in the Zagros Mountains and semi-humid and semi-arid climate zones [34], this province has a great potential for development that can be further studied. Also, in some villages of Lorestan province, it is observed that although they are not in a good position in the ranking based on all indicators, but they have high rankings in the evaluation based on each of the indicators. For instance, Chalancholan village, which is ranked 13th in the ranking based on all indicators and counted as a semi-provided areas, based on the infrastructure index, this village has the first rank,(development coefficient: 0,22), which shows it is suitable for development in terms of infrastructure.
Therefore, it can be concluded that in many development indicators, the planning were formed some villages have made relative progress in one dimension and these villages have not been properly developed in the other indicators, and this has caused to reduction rural development level for all indicators. By having a suitable planning for the homogeneous distribution of infrastructure, services, and comprehensive facilities in each of the villages of the Lorestan province, it is easy to imagine a coherent program that is appropriate to the comprehensive progress approach at the provincial level. In this regard, we can present the following suggestions:
- 1. Use studies and research on implementation and planning to prioritize villages
- 2. Encouraging private investment to progress the socio-economic indicators of the Lorestan villages
- 3. Establishment and reinforcement of service centers in the villages and central rural
- 4. Improving the business environment and creating a suitable environment for using personnel in various sectors
- 5. Considering the deprivations in the priority of development planning can decrease the gap amongst the villages. According to our results, it can be said that most of the villages of Lorestan province are deprived and need more attention from the authorities.
- 6. Balancing the pattern of distribution of facilities and services, as well as decentralizing some villages in the Lorestan province to benefit other villages
- 7. Pay attention to the capabilities of each region and appropriate policies to create jobs in deprived villages
- 8. Providing social welfare and welfare services according to all settlements of the province, especially rural areas to prevent the migration from rural areas to cities.
6. References
[1] C. Xu, M. Liu, S. An, J. M. Chen, and P. Yan, “Assessing the Impact of Urbanization on Regional Net Primary Productivity in Jiangyin County, China,” Journal of Environmental Management, vol. 85, no. 3, pp. 597–606, 2007.
[2] J. Xi and N. N. Cho, “Spatial and temporal dynamics of urban sprawl along two urban–rural transects: A case study of Guangzhou, China,” Landscape and Urban Planning, vol. 79, no. 1, pp. 96–109, 2007.
[3] M. Sohel Rana, “Status of water use sanitation and hygienic condition of urban slums: A study on Rupsha Ferighat slum, Khulna,” Desalination, vol. 246, no. 1–3, pp. 322–328, 2009.
[4] United Nations Development Programme (UNDP), Human Development Report 2003. Millennium Development Goals: A compact among nations to end human poverty. New York, Oxford: Oxford University Press, 2003.
[5] J. Field, Social capital: Keys Ideas, 2nd ed., P. Hamilton, Ed. The Open University, Milton Keynes outledge, 2008.
[6] B. A. Sullivan, M. Snyder, and J. L. Sullivan, Cooperation: The Political Psychology of Effective Human Interaction, 1st ed. Wiley-Blackwell, 2007.
[7] M. Pacione, Urban Geography, a Global Perspective. London: Routledge, 2003.
[8] A. Winkler, “Measuring Regional Inequality : An Index of Socio-Economic Pressure for Serbia,” Collection of Papers - Faculty of Geography at the University of Belgrade, vol. 60, pp. 81–102, 05 2012.
[9] D. Clark, Urban World/Global City. London and New York: Routledge, Taylor & Francis Group, 2003.
[10] C. A. Archibong, “Technology, infrastructure and entrepreneurship: Role of the government in building a sustainable economy, school of business and economics North Carolina & T State University,” The International Journal Of Humanities and Social Studies, vol. 3, no. 11, pp. 313–323, 2004.
[11] Y. Azadi and H. BeikMohammadi, “Analysing and ranking development levels of rural regions in the Townships of Ilam Province,” Journal of Spatial Planning, vol. 2, no. 2, pp. 41–62, 2013.
[12] R. Das and A. K. Das, “Industrial Cluster: An Approach for Rural Development in North East India,” International Journal of Trade, Economics and Finance, vol. 2, no. 2, pp. 161–165, 2011.
[13] M. Piwowarski, D. Milaszewicz, M. Latuszyńska, M. Borawski, and K. Nermend, “TOPSIS and VIKOR methods in study of sustainable development in the EU countries,” Procedia Computer Science, vol. 126, pp. 1683–1692, 2018.
[14] S. Amanpour, S. Mokhtari Chelcheh, R. Hosseini Kahnoj, and E. Veisi, “Spatial Analysis and Evaluation of Rural Development (Case Study: Counties of Chaharmahal & Bakhtiyari),” Journal of Research & Rural Planning, vol. 4, no. 2, pp. 97–110, 2015.
[15] B. Dev, “Assessing Inequality Using Geographic Income Distributions,” phdthesis, University of California, Santa Barbara and San Diego state University, 2014.
[16] T. Piketty and E. Saez, “Inequality in the Long Run, the since of Inequality,” Science, vol. 344, no. 6186, pp. 838–843, 2014.
[17] J. Oliveira Soares, M. M. Lourenço Marquês, and C. M. Ferreira Monteiro, “A multivariate methodology to uncover regional disparities: A contribution to improve European Union and governmental decisions,” European Journal of Operational Research, vol. 145, no. 1, pp. 121–135, 2003.
[18] M. Lesher and S. Miroudot, “Analysis of the Economic Impact of Investment Provisions in Regional Trade Agreements,” OECD Trade Policy Papers, No. 36, OECDPublishing, Paris, techreport, 2006.
[19] T. Molnar, “Factor Influencing Development Level of Settlements in South-Transdanubia,” Journal of Central European Agriculture, vol. 8, no. 3, pp. 277–284, 2007.
[20] R. M. Al-Hassan and X. Diao, “Regional disparities in Ghana: Policy options and public investment implications,” International Food Policy Research Institute (IFPRI), GSSP working papers 2, 2007.
[21] C. Rosenstein, “Cultural development and city neighborhoods,” City, Culture and Society, vol. 2, no. 1, pp. 15–29, 2011.
[22] S. Jakub and T. Marcela, “Factors Affecting Development of Rural Areas in the Czech Republic: A Literature Review,” Procedia - Social and Behavioral Sciences, vol. 220, pp. 496–505, 2016.
[23] M. Mousavi, A. Meshkini, M. Vaisy, and M. Hosseini, “Assessing the levels of development of health services with decision-making model - several criteria) Case study: Cities of Khorasan Razavi province,” Human settlement planning studies, vol. 11, no. 37, pp. 99–112, 2016.
[24] R. Hodder, Development Geography (Routledge Contemporary Human Geography), 1st ed. Routledge, 2000.
[25] R. Rezvani, Introduction to Rural Development Planning in Iran. Tehran, Iran: Qomes Publication, 2004.
[26] A. Oddershede, A. Arias, and H. Cancino, “Rural development decision support using the Analytic Hierarchy Process,” Mathematical Computer Modelling, vol. 46, no. 7–8, pp. 1107–1114, 2007.
[27] Millennium Challenge Corporation, The Agency for International Development and the Millennium Challenge Corporation : fiscal year 2012 budget requests and future directions in foreign assistance : hearing before the Committee on Foreign Affairs, House of Representatives, One Hundred Twelfth Congress, first session, March 16, 2011. United States: Government Publishing Office, 2011.
[28] E. B. Barrios, “Infrastructure and rural development: household perceptions on rural development,” Progress in planning , vol. 70, no. 1, pp. 1–44, 2008.
[29] T. Prato and G. Herath, “Multiple-criteria decision analysis for integrated catchment management,” Ecological economics, vol. 63, no. 2, pp. 627–632, 2007.
[30] J. Mohammadi, A. Abdoli, and M. Fathi Beyranvand, “Investigating the level of development of Lorestan province cities by housing and welfare-infrastructure services, agriculture and industry,” Journal of Applied Researches in Geographical Sciences, vol. 12, no. 25, pp. 127–150, 2013.
[31] P. Kline, An easy guide to factor analysis. London and New York: Psychology Press, 1994.
[32] K. Kalantari, Data processing and analysis in socio-economic research using SPSS software, 2nd ed. Tehran: Sharif Publishing, 2006.
[33] B. Saroukhani, J. Tavakoli Vala, and A. Rostamzadeh, “Numerical Taxonomy and Its Application in Social Research,” Journal of Historical Sociology, vol. 4, no. 1, pp. 171–194, 2012.
[34] P. Attarod, S. M. M. Sadeghi, T. G. Pypker, and V. Bayramzadeh, “Oak trees decline; a sign of climate variability impacts in the west of Iran,” Caspian Journal of Environmental Sciences, vol. 15, no. 4, pp. 373–384, 2017.
Enlace alternativo
https://www.revistas.uc.edu.ve/index.php/revinguc/article/view/294 (html)
http://servicio.bc.uc.edu.ve/ingenieria/revista/v27n3/art09.pdf (pdf)