Article
Validation and study of different parameters in the simulation of diagnostic X-ray spectra using the MCNPX code
Validation and study of different parameters in the simulation of diagnostic X-ray spectra using the MCNPX code
Brazilian Journal of Radiation Sciences, vol. 11, no. 1, e2119, 2023
Sociedade Brasileira de Proteção Radiológica
Received: 06 October 2022
Accepted: 23 March 2023
Published: 28 March 2023
Abstract: In radiology, knowing the X-ray spectrum characteristics makes it possible to estimate the absorbed dose in the patient and to improve image quality. In this study, an X-ray generator was proposed using the MCNPX code and to validate it, the simulated spectrum was compared to the data provided from AAPM Task Group 195, which resulted in a percentage difference of 8.7%. Furthermore, several X-ray spectra were generated and compared to the spectra obtained from commercially available softwares as xpecgen and SpekCalc. The percentage differences were of the order of 13% in comparison with SpekCalc and 8% with xpecgen. The major differences obtained between those spectra were concentrated in the region of characteristic peaks, independently if variations in electron beam energy, target angle or filtration thickness were performed.
Keywords: X-ray spectrum, Monte Carlo simulation, MCNPX.
1. INTRODUCTION
The Monte Carlo Method (MCM) for radiation transport analysis has been widely used in different fields, including medical physics, due to reasons such as the possibility of reliably estimate measures that would not be feasible to perform experimentally [1-3], as is the case of determining X-ray spectra from commercial tubes [4].
The MCM is an efficient resource to estimate the energy spectrum generated in X-ray medical imaging devices, but in order to be used reliably, Monte Carlo scenarios require validation [1]. The validation is usually performed by replicating an empirical method and comparing the results. However, measurements of X-ray spectra are a complex task which requires some expertise and specific (and expensive) equipment, such as scintillators [5-8,1,4]. For this measurement, the number of photons per unit of time that reach the detector must be limited, since the detectors used for this purpose may not work correctly at high count rates as a "pile-up" effect can occur, in which an accumulation of pulses produces a distortion in the measurement of the X-ray spectrum [8].
According to the AAPM Report Task Group 195 [1], the type and degree of validation required depend on the objectives of the research projects, making it possible to compare the results with previously validated and published Monte Carlo simulations. The search for previous publications showed us a lack of information on the results of the spectra (raw data) and implementation of coding, a fact also pointed out in the AAPM report, which, given these difficulties, proposes to be a reference for Monte Carlo simulations. The quoted AAPM publication compares six different setups with four Monte Carlo packages and provides the raw data in Excel files.
In radiology, the knowledge of the spectrum characteristics, as well as the parameters involved in its production, is relevant, as they directly affect the absorbed dose on the patient and also the quality of the radiographic image [9-11,4,7]. Gallardo et al. [9] and Tran et al. [4] present examples of simulated spectra obtained by using parameters of commercial devices dedicated to radiology. In both of these works, the spectra were simulated using Monte Carlo N-Particle Transport (MCNP) and compared with spectra generated in commercially-available softwares such as SpekCalc [12] and IPEM 78 [13], which use semi-empirical models in its analysis. Variation on parameters such as filtration and tube voltage, as well as the impact of these changes, were also analyzed in the quoted research.
Using softwares based on semi-empirical models is well established in the literature due to availability, ease of use, and rapid acquisition of results. However, they still have limitations, such as the relatively small set of options in relation to the applied tube voltage, anode angle, and available target/filtration materials, which limit their adoption in particular applications and analysis [4, 5, 7].
Thereby, the present work aims to provide a reliable X-ray spectra generator within the energy used in radiology, which was obtained by using the MCNPX Monte Carlo radiation transport code [14], monoenergetic electrons, and tungsten target. The modeled X-ray tube was validated with the results of case 6 of the AAPM TG 195 Report [1], which provides X-ray spectrum data obtained with the same version of the MCNPX code for electronic energy of 100 keV.
As the AAPM publication, used for validation, only provides one X-ray spectrum, additional simulations were performed, varying parameters such as tube voltage, anode angle, and filtration thickness. The results were compared with data obtained from semi-empirical generators, SpekCalc and xpecgen [15, 12]. These comparisons are relevant due to the fact that a wide variety of X-ray tubes are commercially available. Furthermore, an analysis was carried out regarding changes in the PHYS card, which is specific for MCNP, considering the discrepancies in the production of characteristic X-rays between the X-ray spectra generators [16].
2. MATERIALS AND METHODS
The MCNPX program began as an extension of MCNP4B and LAHET 2.8, with version 2.7.0 being one of its most recent updates. The code is compatible with MCNP5 and widely used; in which it is possible to set an arbitrary tridimensional configuration of materials in geometric cells [14]. The input file is divided in three blocks: the first two (cell and surface cards, respectively) are related to the geometric description of the problem and the third (data card) contains information such as the type of transported particles, source characterization, elemental composition of the materials, tallies and variance reduction techniques [17]. Information collected during the transport process is recorded using a variety of counts. Tallies are commands that account for simulated macroscopic quantities, such as deposited energy, particle flux, fluence. For geometric modeling, simple surfaces such as planes and cylinders or complex surfaces (called 'macrobodies') such as parallelepipeds and ellipsoid are defined in Block 2. Then, in Block 1, those surfaces are delimited into regions using boolean operators; such regions are called 'cells' and compose the desired scenario [17].
In the context of the present work, a reliable Monte Carlo simulation required a detailed description of the X-ray tube, which include specifications such as: the electron source and its position, the spectra emitted by the cathode, the target material and the anode angle, as well as the inherent and additional filtration [4].
For validation purposes, the simulation scenario was initially composed by the target and the electron emission source, in a geometry similar to the one described in case 6 of the AAPM TG 195 report. Cathode was represented by a disk-shaped source, homogeneously emitting a 100 keV-energy electron beam towards the tungsten anode (Figure 1). Anode geometry was defined by the RPP macrobody card (rectangular parallelepiped), with the same dimensions used in the referred AAPM publication, and initially inclined at an angle of 11o. A sphere centered on the Z axis, with vacuum inside, corresponded to the study universe.
![Monte Carlo simulation scenario modeled according to the case 6 of the AAPM TG 195 report. In (b) the scoring cells (where the simulated macroscopic quantity is registered) are numbered. These figures were generated in software Moritz [18].](../2119-figure1.jpg)
Figure 1
Monte Carlo simulation scenario modeled according to the case 6 of the AAPM TG 195 report. In (b) the scoring cells (where the simulated macroscopic quantity is registered) are numbered. These figures were generated in software Moritz [18].
Regarding Block 3, part of the code related to the definition of the unidirectional source emission in the – Y direction was:
SDEF POS=0 5 0 AXS=0 1 0 EXT=0 RAD=d1 PAR=3 ERG=0.1 VEC= 0 -1 0 DIR=1
SI1 0.3
SP1 -21 1
The SDEF card defines the source, including its position coordinates (POS), the electron emission axis (AXS), and the direction (VEC and DIR) of this emission, as well as the type of particle (PAR) and electron energy (ERG). The electron source was represented by a disk in the position x = 0, y = 5 and z = 0 which homogeneously strikes the target with a radius of 0.3 cm. The SI1 and SP1 cards were described to indicate the range and weight of the radial sampling [17]. The defined particles for the MCNPX simulation code were electrons and photons (MODE E P) and the ENDF/B-VII photon cross section table was used.
The elemental composition of the materials was simulated based on the report "Compendium of Material Composition Data for Radiation Transport Modeling" published by the Pacific Northwest National Laboratory (PNNL) [19]. To improve the efficiency of the electron transportation, the card PHYS:E was used in a way to optimize some physical parameters:
PHYS:E 100 0 0 0 0 100 1 1 1 0 0.917 $bnum=100
The card's parameters were activated with the default values, being the sixth entry (BNUM) the only exception. This specific entry controls the bremsstrahlung photon production and it is a tool for variance reduction. The BNUM default value is equal to 1. If BNUM > 0, bremsstrahlung photon production will be BNUM times greater [14]. This process optimizes the relative error but does not increase the output values, so the spectrum profile is not changed [4].
In the AAPM TG 195 report, five scoring areas were defined to evaluate the photon fluences in different locations (described in the Figure 19). To achieve the same scenario, in this study, tally F4 was used, which calculates the flux average over a cell (MeV/cm²/particle) and, additionally, the F5 (flux at a point detector [MeV/cm²/particle]) and F2 (flux at a surface [MeV/cm²/particle]) tallies were also tested. Five cells have been defined with dimensions and positions similar to those presented by the AAPM report, positioned 100 cm distant from the target, on the Z axis (Figure 1). The dimensions in millimeters presented in the AAPM report were considered as centimeters, since, considering the source-detector distance of 100 mm, the intensity of the photon flux was significantly higher. The data provided in the electronic resources of that report were compared to our simulation without normalization, since the initial conditions and outputs were the same.
After achieving good agreement in the comparison with the AAPM TG 195 report, several simulations were performed varying X-ray tube parameters and the obtained spectra were compared with validated generators that use semi-empirical models. In this work, the semi-empirical generators SpekCalc and xpecgen were used due to their availability and because they are commonly used (mostly, SpekCalc) in the literature [20-23,5,10,16]. These softwares allow variations on both the target angle and filtration thickness, as well as in the electron beam energy.
Two basic differences between geometries were made, since our goal was to simulate the entire X-ray tube: a lead-coated cylinder, parallel to the Y axis, with vacuum inside and the universe filled with air, along with the total filtration (inherent and additional), which was positioned in the tube exit. Figure 2 shows a view (plane X = 0) of the X-ray tube, which was generated in the software Moritz [18].
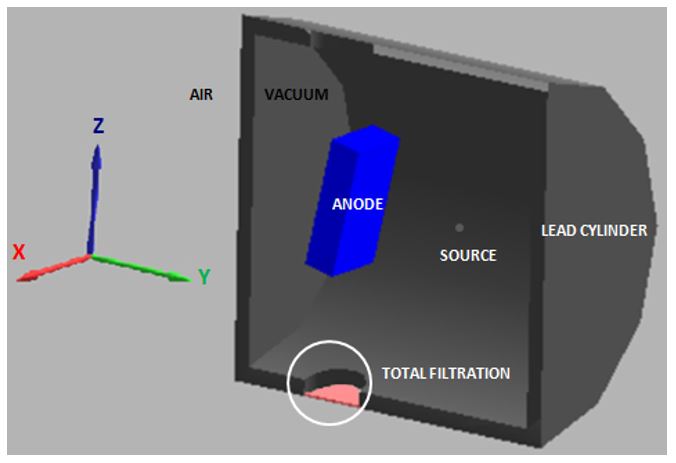
Figure 2
Modeled X-ray tube and the addition of aluminum filtration.
First, different tallies (F5 and F2) were verified. For F5 tally, X-ray spectra was obtained based on five point detectors (exclusion sphere radius of 0.5 cm and at a distance of 100 cm from the target on the Z axis), positioned at the center of the previously defined regions (detectors 1 to 5, see Figure 1). The F5 tally was chosen after verifying that the spectrum, compared to that obtained using the F4 tally (Figure 3), did not present a considerable difference, but required much less computational time, lower number of particle histories (2x10⁷) and implicated in a lower relative error. In this comparison, lead coating has already been added to the simulated geometry with the F5 tally, but without air filling and without filtration. Moreover, tally F2 can be another feasible option, because it also presented similar results.
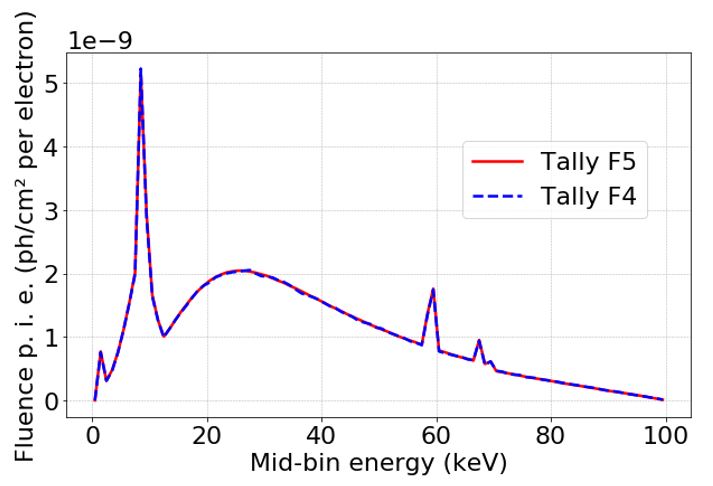
Figure 3
Comparison between spectra obtained by using tallies F4 and F5 from the MCNPX at the central beam axis.
Setting values of filtration and anode angle to, respectively, 2.5 mmAl and 16o, which are used in some mobile X-ray units, the variation in energy was analyzed in the interval between 50 and 140 keV. The acquired spectra were compared to those obtained from the SpekCalc and xpecgen generators, based on a total area curve normalization (arbitrary units - a. u.) described in Equation 1.
 (1)
(1)where f(xi) refers to the photon flux value in each energy bin (xi), and the denominator represents the absolute value sum for all the sampled energy bins.
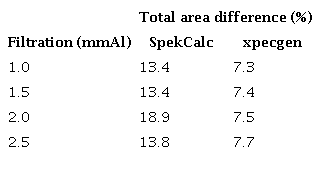
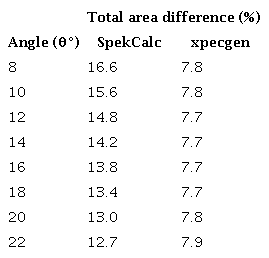
In another set of simulations, anode angles of 12°, 14°, 18°, 20° and 22° were implemented with energy source (110 keV) and filtration (2.5 mmAl) maintained fixed. Finally, keeping the anode angle in 16° and the energy in 110 keV, the filtration was varied (1.0, 1.5, and 2.0 mmAl) and, again, the results were compared to those generated by the semi-empirical models.
The conformity between the spectra simulated by using MCNPX and generators is expressed in terms of the total area percentage difference (Equation 2).
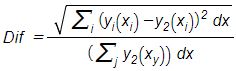 (2)
(2)where y1(xi) is the normalization to each energy bin relative to the MCNP particle fluence and y2(xi) is the same normalization but relative to the values obtained with the spectra generator softwares.
3. RESULTS AND DISCUSSION
The 100 keV X-ray spectrum obtained in this work with F4 tally was compared to the results from the electronic resources provided by the AAPM report TG 195 and showed a good agreement (see Figure 4), with a percentage difference of 8.7%. To obtain this result, 2x10⁸ particle histories were simulated.
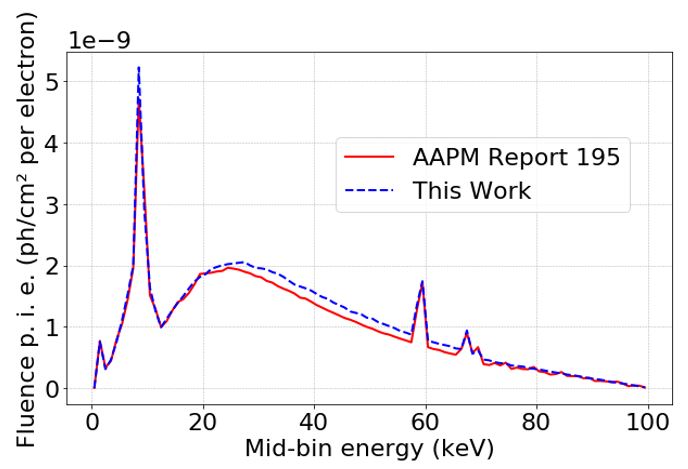
Figure 4
Comparison between the spectrum generated in this work and that of case 6 from the AAPM report TG 195.
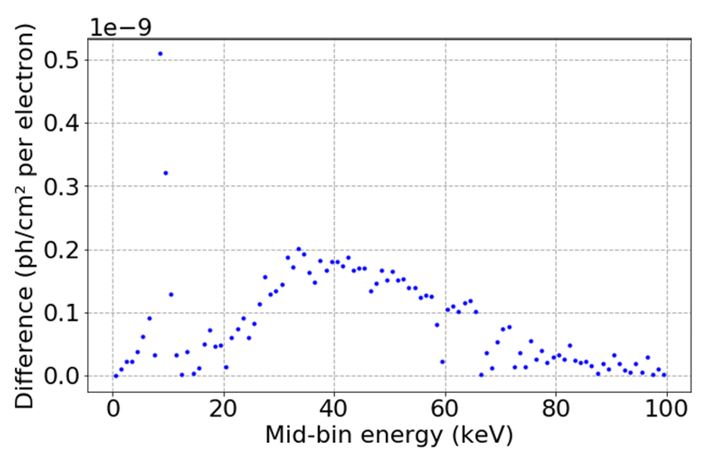
Figure 5
Distribution of difference in spectrum values as function of energy.
As can be seen in Figure 5, in the region of the lowest energies there are the points of greatest discrepancy between the spectra. However, these energies do not contribute to the radiographic image and, therefore, are usually filtered.
The difference presented between the spectra may be associated with issues such as the variance reduction techniques that were used, which are not informed. Furthermore, it was not explicit which MCNPX tally was used in the AAPM publication, and the number of simulated particle histories was also not specified. Even more, our simulation presented smaller errors (the express majority of errors were below 1%), which can be visually observed in the spectra presented in Figure 6.
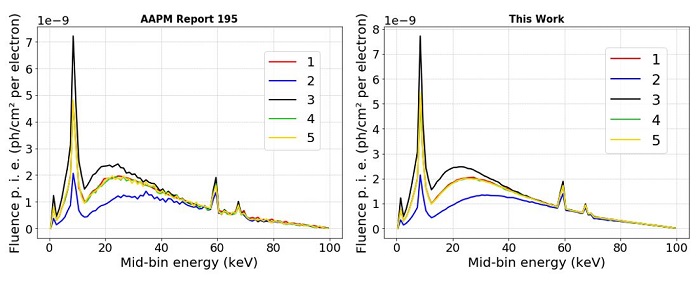
Figure 6
Results of the five regions (1, 2, 3, 4 and 5) defined for energy fluence distributions scoring.
The numbers from 1 to 5 refer to the photon fluence measurement regions. The positioning of the detectors were considered in order to verify symmetry and the Heel effect. According to the AAPM TG 195 report, regions 2, 1 and 3 correspond to the Heel effect and regions 4, 1 and 5 reflect symmetry (see Figure 6). The Heel effect is a physical phenomenon whereby the intensity of the photon beam varies along the anode-cathode axis. Photons emitted towards the anode side (region 2) are more attenuated by the anode itself than those emitted towards the cathode side (region 3). This effect can affect raw pixel values in digital radiography, for example [24].
All simulations using the tally F5, in order to optimize the computational time, adopted 1x10⁷ particle histories. Even so, the relative error was in the same order as the previous comparison, around 1%.
Spectra simulated in this evaluation showed a good agreement with those obtained from SpekCalc and xpecgen. Figure 7 presents the X-ray spectra, obtained with tungsten target and electron energy of 110 keV. In Table 1, we can see the percentage differences from spectra for all energies studied.
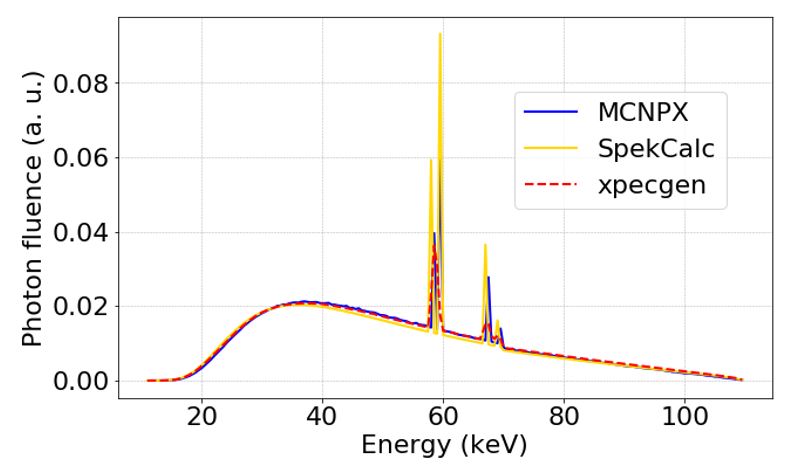
Figure 7
Comparison between the X-ray spectrum simulated using MCNPX and those obtained from SpekCalc and xpecgen for a tungsten anode, 110 keV electron beam, 2.5 mmAl filtration and 16° anode angle.
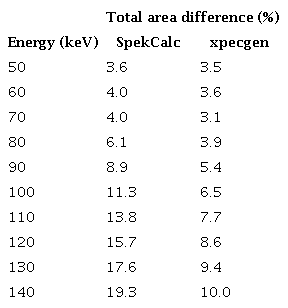
As shown in Table 1, the percentage differences between the spectra vary with energy. It is clear from the data that for energies between 50 and 70 keV, the percentage differences are especially low (less than 5% in comparison to both generators) and smaller than those for higher energies. This is due to the characteristic peaks generation, as depicted in Figure 8.
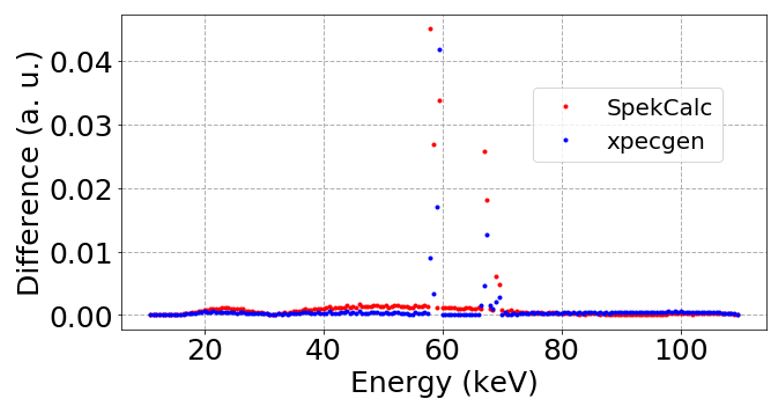
Figure 8
Difference distribution in spectra values as a function of energy (with respect to the spectrum generated in MCNPX).
The characteristic emission emerging from the target can be estimated from the detailed description of the depth distribution of the X-ray fluorescence. This emission occurs when an ion with a vacancy in an inner layer, which is a result from impact of electrons or photon interactions in the thick tungsten target, relaxes through a radiative transition. Considering that the two interaction processes are different (ions generated by photon interactions span a larger volume due to greater bremsstrahlung penetration) it is conceivable that they produce a distinct spatial distribution of X-ray fluorescence in the target material [25]. However, the depth in which characteristic X-ray production occurs is not considered in the model used in SpekCalc, implying a disregard for the filtration of these photons in the anode. This fact limits the estimation of X-ray emission for small angles (between the anode surface and the X-ray direction of emission) [25] and makes it unable to reproduce angular emission distribution of the photons. In the case of xpecgen, characteristic X-ray yield is modeled proportionally to the yield of filtered bremsstrahlung, generating a slightly better performance [16].
For both SpekCalc and xpecgen, maintaining the electron energy (110 keV), changes in aluminum filtration thickness did not result in significant difference compared to the simulated spectra. As can be seen in Table 2, the differences are similar to those found for the parameters of 110 keV and 2.5 mm of filtration (see Table 1), corroborating the reasons presented previously for the percentage differences obtained. The spectrum with 2 mm of filtration generated in SpekCalc showed a small shift to the right, which possibly must be a software error, and it is necessary to pay attention to this. Because of that, the difference was greater for this spectrum compared to the other studied thicknesses.
Regarding the anode angle variation, a distinction between the semi-empirical generators is seen. In the case of xpecgen, the spectra showed little variation in difference compared to those of MCNPX, with all presenting differences close to 8%. In the case of SpekCalc, there is a reduction in the difference, when compared to the simulated spectra, as the degree of the angle increases, as expected due to the fluorescence emission explained before. For 22°, the difference was 12.7%, as shown in Table 3.
The difference in the curves is concentrated in the characteristic X-ray region for both the variation in the anode angle and the aluminum filtration thickness.
Concerning the BNUM parameter, this study showed that a value of 100 successfully incremented the efficiency of the simulations and obtained statistically satisfactory outputs. Without this change, a bigger computational time interval would be needed to finish the simulation process. Tran et al. [4] indicate that a satisfactory spectrum can be obtained by using a BNUM > 80.
Furthermore, considering that the found discrepancies are related to the characteristic X-ray peaks, the possible impact on changing the seventh entry in the PHYS card on these intensities was evaluated. The quoted entry refers to the XNUM, which is a parameter related to the electron induced X-ray production control [14]. Nonetheless, the variation on this parameter value from 1 to 500 resulted in the same output, showing that such modification did not affect the peak intensities.
The characteristic peaks generated in this work are similar to the characteristic peak of the spectrum provided by the AAPM publication, confirming the low production of these X-rays in the MCNPX code compared to commercial generators. But, in the case of xpecgen model, the characteristic K X-rays were modeled by fitting the different peak X-ray intensities to the TASMICS model data, which underestimates the characteristic X-ray emission, since it interpolates spectra calculated using MCNPX [16].
Although SpekCalc is more widespread in the literature, the xpecgen model, described more recently, shows better agreement with experimental results than the SpekCalc predictions with regards to the area between the spectra [15]. The spectrum model approach of xpecgen is similar to that of SpekCalc, but with a refinement in the description of electron penetration into the target, besides including bremsstrahlung cross sections differential in energy from NIST [16].
4. CONCLUSION
This study reports the simulation of an X-ray spectra generator, in which parameters can be easily modified for typical commercially available X-ray tube features, using the MCNPX code. As the validation against empirical results is a very difficult task, it was performed according to the reference data sets provided by the Task Group 195 of AAPM, resulting in an agreement of 91.3%. Parameters such as energy, aluminum filtration and anode angle were varied in view of broadening the analysis between the use of MCNPX and the softwares SpekCalc and xpecgen, which are semi-empirical spectra generators. Most of the percentage differences were below or approximately equal to 13% (SpekCalc) and 8% (xpecgen), with the exceptions being found for the higher values of energy, which resulted from the presence of the characteristic X-ray peaks and its increment in intensity. It was observed that the characteristic radiation is underestimated in MCNPX code in comparison to commercial generators due to the treatment of relaxation processes and also electron impact ionization.
Our work presented a practical and flexible X-ray spectra generator, whose parameters that determine the characteristics of the X-ray beam can be easily and widely modified, which allows its application in future computer simulation scenarios in the various radiodiagnosis modalities, such as in studies with MCM related to radioprotection and image analysis.
ACKNOWLEDGMENT
The authors would like to thank the Brazilian agencies: CNPq (309675/2021-9) (W.S.S); UNIVER-SAL Project (407493/2021-2); INCT Project (406303/2022-3).
REFERENCES
SECHOPOULOS, I. et al. Monte Carlo reference data sets for imaging research: Executive summary of the report of AAPM Research Committee Task Group 195. Medical Physics, 42, 5679-5691, 2015.
PARK, H. et al. Monte Carlo methods for device simulations in radiation therapy. Phys Med Biol, 66 18TR01, 2021.
YORIYAZ, H. Método de Monte Carlo: princípios e aplicações em Física Médica. Revista Brasileira de Física Médica, 3(1):141-9, 2009.
TRAN, K. A. et al. Study on the characteristics of X-ray spectra in imaging diagnosis using Monte Carlo simulations. Journal of the Korean Physical Society, Vol. 69, No. 7. 2016.
REYNOSO, F. J. et al. Comparison of filtered X-ray spectra and depth doses derived from a hybrid Monte Carlo model of an orthovoltage X-ray unit with experimental measurements. Biomed Phys Eng Express 2 045011, 2016.
CHUSIN, T.; MATSUBARA, K.; TAKEMURA, A.; OKUBO, R.; OGAWA, Y. Validation of mammographic x-ray spectra generated using Particle and Heavy Ion Transport code System. Phys Med Biol, 18;65(6):065004, 2020.
AY, MR. ; SHAHRIARI, M.; SARKAR, S.; ADIB, M.; ZAIDI, H. Monte carlo simulation of X-ray spectra in diagnostic radiology and mammography using MCNP4C. Phys Med Biol, 7;49(21):4897-917, 2004.
GALLARDO, S.; RÓDENAS, J.; VERDÚ, G. Monte carlo simulation of the compton scattering technique applied to characterize diagnostic x-ray spectra. Med Phys, 31(7):2082-90, 2004.
GALLARDO, S.; QUEROL, A.; RÓDENAS, J.; VERDÚ G. Uncertainty Analysis in the Simulation of X-ray Spectra in the Diagnostic Range using the MCNP5 code. In: Proceedings of the 33rd Annual International Conference of the IEEE-Engineering in Medicine and Biology Society (EMBS), Boston, USA, 2011.
BUJILA, R.; OMAR, A.; POLUDNIOWSKI, G. A validation of SpekPy: A software toolkit for modeling X-ray tube spectra. Physica Medica, 75, 44–54, 2020.
GHAMMRAOUI, B.; MAKEEV, A.; GLICK, S. J. High-rate x-ray spectroscopy in mammography with photon counting detectors using a limited number of energy bins. Radiation Measurements, 138, 106444, 2020.
POLUDNIOWSKI, G.; LANDRY, G.; DEBLOIS, F.; EVANS, P. M. VERHAEGEN, F. SpekCalc: a program to calculate photon spectra from tungsten anode x-ray tubes. Phys Med Biol, 54(19):N433, 2009.
CRANLEY, K.; GILMORE, B. J.; FOGARTY, G. W. A. DEPONDS, L. Catalogue of diagnostic x-ray spectra and other data. IPEM Report No. 78, The Institute of Physics and Engineering in Medicine, 1997.
PELOWITZ, D. B. MCNPX User’s Manual Version 2.7.0. Los Alamos, LANL, 2011.
HERNÁNDEZ, G. FERNÁNDEZ, F. A model of tungsten anode X-ray spectra. Med Phys., 43(8):4655, 2016.
OMAR, A.; ANDREO, P. POLUDNIOWSKI, G. A model for the energy and angular distribution of X rays emitted from an X-ray tube. Part II. Validation of X-ray spectra from 20 to 300 kV. Med Phys. 47 (9), 2020.
SHULTIS, J. K. FAW, R. E. An MNCP Primer. Kansas State University. Manhattan. 2011.
VAN RIPER, K. A. MORITZ Geometry Tool User's Guide - Windows Version (Manual). White Rock Science, 2008.
MCCONN JR, R. J.; GESH, C. J.; PAGH, R. T.; RUCKER, R. A.; WILLIANS III, R. G. Compendium of Material Composition Data for Radiation Transport Modeling, Report PNNL-15870, Rev. 1. Pacific Northwest National Laboratory, Washington, 2011.
FITZGERALD P, ARAUJO S, WU M, DE MAN B. Semiempirical, parameterized spectrum estimation for x-ray computed tomography. Med Phys, 48(5):2199-2213, 2021.
ZHAO, W.; NIU, K.; SCHAFER, S.; ROYALTY, K. An indirect transmission measurement-based spectrum estimation method for computed tomography. Phys Med Biol, 60(1), 339–357, 2014.
O’CONNELL, J et al. Next generation high resolution perovskite direct conversion detector: Monte Carlo design optimisation and virtual clinical trial. Phys Med Biol, 68 025016, 2023.
KUNERT, P.; TRINKL, S.; GIUSSANI, A.; REICHERT, D.; BRIX, G. Tissue equivalence of 3D printing materials with respect to attenuation and absorption of X-rays used for diagnostic and interventional imaging. Med Phys, 49(12):7766-7778, 2022.
KUSK, M. W. et al. Anode heel effect: Does it impact image quality in digital radiography? A systematic literature review. Radiography (Lond), 27(3):976-981, 2021.
OMAR, A.; ANDREO, P. and POLUDNIOWSKI, G. A model for the emission of K and L X rays from an x-ray tube. Nucl Instrum Methods Phys Res B, 437:36–47, 2018.
Author notes
*k.consatti@gmail.com
Conflict of interest declaration