Psychometric prediction of penitentiary recidivism
Predicción psicométrica de la reincidencia penitenciaria
Psychometric prediction of penitentiary recidivism
Psicothema, vol. 28, no. 2, pp. 194-200, 2016
Colegio Oficial de Psicólogos del Principado de Asturias
Received: 14 October 2015
Accepted: 05 February 2016
Abstract: Background: Attempts to predict prison recidivism based on the personality have not been very successful. This study aims to provide data on recidivism prediction based on the scores on a personality questionnaire. For this purpose, a predictive model combining the actuarial procedure with a posteriori probability was developed, consisting of the probabilistic calculation of the effective verifi cation of the event once it has already occurred. Method: Cuestionario de Personalidad Situacional (CPS; Fernández, Seisdedos, & Mielgo, 1998) was applied to 978 male inmates classified as recidivists or non-recidivists. Results: High predictive power was achieved, with the area under the curve (AUC) of 0.85 (p <.001; Se = 0.012; 95% CI [0.826, 0.873]. The answers to the CPS items made it possible to properly discriminate 77.3% of the participants. Conclusions: These data indicate the important role of the personality as a key factor in understanding delinquency and predicting recidivism.
Keywords: Delinquency, penitentiary recidivism, prediction, personality.
Resumen: Antecedentes: los intentos para predecir la reincidencia penitenciaria basándose en la personalidad no han tenido mucho éxito. Este trabajo tiene como objetivo ofrecer datos sobre la predicción de la reincidencia a partir de las puntuaciones en un cuestionario de personalidad. Método: se aplicó el Cuestionario de Personalidad Situacional (CPS; Fernández, Seisdedos y Mielgo, 1998) a 978 reclusos varones clasifi cados como reincidentes o no reincidentes y se elaboró un modelo predictivo combinando el procedimiento actuarial con el concepto de probabilidad a posteriori, consistente en realizar cálculo probabilístico a partir de la constatación efectiva del suceso una vez ya se ha producido. Resultados: se logró un elevado poder predictivo, siendo el área bajo la curva (AUC) de 0.85 (p<0.001; Se = 0.012; 95% IC [0.826, 0.873]. Las respuestas a los ítems del CPS permitieron discriminar adecuadamente al 77,3% de los participantes. Conclusiones: estos datos indican el papel importante de la personalidad como factor clave para entender la delincuencia y predecir la reincidencia.
Palabras clave: delincuencia, reincidencia penitenciaria, predicción, personalidad.
Rehabilitative interventions performed in prison settings are designed to reduce criminal incidence rates, but results so far have been disappointing ( Medina, 2013 ). Criminal behavior is complex, has multiple causes, and is subject to legislative changes. With the exception of some general intelligence and personality characteristics (e.g., Chico, 1997 ; Pelechano, 2008 ; Sánchez-Teruel & Robles-Bello, 2013 ), it has not been possible to identify the profi le of the delinquent. Personality scales have failed to make highly accurate predictions about recidivism. Hence, for the past few decades, actuarial scales have been used, based on a mechanical combination of empirically validated risk factors ( Andrés & Echeburúa, 2010 ; Brouillette-Alarie, Proulx, & Benbouriche, 2013 ). Thus, Luque, Ferrer, and Capdevila (2005) , after a 4.5 year follow-up of a sample of former prisoners in 1997, elaborated a logistic regression equation with criminal and sociodemographic variables. However, the predictive power of the true positives (the people who actually relapsed), was 23.4%, a percentage below the level of accuracy by chance (37.4%).
Currently, there are more than 100 actuarial prediction scales, most of them referring to violent contexts and specifi c behaviors. They assign a risk factor weight, both “static” (e.g., unmodifi able) and “dynamic” (e.g., changeable), that correlates with repeated entry in prison (e.g., age, impulsivity, hostility, etc.). As limitations, it should be pointed out that these scales require specifi c training, they take a long time to be completed, and they have a predominance of items related to non-modifi able variables (e.g., gender). Several scales can be highlighted, among them: the Sexual Violence Risk- 20 ( Boer, Hart, Kropp, & Webster, 1997 ) scale for sex offenders; The Spousal Assault Risk Assessment ( Kropp & Hart, 2000 ); the Escala de Predicción del Riesgo de Violencia Grave (Scale for Predicting the Risk of Serious Violence against the Partner - Reviewed; Echeburúa, Amor, Loinaz, & De Corral, 2010 ), which tries to predict recidivism against the partner; and the Assessing Risk for Violence ( Webster, Douglas, Eaves, & Hart, 1997 ), used to predict generalized violence. The meta-analysis by Singh, Grann, and Fazel (2011) showed that the greatest predictive power reached by one of these scales, and measured by the Area Under the Curve (AUC), was 0.78 for the median and 0.71 - 0.83 for the interquartile range. A more recent meta-analysis by these authors Fazel, Singh, Dol, & Grann, 2012 ) found a median of AUC = 0.72 for violent crimes and an interquartile range of 0.68-0.78. The values for “general recidivism” were lower, 0.66 and 0.58-0.67, respectively.
In Spain, Graña et al. (2012) used the Inventario de Factores de Riesgo e Intervención en Prisiones (Inventory of Risk Factors and Intervention in Prisons; an adaption of Level of Service Inventory Revised, Andrews & Bonta, 1995 ) to predict recidivism in retrospect (N = 811). The AUC values for violent and general recidivism were 0.81 and 0.77, respectively.
The most recent attempt is the RISCANVI scale, implemented in Catalonia (Spain) in 2009. A retrospective study by Nguyen, Arbach, and Andrés-Pueyo (2011) achieved an AUC value of 0.64 for violent penitentiary recidivism, commonly found in other studies ( Fazel et al., 2012 ; Singh et al., 2011 ), but too low to make individual prognoses ( Martínez, 2014 ). In another prospective study by Capdevila et al. (2015) , the RISCANVI was applied to predict violent recidivism in 684 former prisoners in 2010. Although reaching a sensitivity of 77% and a specifi city of 57.26%, the authors did not offer the AUC or the positive predictive value (percentage of real violent recidivists predicted compared to the total number of violent recidivists predicted). However, this percentage was obtained from table 38 ( Capdevila et al., 2015; p.151 ): 17.94%, compared to a base violent crime rate of 29.4%, that is, 11.46% below chance. In addition, the data point out that for every 2 future violent recidivists correctly identifi ed, another 9 will be erroneously classifi ed who would not be. Despite these data, the authors concluded that “the tool performed quite well in predicting risk in individuals who would actually relapse (77.15%), and it was acceptable in classifying as low risk the subjects who actually would not relapse (57.26%).” ( Capdevila et al., 2015, p. 237 ).
The violent criminal typology shows a low frequency with regard to general recidivism. For example, in Catalonia (Spain), this frequency ranges between 16.5% and 29.4% ( Capdevila et al., 2015 ; Luque et al., 2005 ). For this reason, sensitivity is usually good, but not specifi city, and the probability of including fake positives is a serious and unresolved problem. Indeed, authors such as Martínez (2014) , after carrying out an excellent review, indicated the dangers of trusting actuarial scales too much.
Considering these criticisms and limitations of actuarial scales, the objective of this study is to prove that the evaluation of the personality traits can be useful to predict delinquent recidivism, without the need for other risk factors, “ad hoc” constructs (e.g., “criminogenic needs” of Andrews & Bonta, 1995 ), or other specifi c scales, such as actuarial scales. To achieve this, instead of using the usual personality trait subscales, elaborated on the basis of general or clinical populations, this study starts from the basic information provided by the items that make up the psychometric instrument. Specifi cally, it is hypothesized that the items that make up the Cuestionario de Personalidad Situacional (CPS; Inventory of Risk Factors and Intervention in Prisons; Fernández, Seisdedos, & Mielgo, 1998 ) will make it possible to predict penitentiary recidivism in a broad sample of male inmates.
Method
Participants
The sample was composed of two groups of males: inmates (n = 1116) and general population (n = 1700). The inmates (M = 36.27 years old; SD = 9.64) were from 4 prisons in Catalonia (Spain) (97% from the Tarragona Prison). In the total sample, 138 participants had no prison records and were serving their sentences at the time of the study. The rest of the sample (n = 978) was divided into two groups according to the following defi nitions:
-
Recidivist (n = 568) (M = 35.96 years old; SD = 9.24). People who have served a sentence because of committing a crime and re-enter prison again for some other reason. This includes committing a new crime while the inmate is serving the sentence, escapes, and remand prisoners, who are released and re-enter again for another criminal case subsequent to the initial entry in prison.
-
Non-recidivist (n = 410) (M = 36.72 years old; SD = 10.16). People who enter prison because of some crime, are released, and do not re-enter prison due to a criminal case different from the initial one.
The control group was composed of a sample of male participants from different selection processes between 2007 and 2014, provided by TEA editions. They were randomly chosen and stratifi ed by age (M = 29.9 years old; SD = 9.35) and nationality, Spain (n = 1200) and 14 Latin American countries (n = 500). There was no information about their educational level, but the different selection processes ensured the inclusion of different educational levels, from primary to university levels.
Instruments
Cuestionario de Personalidad Situacional (CPS; Fernández et al., 1998 ). It is composed of 223 dichotomous items typifi ed in a sample of 39,641 Spanish people and grouped in 15 personality variables (emotional stability, anxiety, selfconcept, effectiveness, confi dence, independence, dominance, cognitive control, sociability, social adjustment, aggressiveness, tolerance, social intelligence, integrity and leadership), 3 measures of validity (sincerity, social desirability, and control of answers), and 5 second-order factors (adjustment, leadership, independence, consensus and extraversion). The interquartile range and the median of the reliability of the scales were: coeffi cient alpha (0.587; 0.83) and 0.725, respectively; testretest (0.89; 0.91) median: 0.89. Regarding validity, there is a wide range of correlations, according to the contrasted scales of two psychometric instruments: Questionnaire of Personality ( Eysenck & Eysenck, 1994 ) with a range: 0.77; -0.76, and the Clinical Analysis Questionnaire ( Krug, 1994 ), with a range: 0.64; -0.58. The CPS questionnaire was chosen for its ability to identify confl ictive inmates and predict regression in the penitentiary treatment ( Raya, Villacorta, & Medina, 2008 ), and its double typifi cation, in a Spanish general population and a penitentiary population ( Medina, 2013 ). In addition, measurements were obtained for the following variables (see Table 1 ): age (in years), educational level (elementary, secondary, mid-level, and higher), 8 criminal categories, and nationality (Spanish and non-Spanish). Penitentiary trajectory was added because it is strongly associated with recidivism, and it is the variation of the penitentiary treatment degree in the initial classifi cation. It was dichotomous, operationalized in two categories, no antecedents of degree regression or antecedents of degree regression.
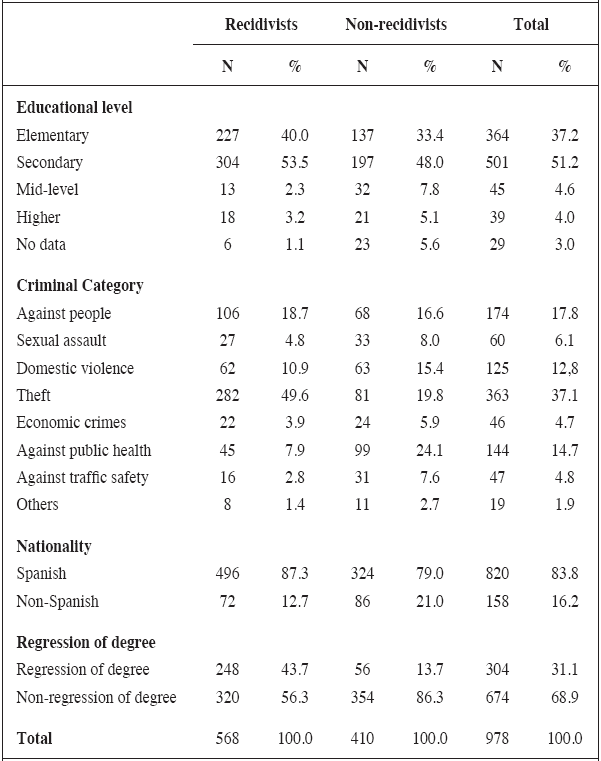
Note: The total sum of rates varies one decimal point due to the approximation error
Procedure
The inmates filled out the CPS in the real context of the prison over a period of 11 years (from 30/04/2004 to 31/06/2015). Regarding the recidivist inmates, the assessment was carried out before and after the crime was committed. Regarding the non-recidivist inmates, after checking the absence of a criminal record, the follow-up was carried out at least one year after the fi nal release (M = 1529 days; SD = 695; range 368-3882). In Catalonia, the majority of prisoners who served a fi rst conviction did not relapse, but it was noted that the ones who did so relapsed in an average of 359.25 and 637.8 days ( Capdevila et al., 2015 ; Luque et al., 2005 ).
Data analysis
The statistical analyses were performed using SPSS 15.0 in the following sequence:
- 1. Selection of the CPS items with a discriminative index > 0.1 in the penitentiary population (N = 1116). 209 items were obtained.
- 2. These items were introduced together as predictor variables in a logistic regression equation.
- 3. A score for each participant was calculated using the weighting coeffi cients of the logistic regression equation. This new synthetic variable, called “recidivism209”, was used to predict recidivism in an actuarial way. It means that an a posteriori probability calculation was made, once it had been verifi ed which participants were recidivist and nonrecidivist.
- 4. An ANOVA was performed to validate the hypothesis of the predicted model: the predictor variable (“recidivism209”) should discriminate between the recidivist and non-recidivist inmates. Simultaneously, there should be no differences between the non-recidivists (rehabilitated) and the control group (general population), or within the control group based on relevant characteristics, such as being Spanish or not.
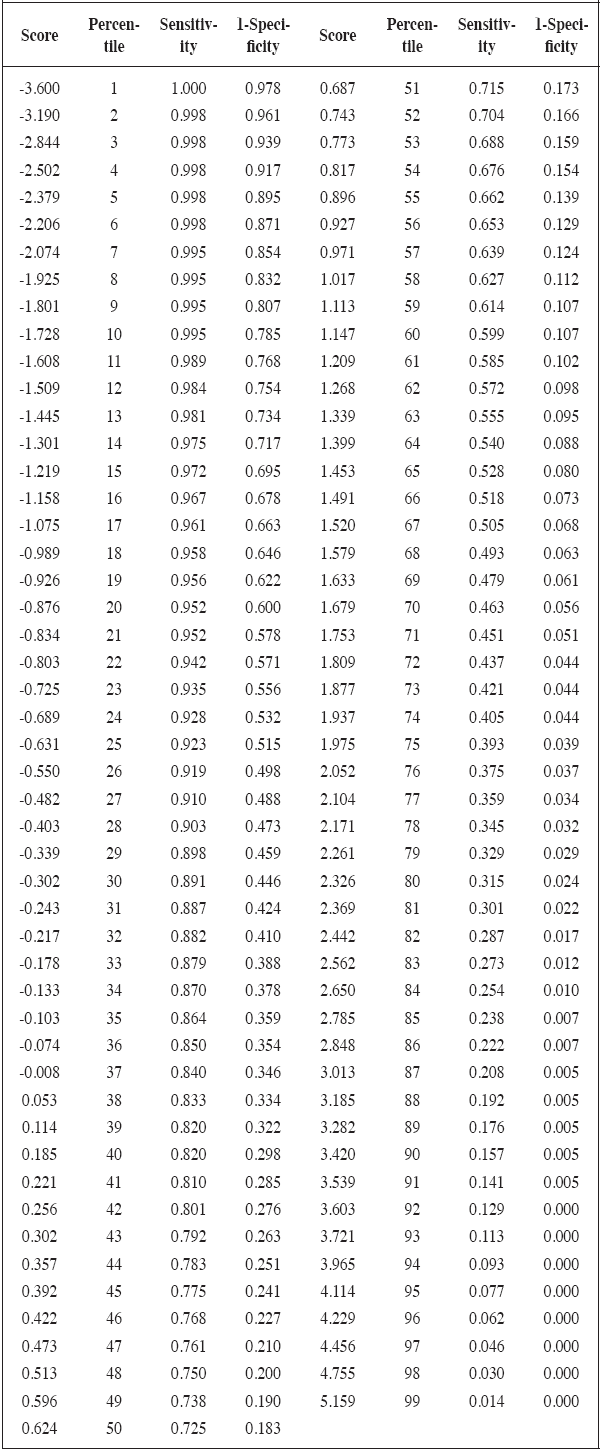
- 5. The score on the new predictor variable, using the coordinates of the ROC curve, makes it possible to individually calculate the sensitivity and specifi city. These were summarized using percentiles.
Results
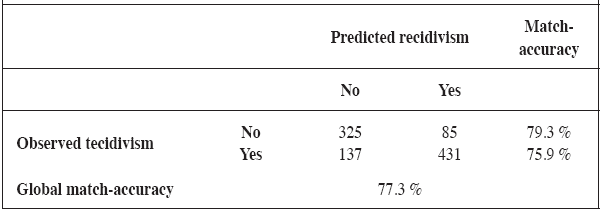
The indicators of the logistic regression equation were: χ2(209, 978) = 409.51, p<.001; test of Hosmer and Lemeshow: χ2 (8) = 2.907, p = .93; Nagelkerke’s R2 = 0.46. The match-accuracy is shown in Table 2 , and the B coeffi cients in Table 3 .
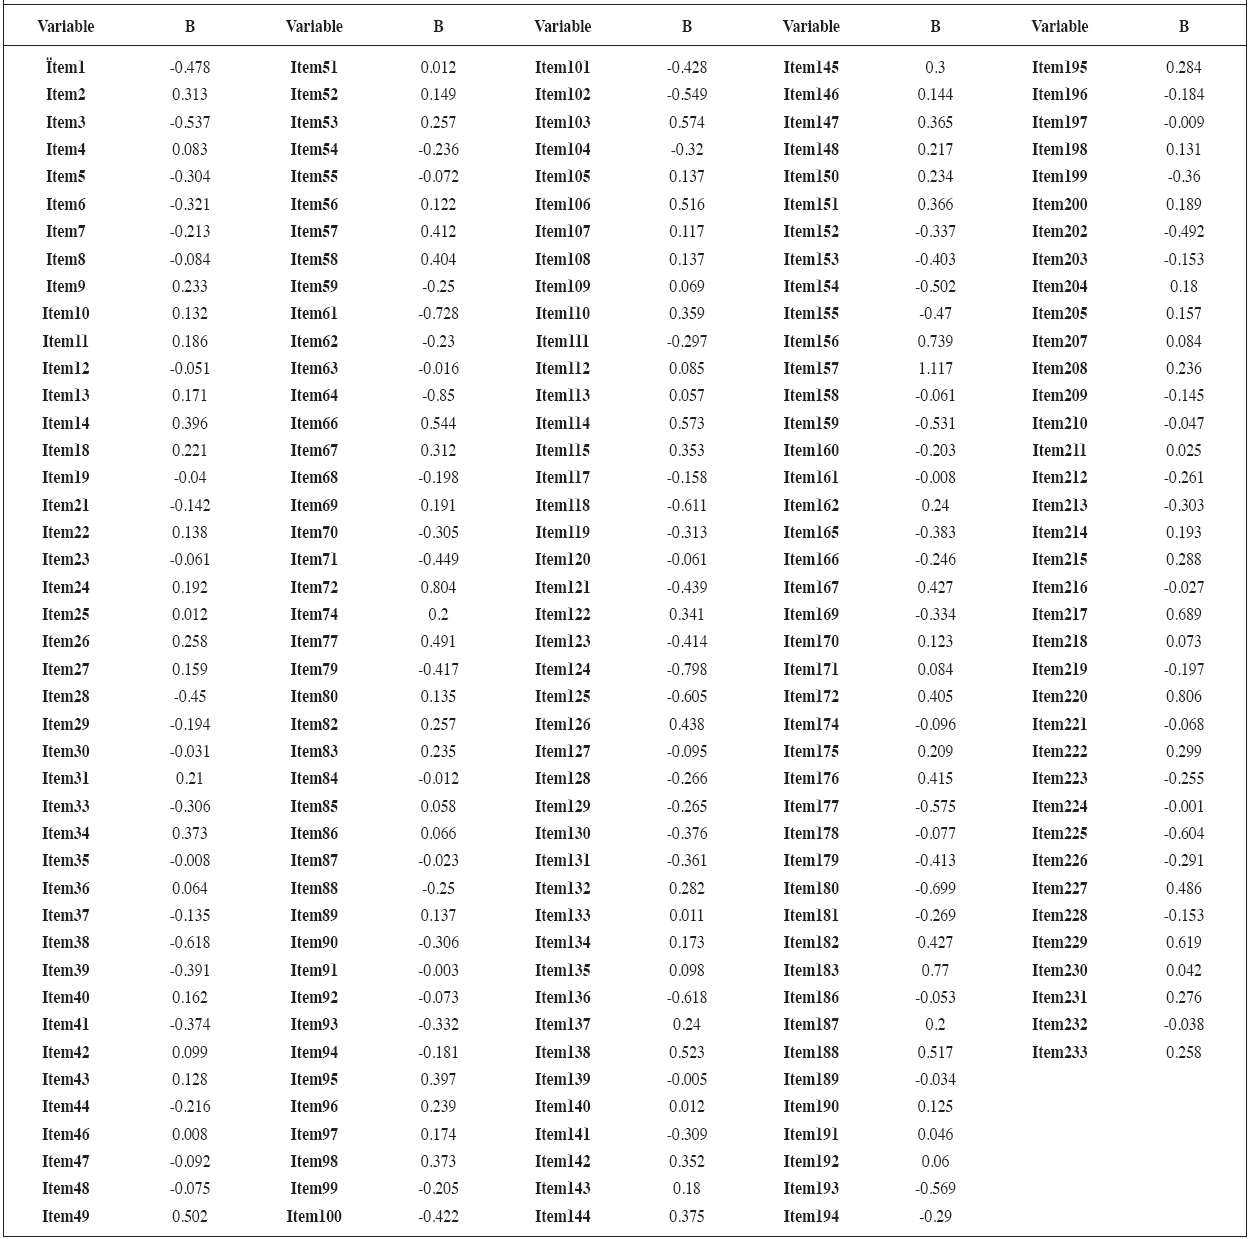
The discriminative capacity of the ROC curve of the predictor variable is shown in Figure 1 . The corresponding statistics are: AUC = 0.85, p<.001, Se = 0.012, 95% CI [0.826, 0.873]. An example of the process for calculating the score for “recivism209” using a participant’s CPS answers (e.g., item1: true; item2: false, (…), item233: false) is shown: 1) Score of the new variable using the coeffi cients from Table 3 is calculated. The “true” answer weight 1 and the “false” answer weight 2: -0.478.1+ 0.313.2 + (...) + 0.258.2 = 2.116). The values of the ROC curve coordinates. The value 2.116 is close to the percentile distribution (see Table 4 ). The closest score is Percentile = 77, which means that 77% of the participants have a score equal to or below 2.116 on “recidivism209”. The sensitivity is 0.359, which means that 35.9% of the recidivist participants have a value above 2.116. The probability of obtaining a false positive is shown in column “1-specifi city” of Table 4. The value is 0.034, and it is the probability of being recidivist when this is not true. In this example, this participant is probably going to be a recidivist inmate.
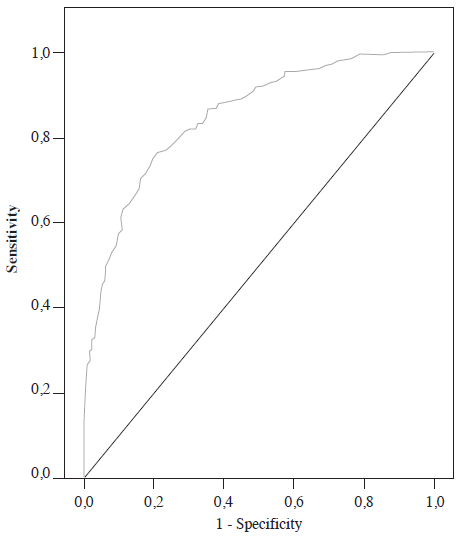
Figure 1
ROC Curve of the scores on “recidivism209” predicting penitentiary recidivism. Note: Area Under the Curve: 0.85
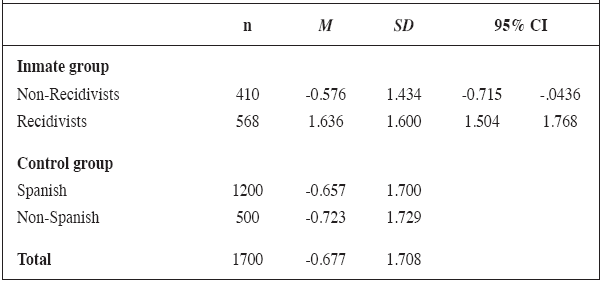
Validation of the predictive model . All the analyses supported the expected predictions: recidivist vs. non-recidivist, F(1, 976) = 496.14, p<.001; η2 = 0.34; non-recidivist vs. control group, F(1, 2108) = 1.22, p = .269; η2 = 0.001. The non-signifi cant difference between Spanish and non-Spanish participants within the control group was also supported, F(1, 1698) = 0.52; p = .47; η2 = 0.001. The descriptive statistics for the variable “recidivism209” are shown in Table 5 .
Discussion
This study demonstrates that a “general” personality questionnaire may help to predict something as complex as penitentiary recidivism. The selected items only meet a minimum requirement: having a discrimination index > 0.1. More than 99% of them are dynamic (e.g., they refer to editable variables), and they do not make a direct reference to any risk behavior (e.g., drug addiction) or criminal behavior. Furthermore, a broad, heterogeneous sample was used, higher than the scale average of any study included in the cited meta-analysis. The predictive precision level found has not often been surpassed by other scales in their respective specifi c areas. Some items have a weight that is as much as 1100 times greater than others, which would help to group them based on factors or traits, in order to achieve a more effi cient predictive scale.
The indicators of static or unmodifi able risks of the current actuarial scales reduce the scope of action of prison rehabilitation. Thus, criminal records and age have great predictive power ( Molleda, Rodríguez, Pérez, Sánchez, & Ovejero, 2013 ), especially in violent recidivism ( Graña et al., 2012 ; Nguyen et al., 2011 ), but not many possible actions exist to change them. This study points out the relevance of variables that are susceptible to change.
Another important problem is that the predictive studies of recidivism often confuse penitentiary recidivism (return to prison for committing a new crime) with criminal withdrawal (abandonment of the criminal career throughout the life cycle). Therefore, some inmates are considered “non-recidivist” when they are not, because although they have not entered prison again during the follow-up period established, they have a criminal record. Although recidivism and withdrawal are related, they are not equal constructs: a person does not cease to be a recidivist because he/she spends a period of time without returning to crime. This confusion interferes in the study of psychological dimensions that explain criminal behavior. Undoubtedly, the intimidating value of sending recidivists to prison again is lower than in the case of non-recidivists. What this study shows is that their personality profi les are probably different, providing greater predictive and rehabilitative ability.
Personality scales are constructed by grouping characteristics of items that are applied to standard or clinical samples. Thus, the alleged patterns of a possible “criminal personality” are hard to detect under the specifi c weight of the prison population compared to the general population. These factors would refl ect personal and social functioning, as a midpoint between the static and dynamic factors (Graña et al., 2013), to explain and predict recidivism and criminal withdrawal. These variables would indicate a balance between the intimidating values of imprisonment (sensitivity to punishment) and the incentive to achieve objectives by breaching the penal code (sensitivity to reward).
Studies that attempt to analyze and predict criminal recidivism have to deal with multiple biases (e.g., offenses and imprisonment backgrounds not registered in the database used as a source) because detecting all the crimes is impossible. Penitentiary recidivism as an indicator of delinquency is quite restrictive, in contrast to other possibilities (e.g., police and judicial recidivism), but it is also the most visible, easy to measure, and modifiable.
Moreover, another limitation of this study is that the minimum follow-up period was limited to one year, in order to not excessively reduce the sample. Future studies could use minimum follow-up periods of two years or more. In addition, this study has been limited to the territorial scope of Catalonia (Spain). It would be necessary to perform replications in other geographical areas, which would reduce many sources of error in the detection of itinerant criminal recidivism throughout the national territory.
Another weakness is that the prison sample used was not selected randomly, but rather based on its accessibility. Nonetheless, the reader can evaluate its representativeness by contrasting the relations between recidivism and the descriptive variables (penitentiary trajectory, education level, and nationality), and comparing the estimations obtained in other studies.
In conclusion, this study indicates that the CPS is a useful instrument for making predictions about penitentiary recidivism. The broad scope of implementation achieved in the male population (any criminal category, age, education level and nationality) facilitates its replicability in future studies and gives an important role to the personality construct in explaining criminal behavior, beyond other factors, both static and dynamic, contemplated in different criminological theories (e.g., Andrews & Bonta, 1995 ) and rehabilitation programs.
In the future, in addition to replicating the predictive capacity of the proposed items, it would be interesting to defi ne their content, which traits are grouped together and which ones are the best predictors, and their psychometric characteristics. All of this information is important in designing more effective prison rehabilitation strategies.
References
Andrés-Pueyo, A., & Echeburúa, E. (2010). Assessment of the risk of violence: Available instruments and indications for application. Psicothema, 22(3), 403-409.
Andrés-Pueyo, A., López, S., & Álvarez, E. (2008). Valoración del riesgo de violencia contra la pareja por medio de la SARA [Assessment of the risk of violence against the partner through the SARA]. Papeles del Psicólogo, 29(1), 107-122.
Andrews, D. A., & Bonta, J. (1995). The level of service inventory-revised. Toronto, Canada: Multi-Health Systems.
Boer, D. P., Hart, S., Kropp, P. R., & Webster, Ch. D. (1997). Sexual Risk Violence-20. Lutz, Florida: Psychological Assessment Resources.
Brouillette-Alarie, S., Proulx, J., & Benbouriche, M. (2013). Mieux saisir les outils actuariels: Une analyse factorielle de la Statique-99R [A better understanding of the actuarial tools: A factor analysis of Static-99R]. Criminologie, 46(1), 199-219.
Capdevila, M., Blanch, M., Ferrer, M., Andrés, A., Framis, B., Comas, B.,…, Mora, J. (2015). Tasa de reincidencia penitenciaria 2014 [Prison recidivism rate 2014]. Barcelona, Spain: Centre de Estudis Jurídics i Formacio Especialitzada.
Chico, E. (1997). The invariance in the factorial structure of the Raven in groups of criminals and non-criminals. Psicothema, 9(1), 47-55.
Echeburúa, E., Amor. P. J., Loinaz, I., & De Corral, P. (2010). Scale for the prediction of the risk of serious violence against the partner, Reviewed EPV-R]. Psicothema, 22(4), 1054-1060.
Eysenck, H. J., & Eysenck, S. B. G. (1994). Manual of the Eysenck Personality Questionnaire. California: EdITS/Educational and Industrial Testing Service.
Fazel, S., Singh, J. P., Doll, H., & Grann, M. (2012). Use of risk assessment instruments to predict violence and antisocial behaviour in 73 samples involving 24827 people: Systematic review and meta-analysis. British Medical Journal, 345(e4692), 1-12.
Fernández-Seara, J. L., Seisdedos, N., & Mielgo, M. (1998). CPS, Cuestionario de Personalidad Situacional [CPS, Situational Personality Questionnaire]. Madrid, Spain: TEA Ediciones.
Graña, J., Andreu, J., Silva, T., Pozuelo, F., Ruiz, A., Almeida, M.,..., Visdomine, J. (2012). Evaluación del riesgo delictivo en España [Evaluation of the crime risk in Spain]. Madrid, Spain: Ministerio del Interior, Secretaría General de Prisiones.
Kropp, P. R., & Hart, S. D. (2000). The Spousal Assault Risk Assessment (S.A.R.A.) Guide: Reliability and validity in adult male offenders. Law and Human Behavior, 24(1), 101-118.
Krug, S. E. (1994). CAQ. Cuestionario de Análisis Clínico (3ª edición revisada) [Clinical analysis questionnaire, 3rd reviewed edition]. Madrid, Spain: TEA Ediciones.
Luque, E., Ferrer, M., & Capdevila, M. (2005). La reincidencia penitenciària a Catalunya (1997-2002) [Penitentiary recividism in Catalunya 1997-2002]. Barcelona, Spain: Centre d’Estudis Jurídics i Formació Especialitzada.
Martínez, M. L. (2014). La incertidumbre de los pronósticos de peligrosidad: consecuencias para la dogmática de las medidas de seguridad [The uncertainty of forecasts of dangerousness: consequences for dogmatic security measures]. InDret, 2, 1-77.
Medina, P. M. (2013). Evaluación experimental de la efi cacia de los programas psicológicos de tratamiento penitenciario [Experimental evaluation of the effectiveness of psychological programs for prison treatment]. Madrid, Spain: Ministerio del Interior, Secretaria General Técnica.
Molleda, C. B., Rodríguez, F. J., Moral, M. D. L. V., Pérez, B., & Ovejero, A. (2013). Comportamiento delictivo reincidente. Análisis diferencial de la variable edad [Recidivist criminal behavior. Differential Analysis of the age variable]. Interamerican Journal of Psychology, 46(3), 365-374.
Nguyen, T., Arbach, K., & Andrés. A. (2011). Factores de riesgo de la reincidencia violenta en población penitenciaria [Risk factors of violent recidivism in a prison population]. Revista de Derecho Penal y Criminología, 3(6), 273-293.
Pelechano, V. (2008). Delincuencia, personalidad y psicopatología [Delinquency, personality and psychopathology]. Análisis y Modificación de Vonducta, 34(150-151), 13-66.
Raya, D., Villacorta, E., & Medina, P. (2008). Validació creuada en població penitenciaria de criteris psicomètrics i tècnics per la predicció de conductes adaptatives i factors de risc [Cross-validation in a prison population of psychometric and technical criteria for predicting adaptive behaviors and risk factors]. Barcelona, España: Centre d’Estudis Jurídics i Formació Especialitzada.
Sánchez-Teruel, D., & Robles-Bello, M. (2013). Model “Big Five“ personality and criminal behavior. International Journal of Psychological Research, 6(1), 102-109.
Singh, J. P., Grann, M., & Fazel, S. (2011). A comparative study of risk assessment tools: A systematic review and meta-regression analysis of 68 studies involving 25,980 participants. Clinical Psychology Review, 31(3), 499-513.
Webster, C. D., Douglas, K. S., Eaves, D., & Hart, S. (1997). HCR-20: Assessing risk for violence (version 2). Burnaby, British Columbia: Simon Fraser University.
Author notes
pmmg8@yahoo.es