DECIDING ON NULL HYPOTHESES USING P-VALUES OR BAYESIAN ALTERNATIVES: A SIMULATION STUDY.
Decisiones sobre hipótesis nulas usando p-valores o alternativas Bayesianas: un estudio de simulación.
DECIDING ON NULL HYPOTHESES USING P-VALUES OR BAYESIAN ALTERNATIVES: A SIMULATION STUDY.
Psicothema, vol. 30, no. 1, pp. 110-115, 2018
Colegio Oficial de Psicólogos del Principado de Asturias
Received: 22 August 2017
Accepted: 29 November 2017
Abstract: Background: The p-value is currently one of the key elements for testing statistical hypothesis despite its critics. Bayesian statistics and Bayes Factors have been proposed as alternatives to improve the scientific decision making when testing a hypothesis. This study compares the performance of two Bayes Factor estimations (the BIC-based Bayes Factor and the Vovk-Sellke p-value calibration) with the p-value when the null hypothesis holds. Method: A million pairs of independent data sets were simulated. All simulated data came from a normal population and different sample sizes were considered. Exact p-values for comparing sample means were recorded for each sample pair as well as Bayesian alternatives. Results: Bayes factors exhibit better performance than the p-value, favouring the null hypothesis over the alternative. The BIC- based Bayes Factor is more accurate than the p-value calibration under the simulation conditions and this behaviour improves as the sample size grows. Conclusions: Our results show that Bayesian factors are good complements for testing a hypothesis. The use of the Bayesian alternatives we have tested could help researchers avoid claiming false statistical discoveries. We suggest using classical and Bayesian statistics together instead of rejecting either of them.
Keywords: p-value, Bayes Factor, linear models, simulation, hypothesis tests.
Resumen: Antecedentes: el p-valor es hoy en día, pese a las críticas, uno de los elementos clave del contraste de hipótesis. La estadística Bayesiana y los factores de Bayes han sido propuestos como alternativas para mejorarlo. Este estudio compara la ejecución de dos factores de Bayes con el p-valor cuando la hipótesis nula es la más plausible. Método: se simularon un millón de pares de conjuntos de datos independientes procedentes de poblaciones normales y se consideraron diferentes tamaños muestrales. Se calcularon los p-valores para comparar las medias muestrales para cada par de muestras, así como las alternativas Bayesianas. Resultados: los factores de Bayes muestran mejor ejecución que el p-valor, favoreciendo la hipótesis nula frente a la alternativa. El Factor de Bayes basado en el BIC funciona mejor que la calibración del p-valor bajo las condiciones simuladas y su comportamiento mejora a medida que el tamaño de la muestra aumenta. Conclusiones: nuestros resultados muestran que los factores de Bayes son buenos complementos para el contraste de hipótesis. Su utilización puede ayudar a los investigadores a no caer en falsos descubrimientos estadísticos y nosotros sugerimos el uso conjunto de la estadística clásica y Bayesiana.
Palabras clave: p-valor, Factor de Bayes, modelos lineales, simulación, contraste de hipótesis.
Natural and social sciences seek to understand, explain and predict natural phenomena as well as to find socially relevant solutions to problems. To achieve its objectives, the scientific enterprise uses statistical analysis in combination with a specific form of reasoning based on deduction and induction. This interplay between deductive and inductive reasoning is considered the key core of statistical discovery in science (Box, 1976). However, some scholars think that the equilibrium between induction and deduction is unbalanced in favour of deductive reasoning procedures (Orlitzky, 2012). Additionally, it seems that statistical practise is becoming an automated process in which researchers tend to blindly use statistical knowledge to make decisions about their data (Gigerenzer, 1998, 2004).
The mainstream of statistical analysis is characterised by using the null hypothesis significance testing (NHST) procedure which have been the predominant option over the last 75 years. One of the key elements in the NHST scheme is the p-value as a tool to decide about the null hypothesis. But the p-value and its use have been extensively criticized, reviewed or questioned as an optimal model for making statistical decisions (i. e., Altman & Krzywinski, 2017a, 2017b; Bakan, 1966; Cohen, 1994; Dar, Serlin, & Omer, 1994; Halsey, Currant-Everett, Vowler, & Drummond, 2015; Nuzzo, 2014; Orlitzky, 2012; Rosnow & Rosenthal, 1989; Stern, 2016; Wagenmakers, 2007; Wasserstein & Lazar, 2016; Wilkinson & Task Force on Statistical Inference, 1999). There are several notable problems associated with p-values. Among the most prominent problems of p-value we could highlight that it is used in an all-or-nothing fashion to decide about statistical hypothesis (i. e., Masson, 2011; Stern, 2016) or that it has been understood as the probability that the null hypothesis is true (i. e., Cohen, 1994; Marden, 2000). In general, it seems that these problems with the p-value are generated at the educational context. For example, in a study carried out by Haller & Krauss (2002) it was shown that university students and professors shared similar misconceptions about the meaning and logic of the p-value.
The p-value is a conditional probability. Specifically, it is the probability of having observed the sample data, or some more extreme, if the null hypothesis was true. That is to say, P(D|H0). In frequentist terms, the p-value represents the number of times we would observe a sample statistic, or a more extreme one, in case the null hypothesis was true in population after we repeated one experiment many times under the same conditions. As a result, the lower the p-value the more unlikely would be the observed data in case the null hypothesis was true. That is the reason why the classical NHST is considered to not to provide information about the truth of the statistical hypothesis. As stated by Krzywinski & Altman (2013), this statistical viewpoint “does not tell us whether we are right. It tells us the chances of being wrong” (p. 809). The general recommendation is to use the p-value more sensibly avoiding misinterpretations, providing effect sizes, power and confidence interval estimations (i. e., Balluerka, Vergara, & Arnau, 2009; Gallistel, 2009; Wasserstein & Lazar, 2016; Wilkinson & Task Force on Statistical Inference, 1999). The controversy is currently so strong that the Basic and Applied Social Psychology journal (Trafimow, 2014) recommended their authors to use different statistical procedures to report their results. Finally, this journal decided to forbid any reference to the classical NHST procedure (Trafimow & Marks, 2015). However, as stated by Leek & Peng (2015) or Orlitzky (2012), the p-value issue is only the “tip of the iceberg” and prohibition is probably not the best solution.
One of the proposed alternatives to classic statistics based on NHST is to use Bayesian inference (i. e., Bakan, 1966; Balluerka et al., 2009; Cohen, 1994; Marden, 2000; Nuzzo, 2014; Stern, 2016; Trafimow & Marks, 2015; Wagenmakers, 2007; Wasserstein & Lazar, 2016). Bayesian statistic combines observed data with prior information about phenomena to make inferences by using the Bayes theorem. It is considered a common-sense approach to find evidences supporting statistical inferences (Anscombe, 1961; Bolstad, 2007; Edwards, Lindman, & Savage, 1963; Puga, Krzywinski, & Altman, 2015). Contrary to the p-value approximation, Bayesian statistics focuses on the probability of statistical hypothesis given sample data, P(Hi|D). Inside the Bayesian statistics framework, Bayes Factors have received plenty of attention as alternatives to the NHST procedure (i. e., Hoijtink, van Kooten, & Hulsker, 2016a, 2016b; Jarosz & Wiley, 2014; Morey & Rouder, 2011; Morey, Wagenmakers, & Rouder, 2016; Stern, 2016; Wagenmakers, 2007). In the context of null and alternative hypothesis tests, the Bayes Factor measures the amount of evidence favouring one hypothesis against another. For example, when we compute the Bayes Factor for H0 to H1 (BF01), we are finding the odds favouring the null hypothesis against the alternative [P(H0|D) / P(H1|D)]. Thus, the Bayes Factor represents how much likely is the null hypothesis given the observed data compared with the alternative one. In other words, “it is the factor by which prior odds is changed to the posterior odds” for an event (Bolstad, 2007, p. 70). As a result, the Bayes Factor is a quantitative measure informing about how the observed data have modified the odds of H0 independently of its prior probability, P(H0), (Held & Ott, 2018). When Bayes Factor equals one, data provide the same evidence for both hypothesis. However, when the BF01 is higher than one, the null hypothesis is more probable than the alternative one. For example, if we observed a BF01 = 5, we could conclude that the null hypothesis is five times more likely than the alternative.
Wagenmakers (2007), based on the model selection philosophy, proposed a method to compare the likelihood of the null and the alternative hypotheses using Bayes Factors. He suggested to use the Bayesian information criterion (BIC) to compute Bayes Factors for the null or the alternative hypothesis considering the variance components in linear models (Jarosz & Wiley, 2014; Masson, 2011). Wagenmakers’ proposal has several advantages and weaknesses. The most striking advantage is that computations are relatively simple by taking the outputs from classical tests (i. e., t test or ANOVAs) provided by common statistical software. However, the main drawback of his proposal is that the resulting Bayes Factor takes into account a default prior information which is still object of hot discussions (i. e., Hoijtink et al., 2016a, 2016b; Morey et al., 2016; Stern, 2016). Another simple way to compute a Bayes Factor approximation is by using the p-value calibration introduced by Sellke, Bayarri, & Berger (2001). The Sellke et al. (2001) p-value calibration (also known as “Vovk-Sellke maximum p-ratio” or VS- MPR) is a function of the p-value and it is interpreted as the lower bound of the Bayes Factor (favouring H0 to H1) for a wide range of different prior distributions (Altman & Krzywinski, 2017b). This calibration is simply computed by using the equation -e × p ×ln(p), where p refers to the p-value.
Our objective is to compare the decisions about the null hypothesis by using the p-value at different classically applied cut-offs with the BIC-based and p-value based Bayes factors described above (we are not interested in the epistemological discussion about the truth of the null hypothesis but the interested reader can find some reflections about it in Cohen, 1994; Gallistell, 2009, or Orlitzky, 2013). We will simulate situations in which the null hypothesis holds and compare how these statistics orient the decision making about the null hypothesis. We expect the decisions based on Bayes Factor estimations to be more accurate than those made by using the p-value. If Bayesian alternatives to classical p-values are useful and more accurate to make decisions about null hypothesis, experimental and observational researchers would benefit from them when making statistical inferences in their research. More specifically, researchers would benefit from those tools helping them not to claim false statistical discoveries.
Method
Procedure
A million data sets were simulated using the native functions implemented in the R software for statistical computing (version 3.3.3 for Windows, R Core Team, 2017). Each data set consisted on two random samples (s1 and s2) taken from normally distributed populations with parameters N(μ = 0, σ = 1) in both cases. Ten different sample sizes were simulated (5, 10, 15, 20, 40, 70, 100, 250, 500 and 1000) and one hundred thousand data sets were simulated per sample size. Simulations were generated using random seeds to simplify replication and source code is available on the Puga and Ruiz-Ruano (2017) Open Science Framework project.
Data analysis
Exact p-values were extracted from the fitted linear model comparing (bilateral contrasts) sample means (s1 and s2) on each one of the simulated datasets. Dichotomic dummy variables were also generated to record situations in which the p-value was equal or lower than the normally used cut-offs (.05, .01, .005 and .001) to make decisions about the null hypothesis. The value .005 was included to take into account the recent suggestion to reduce the threshold to claim new discoveries by Benjamin et al. (2017).
Two different Bayes Factors were computed. Firstly, the Wagenmakers (2007) BIC-based Bayes Factor was calculated from the variance components for each linear model comparing the two sample means. Secondly, the Sellke et al. (2001) p-value calibration (VS-MPR) was also computed. In this case, when p < 1/e, the value of the Bayesian calibration was coerced to 1, likewise it is done by JASP software (JASP Team, 2017). Both Bayes Factors were recorded to refer to evidences for the alternative hypothesis to the null (BF10) in order to simplify the comparison with p-values dummies. Although we are aware of the risks of using arbitrary cut-offs to interpret statistics in the context of statistical inference (see, for example, the discussion about that issue when considering the p-value in Rosnow & Rosenthal, 1989; or how Hoijtink et al., 2016, review this topic for Bayes Factors), we recoded both Bayes factors following the Jeffreys’ (1948) labelled intervals. As a result, a BF10 between 1 and 3 was considered anecdotal evidence for H1 to H0, from 3 to 10 was considered substantial, from 10 to 30 strong, from 30 to 100 very strong and higher than 100 decisive.
The R source code to perform all computations and recodifications is available on the Puga and Ruiz-Ruano (2017) Open Science Framework project.
Results
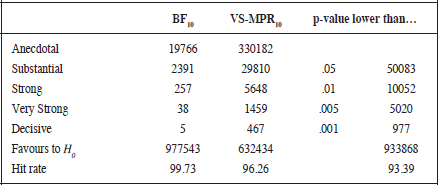
As can be seen in Table 1, the BIC-based Bayes Factor as well as the Vovk-Sellke Bayesian calibration produce the higher rates of correct inferences compared to the p-value. As expected, the error rate of the p-value is a function of the chosen cut-off point. The more restrictive the p-value, the less errors rejecting the H0. A similar trend is observed for Bayes factors, although a different behaviour is observed for BIC-based and p-value based Bayes Factor. Firstly, as can be seen in Table 1, whereas the Vovk-Sellke calibration produces a higher rate of anecdotal (33.02% of the times) evidence favouring H1 against H0 (which can be explained by the computation procedure, because when the p-value is higher than 1/e the value of this calibration is 1), the BIC-based Bayes Factor favours the alternative to the null 1.98% of the times. Secondly, the number of times (3.74%) that the VS- MPR finds substantial, strong, very strong or decisive evidences for H1 to H0 is always higher than those (0.27%) for the BIC-based Bayes Factor. If we consider the more restrictive decision point for both Bayes Factors, we can see that the BIC Bayes Factor only favours decisively the H1 five times, whereas the Vovk-Sellke do the same in 467 times. Additionally, see Table 1, using the .001 cut-off for the p-value produces 977 erroneous rejections of the null hypothesis.
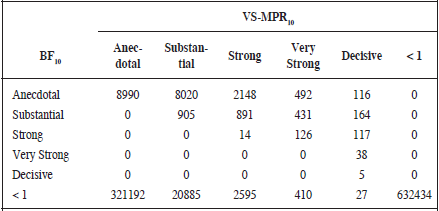
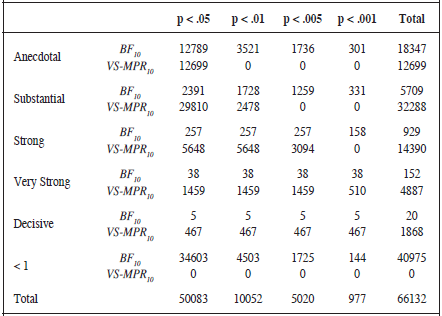
A closer look to the behaviour of both Bayes Factor estimations (Table 2) reveals that the BIC-based estimation tends to favour the H0 against the H1 when the p-value calibration finds substantial, strong, very strong or decisive evidences for H1. Thus, although there exists a positive relationship between both statistics (r= .62, 95% CI [.61, .62]), when the labels proposed by Jeffreys (1948) are used the concordance between them reduces (V = .33). Additionally, in Table 3 we can see that when the BIC Bayes Factor is categorised as anecdotal, the p-value still rejects the null hypothesis 12789 times at .05 cut-off, 3510 times at .01, 1736 at .005 and 301 times at .001 cut-off. However, when the Vovk-Sellke calibration considers a week or anecdotal evidence to H1, only the p-value at level .05 would reject the null hypothesis 12699 times. On the other hand, if we consider the more restrictive p-value (.001), we see that the BIC-based Bayes Factor performs better than the Vovk-Sellke calibration. Considering a .001 cut-off, there are 977 cases in which the p-value rejects the H0 whereas the BIC Bayes Factor favours H0 or considers an anecdotal evidence favouring H1 445 times.
Table 4 shows that the more restrictive cut-off for p-value or label for Bayesian alternatives, the less evidence against the null for all sample sizes. As expected, the p-value shows a constant trend of errors as sample size grows. That it is to say, independently of the sample size, the proportion of erroneously rejected null hypothesis is the same. The Bayesian p-value calibration follows the same trend but the number of errors reduces at different proportions depending on the Jeffreys’ label considered. On the other hand, the error rate for the BIC Bayes Factor reduces as the sample size increases. So, the bigger the sample size the less probable the BIC Bayes Factor provides evidence favouring the alternative hypothesis. On average (Figure 1), and considering the Jeffreys’ labels (1948), the Vovk-Sellke calibration always provides anecdotal evidences for H1 to H0 independently of sample size. On the contrary, the BIC-based Bayes Factor favours, on average, the null hypothesis for all sample sizes and its value decreases as sample size increases.
Note: The hit rate score for Bayes Factors was computed taking into account that an anecdotal evidence for H1 to H0 can be considered as an acceptable decision in this context
Note: < 1 indicates the number of times favouring the null hypothesis
Discussion
Our results show that Bayesian alternatives are more accurate to make decisions about the null hypothesis than the traditionally used p-values thresholds when there is no difference between two sets of observations. Therefore, from a practical or applied point of view, we could consider these alternatives as useful tools for researchers to avoid false discoveries claims. In a current situation in which replication is viewed as a problem threatening science reputation (i. e., Baker, 2016; Munafò et al., 2014, 2017; Nuzzo, 2015), statistical tools with these properties will help researchers when making statistical inferences. We have also observed that, although the Vovk-Sellke p-value calibration is better than the p-value to orient researchers’ decisions about the null hypothesis, the BIC-based Bayes Factor is more accurate in the situations we simulated. Our results show that the BIC Bayesian alternative works better as sample size becomes bigger. We also note that using the recently proposed (Benjamin et al., 2017) .005 cut-off for p-value still produces about six times more false discoveries than using the .001 cut-off. In any case, we agree Trafimow & Erap (2017) who suggest that using any arbitrary thresholds to control Type I is a matter which deserves careful discussion.
Note: < 1 indicates the number of times favouring the null hypothesis
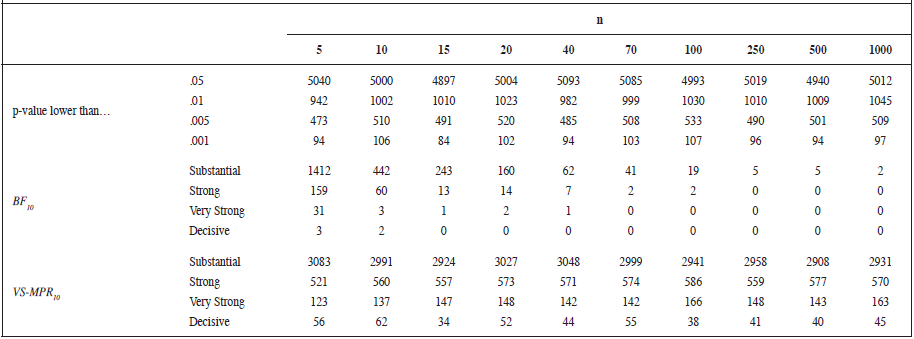
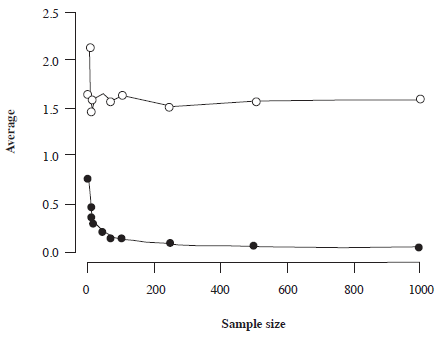
Figure 1.
Average Vovk-Sellke maximum p-ratio (white circles) and BIC- based Bayes Factor (black circles) as a function of sample size. Above one, the alternative hypothesis is favoured against the null, below one the null is supported against the alternative
Given that as sample size grows lower p-values are expected for small effect sizes (i. e., Marden, 2000; Morey & Rouder, 2011; Wagenmakers, 2007), future works should study whether our results hold at different effect sizes. An additional limitation of our study is we did not use Bayes Factors sensitive to prior distributions so future studies should address this issue.
There is not a commonly accepted alternative to the NHST procedure despite critics. Our data suggest that a Bayesian approach to statistical inference could be a good alternative. As Wagenmakers (2007) note, a feasible alternative to the classic NHST procedure should satisfy the following requirements: a) the approach should only depend on observed data, b) results must be independent of researchers’ intentions, c) the procedure must orient statistical decisions considering both null and alternative hypothesis, e) it should be easy to calculate, and f) it must be an objective procedure. The BIC-based approach to statistical inference we tested in this paper is possibly a good starting point with a great compromise between all these requirements. Although implementing such an innovation is not easy, we agree that the change should begin at educational level (Bolstad, 2007; Orlitzky, 2012). Bayesian statistics provides researchers the information they need when deciding about statistical hypothesis (Cohen, 1994) so introducing it in educational programs will be helpful for scientific progress. Unfortunately, it is relatively uncommon to see Bayesian contents in the syllabus of degrees or postgraduate programs in psychology. For example, Ord, Ripley, Hook, & Erspamer (2016) reported that Bayesian statistics is rarely presented in the APA-accredited doctoral programs in clinical and counselling psychology.
In our opinion, the use of the p-values as critical elements for decision making should be deinstitutionalized as suggested by Orlitzky (2012). Instead of banning or rejecting them at all (Trafimow & Marks, 2015), we agree Marden (2000) not to forget p-values and“not discardthep-value all together, but just be careful” (p. 1319). We think Bayes factors should be used as complements not as a simple alternative because the statistical inference can be enriched by using both approaches simultaneously. As suggested before, the progressive introduction of Bayesian inference in the mainstream of research practise is not easy and some disagreements should be fixed in the go (see, for example, Hoijtink et al., 2016). In any case, the evolution of personal computers allows nowadays the implementation of sophisticated analysis based on the subjective approach to statistical inference (Fienberg, 2006) in a similar vein the linear models are now plausible compared to the past (Cohen, Cohen, West, & Aiken, 2003) so time will tell whether Bayesian statistics becomes a key element into the researchers’ toolkit.
Acknowledgements
JLP was supported by grant PSI2014-53427-P from Ministry of Economy and Competitiveness (FEDER funding) and grant 19267/PI/14 from Fundación Séneca.
References
Altman, N., & Krzywinski, M. (2017a). Points of significance: P values and the search for significance. Nature Methods, 14, 3-4. doi:10.1038/nmeth.4120
Altman, N., & Krzywinski, M. (2017b). Points of significance: Interpreting P values. Nature Methods, 14, 213-214. doi:10.1038/nmeth.4210
Anscombe, F. J. (1961). Bayesian statistics. The American Statistician, 15, 21-24. doi:10.2307/2682504
Bakan, D. (1966). The test of significance in psychological research. Psychological Bulletin, 66, 423-437.
Baker, M. (2016, May 25). Is there a reproducibility crisis? Nature, 533, 452-454. doi:10.1038/533452a
Balluerka, N., Vergara, A. I., & Arnau, J. (2009). Calculating the main alternatives to null-hypothesis-significance testing in between-subjects experimental designs. Psicothema, 21, 141-151.
Benjamin, D. J., Berger, J., Johannesson, M., Nosek, B. A., Wagenmakers, E., Berk, R., …, Johnson, V. (2017, September). Redefine statistical significance. Nature Human Behaviour.doi:10.1038/s41562-017-0189-z
Bolstad, W. M. (2007). Introduction to Bayesian statistics (2nd ed.). Hoboken, NJ: Wiley.
Box, G. E. P. (1976). Science and statistics. Journal of the American Statistical Association, 71, 791-799.
Cohen, J. (1994). The Earth is round (p < .05). American Psychologist, 49, 997-1003.
Cohen, J., Cohen, P., West, S. G., & Aiken, L. S. (2003). Applied multiple regression/correlation analysis for the behavioural sciences (3rd ed.). New York: Routledge.
Dar, R., Serlin, R. C., & Omer, H. (1994). Misuse of statistical tests in three decades of psychotherapy research. Journal of Consulting and Clinical Psychology, 62, 75-82. doi:10.1037/0022-006X.62.1.75
Edwards, W., Lindman, H., & Savage, L. J. (1963). Bayesian statistical inference for psychological research. Psychological Review, 70, 193- 242.
Fienberg, S. E. (2006). When did Bayesian inference become “Bayesian”? Bayesian Analysis, 1, 1-40. doi:10.1214/0-BA101
Gallistel, C. R. (2009). The importance of proving the null. Psychological Review, 116, 439-453. doi:10.1037/a0015251
Gigerenzer, G. (1998). We need statistical thinking, not statistical rituals. Behavioral and Brain Sciences, 21, 199-200.
Gigerenzer, G. (2004). Mindless statistics. The Journal of Socio-Economics, 33, 587-606. doi:10.1016/j.socec.2004.09.033
Haller, H., & Krauss, S. (2002). Misinterpretations of significance: A problem students share with their teachers? Methods of Psychological Research Online, 7(1).
Halsey, L. G., Currant-Everett, D., Vowler, S. L., & Drummond, G. B. (2015). The fickled P value generates irreproducible results. Nature Methods, 12, 179-185. doi:10.1038/nmeth.3288
Held, L., & Ott, M. (2018). On p-values and Bayes factors. Annual Review of Statistics and Its Application, 5. doi:10.1146/annurev-statistics-031017-100307
Hoijtink,H.,vanKooten,P.,&Hulsker,K.(2016a).WhyBayesianpsychologists should change the way they use the Bayes Factor. Multivariate Behavioral Research, 51, 2-10. doi:10.1080/00273171.2014.969364
Hoijtink, H., van Kooten, P., & Hulsker, K. (2016b). Bayes factors have frequency properties-This should not be ignored: A rejoinder to Morey, Wagenmakers, and Rouder. Multivariate Behavioral Research, 51, 20- 22. doi:10.1080/00273171.2015.1071705
Jarosz, A., & Wiley, J. (2014). What are the odds? A practical guide to computing and reporting Bayes factors. Journal of Problem Solving, 7, 2-9. doi:10.7771/1932-6246.1167
JASP Team (2017). JASP (Version 0.8.1.2) [Computer software].
Jeffreys, H. (1948). Theory of probability (2nd ed.). Oxford: Oxford University Press.
Krzywinski, M., & Altman, N. (2013). Importance of being uncertain. Nature Methods, 10, 809-810. doi:10.1038/nmeth.2613
Leek, J. T., & Peng, R. D. (2015, April 28). P values are just the tip of the iceberg. Nature, 520, 612. doi:10.1038/520612a
Marden, J. I. (2000). Hypothesis testing: From p values to Bayes factors. Journal of the American Statistical Association, 95, 1316-1320.
Masson, M. E. J. (2011). A tutorial on a practical Bayesian alternative to null-hypothesis significance testing. Behavioral Research, 43, 679- 690. doi:10.3758/s13428-010-0049-5
Morey, R. D., & Rouder, J. N. (2011). Bayes Factor approaches for testing interval null hypothesis. Psychological Methods, 16, 406-419. doi:10.1037/a0024377
Morey, R. D., Wagenmakers, E., & Rouder, J. N. (2016). Calibrated Bayes factors should not be used: A reply to Hoijtink, van Kooten, and Hulsker. Multivariate Behavioral Research, 51, 11-19. doi:10.1080/00273171.2015.1052710
Munafò, M., Noble, S., Browne, W. J., Brunner, D., Button, K., Ferreira, J.,…, Blumenstein, R. (2014). Scientific rigor and the art of motorcycle maintenance. Nature Biotechnology, 32, 871-873. doi:10.1038/nbt.3004
Munafò, M., Nosek, B. A., Bishop, D. V. M., Button, K. S., Chambers, C. D., Percie du Sert, N., …, Ioannidis, J. P. A. (2017). A manifesto for reproducible science. Nature Human Behavior, 1, Article Number 21. doi:10.1038/s41562-016-0021
Nuzzo, R. (2015, October 7). Fooling ourselves. Nature, 526, 182-185. doi:10.1038/526182a
Nuzzo, R. (2014, February 12). Statistical errors: P values, the ‘gold standard’ of statistical validity, are not as reliable as many scientists assume. Nature, 506, 150-152. doi:10.1038/506150a
Ord, A. S., Ripley, J. S., Hook, J., & Erspamer, T. (2016). Teaching statistics in APA-accredited doctoral programs in clinical and counselling psychology: A syllabi review. Teaching of Psychology, 43, 221-226. doi:10.1177/0098628316649478
Orlitzky, M. (2012). How can significance tests be deinstitutionalized? Organizational Research Methods, 5, 199-228.
Puga, J. L., Krzywinski, M., & Altman, N. (2015). Points of Significance: Bayesian statistics. Nature Methods, 12, 377-378. doi:10.1038/nmeth.3368
Puga, J. L., & Ruiz-Ruano, A. M. (2017, October 30). Bayes Factor and P-value Comparison: A simulation study. http://doi.org/10.17605/OSF.IO/2E56P
R Core Team (2017). R: A language and environment for statistical computing. Vienna: R Foundation for Statistical Computing.
Rosnow, R. L., & Rosenthal, R. (1989). Statistical procedures and the justification of knowledge in psychological science. American Psychologist, 44, 1276-1284.
Sellke, T., Bayarri, M. J., & Berger, J. O. (2001). Calibration of p values for testing precise null hypothesis. The American Statistician, 55, 62-71.
Stern, H. S. (2016). A test by any other name: P-values, Bayes Factors and statistical inference. Multivariate Behaviour Research, 51, 23-39. doi:10.1080/00273171.2015.1099032
Trafimow, D. (2014). Editorial. Basic and Applied Social Psychology, 36, 1-2. doi:10.1080/01973533.2014.865505
Trafimow, D., & Earp, B. D. (2017). Null hypothesis significance testing and Type I error: The domain problem. New Ideas in Pychology, 45, 19-27. doi:10.1016/j.newideapsych.2017.01.002
Trafimow, D., & Marks, M. (2015). Editorial. Basic and Applied Social Psychology, 37, 1-2. doi:10.1080/01973533.2015.1012991
Wagenmakers, E. (2007). A practical solution to the pervasive problems of p values. Psychonomic Bulletin & Review, 14, 779-804. doi:10.3758/ BF03194105
Wasserstein, R. L., & Lazar, N. A. (2016). The ASA’s statement on p-values: Context, process, and purpose. The American Statistician, 70, 129-133. doi:10.1080/00031305.2016.1154108
Wilkinson, L., & Task Force on Statistical Inference (1999). Statistical methods in psychology journals. American Psychologist, 54, 594- 604.