ORIGINAL ARTICLE
Obesity versus underweight: the prognostic impact of body mass phenotypes in hospitalized older patients
Obesidade versus baixo peso: o impacto prognóstico de fenótipos de massa corporal em pacientes idosos hospitalizados
 Cláudia Porto Sabino Pinho
Roana Carolina Bezerra dos Santos
Stephany Beatriz do Nascimento
Letícia Sabino Santos
Taynara de Sousa Rego Mendes
José Reginaldo Alves de Queiroz
Maria Conceição Chaves de Lemos
Alcides da Silva Diniz
Poliana Coelho Cabral
Cláudia Porto Sabino Pinho
Roana Carolina Bezerra dos Santos
Stephany Beatriz do Nascimento
Letícia Sabino Santos
Taynara de Sousa Rego Mendes
José Reginaldo Alves de Queiroz
Maria Conceição Chaves de Lemos
Alcides da Silva Diniz
Poliana Coelho Cabral
Obesity versus underweight: the prognostic impact of body mass phenotypes in hospitalized older patients
Geriatrics, Gerontology and Aging, vol. 18, e0000143, 2024
Sociedade Brasileira de Geriatria e Gerontologia, SBGG
Received: 09 January 2024
Accepted: 12 February 2024
Abstract
Objective: To compare the frequency of underweight and obesity among previously hospitalized older adults and analyze their association with malnutrition, sarcopenia, frailty, inflammatory markers, and adverse outcomes both during hospitalization and after discharge.
Methods: This secondary analysis of a prospective study, conducted at Hospital das Clínicas da Universidade Federal de Pernambuco, Brazil, included hospitalized older patients (age ≥ 60 y). Nutritional status, body composition, sarcopenia, frailty, and outcomes were assessed. Cox regression was performed to evaluate the impact of the body mass phenotypes on clinical outcomes.
Results: This secondary analysis included one hundred patients. The prevalence of obesity was 22.10%, while that of underweight was 34.60%. Individuals with underweight had a higher frequency of weaker immune response, worse inflammatory profile, higher nutritional risk, higher frequency of sarcopenia and malnutrition, longer hospital stay, and a higher incidence of mortality when compared to those with obesity. Being underweight was independently associated with higher mortality rates, even after adjustment for age, sex, muscle mass, malnutrition, and diagnosis of malignancy [adjusted HR = 2.82 (95% confidence interval 1.03 — 7.72), p = 0.044].
Conclusion: The underweight phenotype represented a worst-case scenario in hospitalized older patients.
Keywords: Underweight+ obesity+ body composition+ mortality+ aging.
INTRODUCTION
Obesity and underweight are prevalent public health problems worldwide,1,2 particularly among older adults.3 These body mass phenotypes are associated with the exacerbation of several health conditions, including increased cardiovascular risk,4 greater functional impairment,5 higher burden of morbidity, and higher mortality rates.6 Both underweight and obesity can lead to significant physiological changes, including impairment of immune response and dysregulation of immune-inflammatory activities.7
In individuals presenting with underweight/malnutrition, lymphocytic cells decrease in quantity, effector action, and proliferation. Conversely, in obesity, lymphocytic cells appear to induce an increased inflammatory response. This inflammatory response includes the accumulation of macrophages in adipose tissue and can lead to insulin resistance.7 In acute care settings, such as hospitalization, these changes may contribute to the onset and worsening of several health conditions in older adults.8
Although the impact of underweight and obesity on the health of hospitalized older individuals is well established,9,10 there is still a lack of studies that directly compare the two conditions and their relationship with nutritional syndromes, unfavorable prognosis markers, and adverse outcomes. Therefore, further investigation is needed to better understand and compare how underweight and obesity can impact the overall health of older adults.
Recognizing the intricate connections between weight conditions (like underweight and obesity) and muscle abnormalities holds the potential to enhance diagnostic precision, facilitate timely intervention strategies, and mitigate potential complications. Considering this, our study endeavors not only to quantify the prevalence of underweight and obesity but also to conduct a thorough comparative analysis of their associations with malnutrition, sarcopenia, frailty, inflammatory markers, prognosis, and survival among older adults during hospitalization and in the post-discharge phase.
METHODS
This is a comparative secondary analysis of a prospective cohort study11,12 that assessed nutritional status and geriatric syndromes of inpatients who were previously admitted to the clinical and surgical wards of a university health center (Hospital das Clínicas) in Pernambuco, Brazil. The study included patients of both sexes aged 60 years or older who were hospitalized between May and October 2021. Patients who were clinically unstable or unable to complete the questionnaires were excluded from the baseline, as were those who could not undergo nutritional and anthropometric assessments.
This manuscript was reported in accordance with the STROBE (Strengthening the Reporting of Observational studies in Epidemiology) statement. The study was approved by the hospital Ethics Committee, in accordance with the Declaration of Helsinki (1964), its subsequent revisions, and Brazilian National Health Council Resolution no. 466/2012.
The patients analyzed herein were monitored throughout their hospitalization and for up to 22 months after discharge (length of follow-up expanded since the first analysis was conducted).11 The aim was to evaluate several outcomes, such as length of hospital stay (LOS), intensive care unit (ICU) admissions, hospital readmissions, functional capacity/dependency, and mortality. A LOS greater than 8 days (median) was considered prolonged.11,12 Functional capacity was evaluated using the Barthel Index; scores below 75 indicated greater functional dependence.13 Data on clinical outcomes were obtained from updated electronic medical records. Information on survival was double-checked through telephone interviews conducted with patients or their family members.
Anthropometric and body composition data, as well as the results of biochemical tests, were collected within 72 hours after hospital admission. Weight and height were measured to calculate the body mass index (BMI). Obesity was defined as a BMI ≥ 30 kg/m2, while underweight was defined as a BMI < 23 kg/m2, according to Pan American Health Organization (PAHO) criteria.14 The Short Mini Nutritional Assessment (MNA-SF) was employed to assess the nutritional status. Participants who scored 7 or lower were classified as malnourished.15
Calf circumference (CC) was measured using an inelastic tape at the widest part of the calf. CC was considered low if ≤ 34 cm for men and ≤ 33 cm for women.16,17 Mid upper arm circumference (MUAC) was measured and its adequacy verified by comparing to the 50th percentile of the reference standard for sex and age.18 Body fat percentage (%BF) and total body water (%TBW) were estimated by single-frequency bioelectrical impedance analysis (BIA-SF).
Functional muscle quality was measured using the Muscle Quality Index (MQI), which uses the ratio of muscle strength to skeletal appendicular muscle mass.19 Since there are no validated cutoff points for older individuals, MQI was categorized into tertiles and the lowest tertile (≤ 0.89) was adopted to indicate low muscle quality. MQI values were adjusted for age and sex using a statistical approach.
Sarcopenia was defined as the concomitant presence of low muscle strength and low muscle mass.20 Muscle strength was assessed using the handgrip strength (HGS) test measured by a JAMAR® digital dynamometer, following pre-established techniques; cutoff points of < 27 kg for men and < 16 kg for women were considered as reduced muscle strength (dynapenia).20 Skeletal muscle mass was calculated using the Sergi equation based on the resistance and reactance data obtained from BIA-SF. From this equation, the appendicular skeletal muscle mass index (ASMI) was calculated using the formula: [ASMI = skeletal muscle mass (kg)/ (height (m))2].16,20 Low muscle mass (myopenia) was defined as ≤ 7.7 kg/m2 in men and ≤ 5.62 kg/m2 in women.16
Frailty was evaluated using the Fried phenotype, which includes five criteria: unintentional weight loss, fatigue, muscle weakness, slow gait speed, and low physical activity. Those who presented at least 3 of these criteria were considered frail.21 Fatigue was defined based on self-reported exhaustion, indicated by two questions from the Center for Epidemiologic Studies-Depression Scale (CES-D).22 Muscle strength was obtained from HGS, using the technique and cutoffs described above. The level of habitual physical activity was assessed using the short version of the International Physical Activity Questionnaire in its short-form (IPAQ-SF). Individuals who engaged in less than 150 minutes of physical activity per week were considered insufficiently active,23 contributing to the frailty phenotype. Physical performance was measured by the gait speed (GS) test, following the model proposed by the International Academy on Nutrition and Aging (IANA).24 A GS < 0.8 meters/second was considered slow.20
The following variables were evaluated: sex, age, and presence of comorbidities such as hypertension (HTN), diabetes mellitus (DM), chronic kidney disease (CKD), and clinical diagnosis at hospitalization, according to electronic medical records. For analytical purposes, the clinical diagnosis was dichotomized into malignancies and non-malignant diseases. Complete blood count and serum levels of C-reactive protein (CRP) and albumin were recorded as biochemical data. The included prognostic variables were neutrophil-lympho-cyte ratio (NLR), lymphocyte-monocyte ratio (LMR), neutrophil-monocyte ratio (NMR), platelet-lymphocyte ratio (PLR), and systemic inflammation index (SII). Higher values (categorized into tertiles) in the leukocyte parameter ratios and SII were considered to denote worse inflammatory prognosis.
Data were analyzed in SPSS, version 20.0 (SPSS Inc., Chicago, IL, USA). All continuous variables were tested for normal distribution using the Kolmogorov-Smirnovtest.Those with normal distribution were described as means and standard deviations. Means were compared using Student's t-test for unpaired data. When variables had a non-normal distribution, they were described as medians and interquartile ranges and compared using the nonparametric Mann-Whitney U test.
Categorical analysis was carried out using various statistical tests, including the chi-square test and Fisher's exact test. Cross-product ratios, specifically the prevalence ratio (PR) for cross-sectional data and relative risk (RR) for prospective data, were estimated along with their corresponding 95% confidence intervals (95% CI). The Mantel-Haenszel chi-square test was employed to adjust the associations for age and sex. To assess the relationship between weight phenotypes and their impact on both mortality and prolonged LOS, hazard ratios (HRs) were calculated using Cox regression models. These analyses were conducted in both their crude form and after adjustment. Results with a p-value of less than 0.05 were considered statistically significant.
RESULTS
This secondary analysis involved 100 patients from the initial data-set who presented with underweight or obesity by BMI. Figure 1 illustrates the study flowchart. Most patients were male (57.00%), with a median age of 68 years, but with no difference between sexes. Further details about the characteristics of the patients included at baseline can be found in our previous studies.11,12
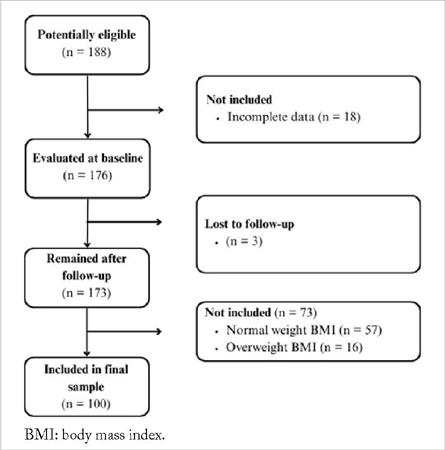
FIGURE 1
Study flowchart.
Regarding frequency of nutritional phenotypes, 22.10% (n = 39) of individuals had obesity and 34.60% (n = 61) had underweight, with no differences between sexes (p = 0.218). We analyzed the sociodemographic and clinical data of individuals with obesity and underweight to compare the two nutritional phenotypes.No significant differences were found between the two groups, except for a higher frequency of HTN in individuals with obesity (p < 0.05) (Table 1).
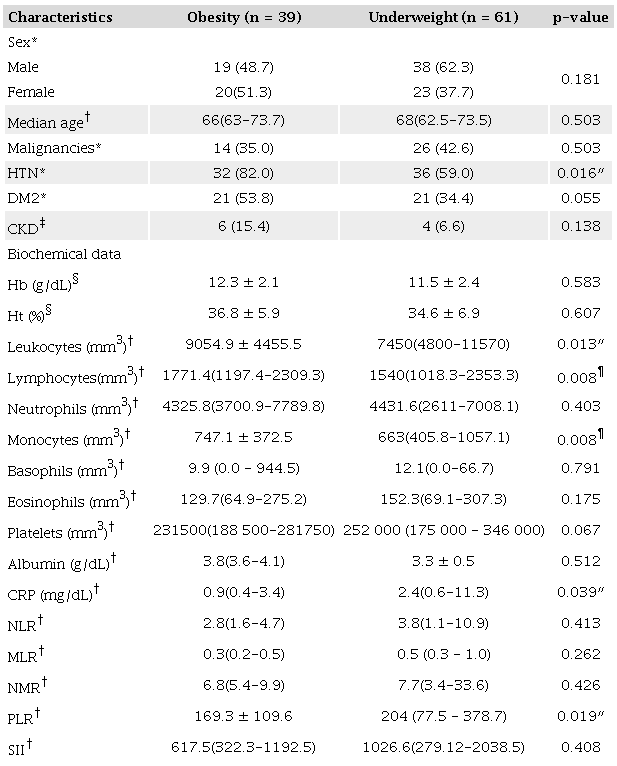
a *Pearson's chi-square test; † Mann—Whitney U test; ‡ Fisher's exact test; §Student's t-test; ″ Significant at the p<0.05 level; ¶ Significant at the p<0.01 level. Bold is used to emphasize significant p-values. HTN: Hypertension; DM2: Type 2 diabetes mellitus; CKD: Chronic kidney disease; Hb: Serum hemoglobin; Ht: Hematocrit; CRP: C-reactive protein; NLR: Neutrophil-to-lymphocyte ratio; MLR: Monocyte-to-lymphocyte ratio; NMR: Neutrophil-to-monocyte ratio; PLR: Platelet-to-lymphocyte ratio; SIL systemic inflammatory index.
The results of biochemical tests showed that individuals with underweight mounted an inferior immune response, as evidenced by a significantly lower white blood cell count compared to individuals with obesity (p < 0.05). On the other hand, individuals with underweight showed a worse inflammatory profile, with higher CRP levels and platelet-lymphocyte ratios (p < 0.05) (Table 1).
Individuals with the underweight phenotype exhibited lower adequacy of MAC, a higher frequency of low CC (even after adjustment for sex, age, and adiposity), lower body fat percentage, and a higher prevalence of dynapenia, low muscle mass, and sarcopenia, even after adjustment for age and sex (Table 2). Patients with the underweight phenotype also demonstrated a higher RR of prolonged LOS and an increased incidence of mortality, likewise adjusted for age and sex (Table 3).
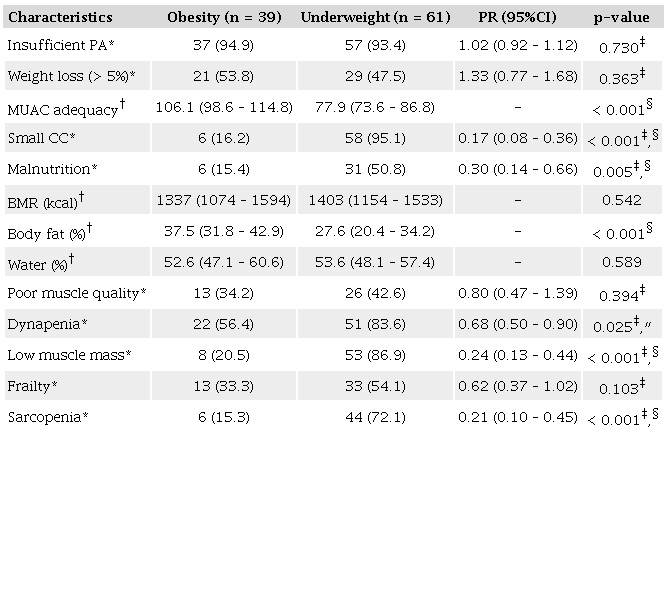
*Pearson’s chi-square test; †Mann–Whitney U test; ‡p-value adjusted for age and sex (Mantel–Haenszel chi-square test); §Significant at the p<0.01 level; ″ Significant at the p<0.05 level. Bold is used to emphasize significant p-values. Calf circumference was adjusted for age, sex, and body fat percentage to reduce the influence of adiposity in the analysis. PR: Prevalence ratio; CI: Confidence interval; PA: Physical activity; MUAC: Mid upper arm circumference; CC: Calf circumference; BMR: Basal metabolic rate.
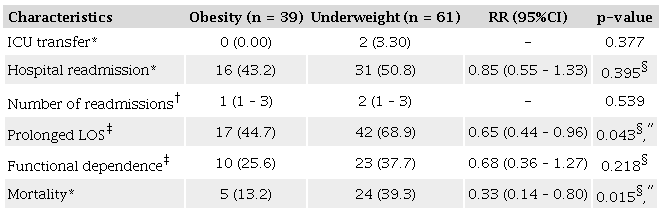
*Fisher’s exact test; †Mann–Whitney U test; ‡Pearson’s chi-square test; §p-value adjusted for age and sex (Mantel–Haenszel chi-square test); ″Signifcant at the p < 0.05 level. Bold is used to emphasize significant p-values. RR: Relative risk; CI: Confidence interval; ICU: Intensive care unit; LOS: Length of hospital stay.
Cox regression analysis was adjusted for sex, age, diagnosis of malnutrition, muscle mass, and diagnosis of malignancy to ensure the validity of our findings. Remarkably, even after these adjustments, the underweight phenotype remained significantly and independently associated with an increased incidence of mortality (Table 4). A similar approach was undertaken for the outcome of prolonged hospital stay. However, none of these variables were able to elucidate the variance in LOS.
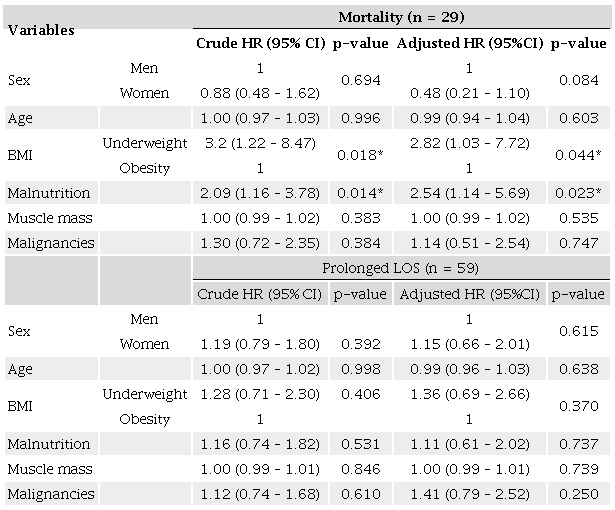
* Significant at the p < 0.05 level. Bold is used to emphasize significant p-values. HR: Hazard ratio; CI: Confidence interval; BMI: Body mass index. None of the variables was able to independently explain the prolonged length of hospital stay variable, either in the crude model or in the adjusted model (omnibus test of model coefficients p-value of 0.902).
DISCUSSION
Our study stands out for its comprehensive comparative analysis of body composition, inflammatory profile, prognosis, and survival of hospitalized older individuals with two prevalent body mass phenotypes: obesity and underweight. Our main results showed that individuals with underweight by BMI had the poorest clinical prognosis, worse nutritional status, and shorter overall survival.
To the best of our knowledge, this research aligns with a limited number of studies that have directly compared these two conditions, which are often considered opposites in terms of weight phenotypes. By investigating both underweight and obesity, our study provides a deeper understanding of the complex relationship between body mass and health outcomes in hospitalized older patients.
The decrease in white blood cell count (leukopenia) observed in patients with underweight in our study suggests that their immune response may be compromised, which, when coupled with a more severe inflammatory profile, leaves them more vulnerable to adverse events. Proper nutrition is essential for the optimal functioning of immune system cells, and malnutrition, which was prevalent in underweight, can lead to serious defects in these cells, particularly lymphocytes, which increases the risk of mortality due to a greater susceptibility to infectious diseases.7
Our findings confirmed that individuals with obesity had higher levels of monocytes, which, after tissue conversion, become macrophages, indicating a chronic inflammatory process. It is important to highlight that obesity is known to induce a low-grade chronic inflammatory response.25 However, individuals with underweight had a worse inflammatory status (as evidenced by higher CRP levels and platelet-to-lymphocyte ratio). Studies have shown that increased serum levels of CRP and a high platelet-to-lymphocyte ratio are associated with higher morbidity and mortality from all causes.26,27,28
Our findings reinforce the relevance of using biomark-ers as an integral part of the clinical evaluation of hospitalized older patients, as these parameters may be associated with nutrition and adverse outcomes. Considering that these markers can be easy to interpret, are inexpensive to measure, and are frequently requested in hospital/clinical environments, we posit that biomarkers may provide additional information on nutritional status and prognostic indicators for these patients, serving as a complementary assessment.
Our findings indicated that there was no significant difference in functional capacity, measured by the Barthel Index, between individuals with obesity and underweight. However, it is noteworthy that individuals with underweight had a more pronounced reduction in muscle mass and strength, as well as a higher prevalence of sarcopenia. These results highlight the importance of addressing underweight and its consequences, including the risk of sarcopenia and frailty, in order to promote better health outcomes in older adults.
Although sarcopenia and malnutrition can coexist with obesity,29 in our study these conditions were more frequent in individuals with underweight.This suggests indicates individuals with underweight may accumulate risk factors that can potentiate the association of this phenotype with adverse outcomes. Therefore, early identification of underweight and muscle syndromes in hospitalized older adults is pivotal, since malnutrition and sarcopenia may be related to a range of conditions that affect muscle health, functional capacity, quality of life, and clinical outcomes.30,31 However, it should be borne in mind that individuals with obesity are also not immune to geriatric and muscle syndromes and should not be excluded from evaluations and screening.29
Considering the follow-up during and after hospitalization, our observations revealed that being underweight represented a worst-case scenario. This is underscored by the fact that the underweight phenotype was independently associated with higher mortality rates, even after adjusting for age, sex, muscle mass, malnutrition, and a diagnosis of malignancy. Our findings lend credence to the concept of the "BMI paradox,"which posits a counterintuitive relationship between obesity and mortality in specific populations and contexts. For a more comprehensive discussion of this paradox, readers are encouraged to refer to a prior study by our group.11 However, it is essential to highlight that this paradox does not pertain solely to obesity. Research indicates a potential link between higher muscle mass, often found in conjunction with greater body weight, and a reduced risk of mortality among hospitalized individuals.32
Deepening this discussion, recent studies showed that malnutrition may be more determinative for poor health prognosis than obesity in older adults. The findings of Prausmüller et al. suggest that malnutrition may change the trajectory of outcomes in relation to BMI alone.33 Additionally, the authors highlighted that malnutrition may coexist with obesity, and this condition could express a greater risk and worse prognosis, overcoming the protective effect of excess weight.33 These findings emphasize the importance of identifying and properly treating malnutrition conditions in hospitalized older patients, regardless of their BMI on admission. However, it is crucial to note that our findings clearly indicate an association between weight phenotypes and mortality, even after accounting for adjustments.
Considering that underweight and malnutrition among geriatric populations often go unnoticed and are not adequately addressed,34 our findings underscore the imperative for healthcare professionals to engage in a thorough and precise evaluation of nutritional status. Our findings also highlight the need to carefully monitor older patients who are found to be underweight (BMI < 23), as this could indicate a challenging situation. Given that being underweight was associated with negative outcomes in our cohort, proper nutritional assessment of these patients should help develop effective interventions for preventing and managing nutritional issues, thereby lowering associated risks.
Our study has limitations to be acknowledged. First, the sample was recruited from a single center, which may limit the generalizability of the results to other populations of hospitalized older individuals. Another limitation is the use of BIA-SF and a nonspecific equation for our device to estimate muscle mass. Other relevant variables may have been omitted in our regression model, which could affect the associations found. Therefore, we reiterate the need for studies with more representative samples, the use of more accurate assessment methods, and the inclusion of additional variables for a comprehensive understanding of the role of different weight phenotypes in body composition, muscle function, prognosis, and survival.
On the other hand, there are also strengths to be highlighted. First, we used a prospective study design, which allowed for a longitudinal comparative analysis of health outcomes in relation to exposure to specific risk factors (namely, underweight and obesity). Additionally, the study covered a population - hospitalized older individuals - which is often underrepresented in studies that evaluate body composition and clinical outcomes. Finally, the conceptual and methodological model included a comprehensive set of variables, indices, and indicators, which provided greater accuracy, reliability, and internal validity in the results, while also expanding the range of analysis possibilities and the consistency of the resulting conclusions.
CONCLUSION
Our study sheds light on the pressing issue of underweight among hospitalized older adults, exposing its negative impact on clinical outcomes and its relationship with nutritional abnormalities and prognosis. The substantial prevalence of both overweight and underweight phenotypes in our population underscores the need for comprehensive interventions and policies addressing underweight and obesity as significant public health challenges.
REFERENCES
World Health Organization. Obesity and overweight fact sheet. Geneva: World Health Organization; 2021. Available from: https://www.who.int/news-room/fact-sheets/detail/obesity-and-overweight. Accessed Apr 12, 2023.
World Health Organization. Malnutrition fact sheet. Geneva: World Health Organization; 2023. Available from: https://www.who.int/news-room/fact-sheets/detail/malnutrition. Accessed Apr 12, 2023.
Burman M, Hörnsten C, Öhlin J, Olofsson B, Nordström P, Gustafson Y. Prevalence of obesity and malnutrition in four cohorts of very old adults, 2000–2017. J Nutr Health Aging. 2022;26(7):706-13. https://doi.org/10.1007/s12603-022-1820-x
Pereira JPC, Gomes ACB, Queiroz Júnior JRA, Nascimento TG, Luz MCL, Albuquerque MNL, et al. Dynapenic abdominal obesity is related to cardiovascular risk in older adults with Parkinson’s disease: a cross sectional study. Clin Nutr ESPEN. 2023;54:288-92. https://doi.org/10.1016/j.clnesp.2023.02.003
Roh E, Choi KM. Health consequences of sarcopenic obesity: a narrative review. Front Endocrinol (Lausanne). 2020;11:332. https://doi.org/10.3389/fendo.2020.00332
Sanchez-Rodriguez D, Locquet M, Reginster J, Cavalier E, Bruyère O, Beaudart C. Mortality in malnourished older adults diagnosed by ESPEN and GLIM criteria in the SarcoPhAge study. J Cachexia, Sarcopenia Muscle. 2020;11(5):1200-11. https://doi.org/10.1002/jcsm.12574
Gerriets VA , MacIver NJ. Role of t cells in malnutrition and obesity. Front Immunol. 2014;5:379. https://doi.org/10.3389/fimmu.2014.00379
Di Giosia P, Stamerra CA, Giorgini P, Jamialahamdi T, Butler AE, Sahebkar A. Te role of nutrition in inflammaging. Ageing Res Rev. 2022;77:101596. https://doi.org/10.1016/j.arr.2022.101596
Alexopoulos AS, Fayfman M, Zhao L, Weaver J, Buehler L, Smiley D, et al. Impact of obesity on hospital complications and mortality in hospitalized patients with hyperglycemia and diabetes. BMJ Open Diabetes Res Care. 2016;4(1):e000200. https://doi.org/10.1136/bmjdrc-2016-000200
Gümüşsoy M, Atmış V, Yalçın A, Bahşi R, Yiğit S, Arı S, et al. Malnutrition-sarcopenia syndrome and all-cause mortality in hospitalized older people. Clin Nutr. 2021;40(11):5475-81. https://doi.org/10.1016/j.clnu.2021.09.036
Pereira JPC, Diniz AS, Ramiro CPSP, Cabral PC. Abdominal obesity and hydration status as protective factors against mortality in older adults: a prospective study. Nutrition. 2023;116:112155. https://doi.org/10.1016/j.nut.2023.112155
Pereira JPC, Diniz AS, Lemos MCC, Ramiro CPSP, Cabral PC. Frailty but not low muscle quality nor sarcopenia is independently associated with mortality among previously hospitalized older adults: a prospective study. Geriatr Gerontol Int. 2023;23(10):736-43. https://doi.org/10.1111/ggi.14660
Minosso JSM, Amendola F, Alvarenga MRM, Oliveira MAC. Validação, no Brasil, do Índice de Barthel em idosos atendidos em ambulatórios. Acta Paul Enferm. 2010;23(2):218-23. https://doi.org/10.1590/S0103-21002010000200011
Organización Panamericana de la Salud. Oficina Sanitaria Panamericana, la Oficina Regional del Organización Mundial de la Salud. Encuesta Multicentrica Salud, Bienestar y Envejecimiento (SABE) en América Latina y el Caribe. Informe preliminar. In: XXXVI Reunión del Comité Asesor de Investigaciones en Salud; 2001 Julio; Kingston, Jamaica, 2001. Available from: https://www1.paho.org/Spanish/HDP/HDR/CAIS-01-05.PDF
Rubenstein LZ, Harker JO, Salvà A, Guigoz Y, Vellas B. Screening for undernutrition in geriatric practice: developing the short-form mini-nutritional assessment (MNA-SF). J Gerontol A Biol Sci Med Sci. 2001;56(6):M366-72 https://doi.org/10.1093/gerona/56.6.M366
Barbosa-Silva TG, Bielemann RM, Gonzalez MC, Menezes AMB. Prevalence of sarcopenia among community-dwelling elderly of a medium-sized South American city: results of the COMO VA I ? study: J Cachexia Sarcopenia Muscle. 2016;7(2):136-43. https://doi.org/10.1002/jcsm.12049
Pagotto V, Santos KF, Malaquias SG, Bachion MM, Silveira EA. Calf circumference: clinical validation for evaluation of muscle mass in the elderly. Rev Bras Enferm. 2018;71(2):322-8. https://doi.org/10.1590/0034-7167-2017-0121
World Health Organization. Physical status: the use of and interpretation of anthropometry, report of a WHO expert committee. Geneva: World Health Organization; 1995.
Lopes LCC, Vaz-Gonçalves L, Schincaglia RM, Gonzalez MC, Prado CM, Oliveira EP, et al. Sex and population-specific cutoff values of muscle quality index: results from NHANES 2011–2014. Clin Nutr. 2022;41(6):1328-34. https://doi.org/10.1016/j.clnu.2022.04.026
Cruz-Jentoft AJ, Bahat G, Bauer J, Boirie Y, Bruyère O, Cederholm T, et al. Sarcopenia: revised European consensus on definition and diagnosis. Age Ageing. 2019;48(1):16-31. https://doi.org/10.1093/ageing/afy169
Fried LP, Tangen CM, Walston J, Newman AB, Hirsch C, Gottdiener J, et al. Frailty in older adults: evidence for a phenotype. J Gerontol A Biol Sci Med Sci. 2001;56(3):M146-56. https://doi.org/10.1093/gerona/56.3.m146
Batistoni SST, Neri AL, Cupertino APFB. Validade da escala de depressão do Center for Epidemiological Studies entre idosos brasileiros. Rev Saúde Pública. 2007;41(4):598-605. https://doi.org/10.1590/S0034-89102007000400014
Benedetti TRB, Antunes PC, Rodriguez-Añez CR, Mazo GZ, Petroski ÉL. Reprodutibilidade e validade do Questionário Internacional de Atividade Física (Ipaq) em homens idosos. Rev Bras Med Esporte. 2007;13(1):11-6. https://doi.org/10.1590/S1517-86922007000100004
Abellan van Kan G, Rolland Y, Andrieu S, Bauer J, Beauchet O, Bonnefoy M, et al. Gait speed at usual pace as a predictor of adverse outcomes in communitydwelling older people an International Academy on Nutrition and Aging (Iana) Task Force. J Nutr Health Aging. 2009;13(10):881-9. https://doi.org/10.1007/s12603-009-0246-z
Hotamisligil GS. Inflammation, metaflammation and immunometabolic disorders. Nature. 2017;542(7640):177-85. https://doi.org/10.1038/nature21363
Ticinesi A, Lauretani F, Nouvenne A, Porro E, Fanelli G, Maggio M, et al. C-reactive protein (CRP) measurement in geriatric patients hospitalized for acute infection. Eur J Inter Med. 2017;37:7-12. https://doi.org/10.1016/j.ejim.2016.08.026
Mathur K, Kurbanova N, Qayyum R. Platelet-lymphocyte ratio (PLR) and all-cause mortality in general population: insights from national health and nutrition education survey. Platelets. 2019;30(8):1036-41. https://doi.org/10.1080/09537104.2019.1571188
Angioni D, Hites M, Jacobs F, De Breucker S. Predictive factors of in-hospital mortality in older adults with community-acquired bloodstream infection. J Frailty Aging. 2020;9(4):232-7. https://doi.org/10.14283/jfa.2019.45
Gao Q, Mei F, Shang Y, Hu K, Chen F, Zhao L, et al. Global prevalence of sarcopenic obesity in older adults: a systematic review and meta-analysis. Clin Nutr. 2021;40(7):4633-41. https://doi.org/10.1016/j.clnu.2021.06.009
Pereira JPC, Queiroz Júnior JRA, Medeiros LC, Bezerra GKA, Porto IVP, Cabral PC, et al. Sarcopenia and dynapenia is correlated to worse quality of life perception in middle-aged and older adults with Parkinson’s disease. Nutr Neurosci. 2023:1-9. https://doi.org/10.1080/1028415X.2023.2190246
Dent E, Wright ORL, Woo J, Hoogendijk EO. Malnutrition in older adults. Lancet. 2023;401(10380):951-66. https://doi:10.1016/S0140-6736(22)02612-5
Liu C, Wong PY, Chung YL, Chow SKH, Cheung WH, Law SW, et al. Deciphering the “obesity paradox” in the elderly: a systematic review and meta-analysis of sarcopenic obesity. Obes Rev. 2023;24(2):e13534. https://doi.org/10.1111/obr.13534
Prausmüller S, Heitzinger G, Pavo N, Spinka G, Goliasch G, Arfsten H, et al. Malnutrition outweighs the effect of the obesity paradox. J Cachexia Sarcopenia Muscle. 2022;13(3):1477-86. https://doi.org/10.1002/jcsm.12980
Guenter P, Abdelhadi R, Anthony P, Blackmer A, Malone A, Mirtallo JM, et al. Malnutrition diagnoses and associated outcomes in hospitalized patients: United States, 2018. Nutr Clin Pract. 2021;36(5):957-69. https://doi.org/10.1002/ncp.10771
Notes
This study was supported in part by the Coordenação de Aperfeiçoamento de Pessoal de Nível Superior (CAPES), Brazil (Finance Code 001). The supporting source had no involvement or restrictions regarding this publication.
All procedures performed in this study were in accordance with the ethical standards of the institutional and/or national research committee and with the 1964 Helsinki declaration and its later amendments or comparable ethical standards. Data collection was performed after consideration and approval by the Research Ethics Committee. This study was approved by the ethics committee of the respective institutions. All patients provided their written informed consent.
This manuscript was reported in accordance with the STROBE (Strengthening the Reporting of Observational studies in Epidemiology) statement.
Author notes
Correspondence data Jarson Pedro da Costa Pereira — Avenida Professor Moraes Rego, 1235 — Cidade Universitária- CEP: 50670-901 - Recife (PE), Brazil. E-mail: jarsoncostap@gmail.com
Conflict of interest declaration
The authors declare no conflict of interest.