Artigos
Tax burden borne by electricity and mining companies in Peru during 2010-2015 period
Pressão fiscal enfrentada pelas entidades elétricas e minerárias do Peru durante o período 2010-2015
La presión fiscal soportada por las empresas eléctricas y mineras del Perú durante el periodo 2010-2015
Tax burden borne by electricity and mining companies in Peru during 2010-2015 period
Revista Contemporânea de Contabilidade, vol. 15, no. 37, pp. 71-84, 2018
Universidade Federal de Santa Catarina
Received: 04 July 2018
Revised document received: 26 October November 2018
Accepted: 25 February 2019
Abstract: The main objective of the research is to quantify the tax burden borne by the electricity and mining companies operating in Peru during the 2010-2015 period, in order to assess the existence of differences between the two economic sectors analyzed. For this purpose, a description of the electricity and mining sectors is presented, as well as the evolution and influence that they exert in the economic growth of Peru. As an important element of the research, an analysis of the tax legal framework regulating the activities of the companies of the two sectors analyzed has been performed, in particular, with regard to Income Tax. The theoretical framework incorporates the main references related to the Effective Tax Rate (ETR), which is the indicator used in the research. The statistical analysis of the data reveals that, on average, the profits of the mining companies bear a tax burden higher than those of the electricity sector companies during the entire period under study.
Keywords: Tax burden, Effective tax rate, Electricity sector, Mining sector.
Resumo: O objetivo principal da pesquisa é quantificar a pressão fiscal suportada pelas empresas elétricas e de mineração que operam no Peru, no período 2010-2015, de tal forma que a existência de diferenças entre os dois setores econômicos analisados possa ser avaliada. Para este propósito, é apresentada uma descrição do setor elétrico e de mineração, bem como a evolução e influência que exercem sobre o crescimento econômico do Peru. Como elemento importante da investigação, foi realizada uma análise do arcabouço jurídico tributário que regula as atividades das empresas dos dois setores analisados, em especial, no tocante ao Imposto de Renda. O referencial teórico incorpora as principais referências vinculadas à Taxa Tributária Efetiva (SIT), que é o indicador utilizado na pesquisa. A análise estatística dos dados revela que, em média, os benefícios das empresas de mineração têm uma carga tributária maior do que os das empresas do setor elétrico durante todo o período em estudo.
Palavras-chave: Pressão fiscal, Taxa efetiva de imposto, Setor elétrico, Setor de mineração.
Resumen: La investigación tiene como objetivo principal cuantificar la presión fiscal soportada por las empresas eléctricas y mineras que operan en Perú, durante el periodo 2010-2015, de tal forma que se pueda evaluar la existencia de diferencias entre los dos sectores económicos analizados. Para tal efecto, se presenta una descripción del sector eléctrico y del minero, así como la evolución e influencia que ejercen en el crecimiento económico del Perú. Como elemento importante de la investigación, se ha realizado un análisis del marco legal tributario que regula las actividades de las empresas de los dos sectores analizados, en particular, en lo referente al Impuesto a las ganancias. El marco teórico incorpora las principales referencias vinculadas a la Tasa Impositiva Efectiva (TIE), que es el indicador utilizado en la investigación. El análisis estadístico de los datos revela que, por término medio, los beneficios de las empresas mineras soportan una carga tributaria superior a los de las compañías del sector eléctrico durante todo el periodo objeto de estudio.
Palabras clave: Presión fiscal, Tasa impositiva efectiva, Sector eléctrico, Sector minero.
1. Introduction
1.1 Justification
Mining activity has become of great importance in the growth and economic development of Peru, since it constitutes one of the main sources of income for the country and has a great connection with investment, exports, taxes and formal employment. These aspects have been influenced in the last decades by the increase of the international prices, even in spite of the decrease experienced due to the end of the boom originated by commodities, as a consequence of the slowdown of the Chinese economy. The levels of investment, production and exports in the mining sector are closely linked to the collection of taxes and job generation, which demonstrates the importance of mining activity in the Peruvian economy (Osinergmin, 2016).
Figure 1 shows the level and growth of mining investments in the last fifteen years in Peru, which is a factor that demonstrates the importance of this activity in the Peruvian economy.
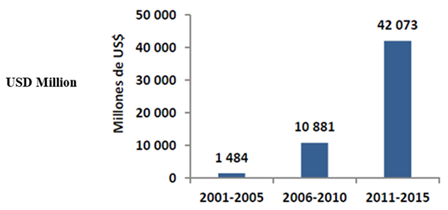
Figure 1
Investment Evolution in the Mining Sector
Source: Osinergmin (2016)
Mining activity is one of the sectors that contributes most to GDP growth, it is estimated that, in 2016, its participation in this indicator reached 32%, one percentage point more than the percentage it represented in 2014, even in spite of the international decrease in prices (Confiep 2016). Likewise, with respect to the participation of the mining sector in the GDP of the country, it is one of the main activities in the percentage structure of the sector, being surpassed only by the sector “other services” (including taxes) and by the “manufacturing” sector, as can be seen in Table 1 on GDP according to economic activity, for the period between 2011 and 2015.
On the other hand, electrical power generation is a strategic sector for the development of the majority of economic activities in any country. In the Peruvian case, the situation is not different, so in recent years there has been a significant growth of the sector boosted by the increase in domestic demand linked to the economic development of some sectors. According to information contained in the National Energy Plan 2014-2025 prepared by the Ministry of Energy and Mines, in the 2003 to 2013 period, electricity production increased by 92%. While in 1993 the average national electricity coverage was 57%, it went to 91% in 2013, with a projection to reach 100% as part of the policy of social inclusion of energy developed in our country (Ministry of Energy and Mines 2014).
| Concept | 2011 | 2012 | 2013P/ | 2014P/ | 2015E/ |
| Gross Domestic Product | 100.0 | 100.0 | 100.0 | 100.0 | 100.0 |
| Agriculture | 5.5 | 5.6 | 5.3 | 5.3 | 5.2 |
| Fishing | 0.7 | 0.4 | 0.5 | 0.3 | 0.4 |
| Extraction of Oil and Minerals | 12.5 | 12.0 | 11.9 | 11.4 | 12.1 |
| Manufacturing | 15.7 | 15.0 | 14.9 | 14.4 | 13.7 |
| Electricity and Water | 1.7 | 1.7 | 1.7 | 1.7 | 1.8 |
| Construction | 6.1 | 6.6 | 6.8 | 6.8 | 6.2 |
| Trade | 10.7 | 10.9 | 10.8 | 10.8 | 10.9 |
| Public Administration and Defense | 4.8 | 4.9 | 4.8 | 5.0 | 5.0 |
| Other Services 1/ | 42.3 | 42.9 | 43.3 | 44.3 | 44.7 |
Nevertheless, as shown in Table 1, the GDP of the electricity and water sector occupies one of the last positions in the percentage share of this indicator, surpassing only the Fishing sector. However, as indicated in the previous paragraph, the electric power sector has shown a significant growth in recent years and becomes a priority axis for supporting social development and for the growth of other important sectors of the Peruvian economy.
These factors have been decisive for selecting companies that are included in both sectors, in order to analyze the impact of the income tax on their results.
1.2 Legal Framework
a) Income Tax
Mining companies residing in Peru are subject to an income tax on their world-wide source income. Foreign companies with branches and permanent establishments in Peru shall be taxed on their income from Peruvian sources. Levied income for the purposes of calculating the Corporate Income Tax is reduced by expenses and/or costs necessary to maintain the source of revenue.
On December 31, 2014, Law No. 30296 was enacted, which promotes the reactivation of the economy, modifying the rate of income tax by domiciled companies, which shall be determined applying the rate of 28% for the period 2015 and 2016, replacing the rate of 30% that was in effect.
Likewise, non-domiciled companies receiving dividends and other forms of distribution of profits from companies shall be taxed at a rate of 6.8% as of fiscal year 2015, instead of the rate of 4.1% that was in effect.
It is worth mentioning that, on December 10, 2016, Legislative Decree No. 1261 was published, which amends the Income Tax Law, by which normative changes are established that shall come into effect as of January 01, 2017. Among the main changes is the increase in the third-category income tax rate to 29.5%. With respect to dividends, the rate was reduced to 5% instead of the current rate of 6.8%.
b) Agreements to promote investment
On June 17, 1991, during the government of Alberto Fujimori, Law No. 25327 was enacted, which is the Law on Parliamentary Control, on the normative acts of the President of the Republic, through which power was delegated to the Executive Branch in order to achieve the national pacification, employment growth and private investment.
In this context, Legislative Decree No. 662 - Law on the Promotion of Foreign Investment was published on September 02, 1991, and Legislative Decree No. 757 Framework Law for the Growth of Private Investment was published on November 13, 1991, with which a stability regime is implemented through the signing of legal stability agreements between the companies and the Peruvian State.
Likewise, in order to promote mining investments in the country, on June 04, 1992, Supreme Decree No. 014-92-EM Single Uniformed Text of the General Mining Law was published, through which it was possible that the mining companies could enjoy a secure fiscal framework, through the signing of tax stability agreements with the State.
With the enactment of these rules of investment promotion, it was sought to provide stability to investors in a country that, at the beginning of the 1990s, did not provide legal security for an adequate return of private investment.
Legal Stability Agreements under the General Regime
They are agreements managed by the Agency for the Promotion of Private Investment - PROINVERSION, which grant certain guarantees to foreign and national investors who intend to carry out economic activities linked to any sector, in order to provide a regime of stability. The main characteristics of these agreements are presented in table 2.
| Legal Stability: 10 years counted as from the Agreement execution. | |
| Investment | |
| USD 10 million | Execution within a term no longer than 2 years from Agreement execution. |
| Benefits | |
| Foreign Investors | Investment Recipient Companies |
| Stability in Income Tax system in force at the time of Agreement execution. | Stability in Income Tax system in force at the time of Agreement execution. |
| Free disposition of currency. | Stability of workers’ hiring systems. |
| Free remittance of profits, dividends and capitals. | Stability of export systems. |
| Use of the most favorable exchange rate in the market. | |
| Non-discrimination between foreign and domestic investors. |
Tax Stability Agreements under General Mining Law
Agreements managed by the investors before the Ministry of Energy and Mines (MEM), applicable to entities carrying out mining activities and desiring to have stability in investments in tax, exchange and administrative scope. The most relevant characteristics of these agreements are described in Table 3.
| Stability Contracts | ||
|---|---|---|
| 10 years | 12 years | 15 years (*) |
| Operations of more than 350 TM/day - 5,000 TM/ day or investment programs equal to USD 20 million. | Operations with initial capacity of less than 5,000 TM/day and investment programs equal to USD 100 million for companies that start operations and USD 250 million for already existing ones. | Operations with initial capacity of no less than 15,000 TM/day or extensions with capacity of no less than 20,000 TM/day. |
| Benefits | ||
| - Stability in Income Tax System. | ||
| - Stability in export systems. | ||
| - Stability in special systems - Tax reimbursement. | ||
| - Stability in consumption taxes (IVA & ISC). | ||
| - Administrative stability. | ||
| - Free disposal of currencies. | ||
| - Non-discrimination in exchange rate. | ||
| - Free trade of mineral products. |
c) Special Tax System for the mining industry
Peru, like other surrounding countries that have mining as one of their main economic activities, receives income from this sector, mainly, for three types of taxes: income, withholdings to non-domiciled and royalties.
In September 2011, by Law No. 29788, which amends Mining Royalty Law No. 28258; by Law No. 29789 which creates the Special Tax on Mining and by Act No. 29790 which establishes the Legal Framework of Special Lien on Mining; a special tax system applicable only to the mining industry is introduced in Peruvian tax legislation. The objective of this new system is to provide additional resources to the Peruvian State for the financing of social programs that help to reduce poverty in the country. The most relevant characteristics of this system are shown in Table 4.
| Mining Royalty | Special Mining Tax | Special Lien on Mining (*) |
|---|---|---|
| Taxable base: | ||
| Quarterly Income from Operations | Quarterly Income from Operations | Quarterly Income from Operations |
| Rate - Accumulative progressive scale: | ||
| 1% - 12% | 2% - 8.4% | 4% - 13.12% |
The amount effectively paid shall be considered as deductible for the establishment of Income Tax of mining companies.
d) Tax benefit for power generation companies
Companies in the power generation sector are governed by the general rules of Income Tax and, unlike the mining sector, they only have the additional tax benefit granted by Legislative Decree No. 1058 which promotes investment in the activity of power generation with water resources and other renewable resources, which allows an annual rate of accelerated depreciation not higher than twenty percent (20%), as an annual global rate applicable to plants that enter into commercial operation as of said decree. Through the publication of Law No. 29764 dated July 22, 2011, the validity of this tax benefit is extended until December 31, 2020.
1.3 Objectives of the research
According to the context described in the justification, the objectives of the work shall be:
- 1. a) To quantify the tax burden borne by the business profits of Peruvian electricity and mining companies during the 2010-2015 period;
- 2. b)To evaluate if there are significant differences both in comparing the different years within each sector, and at the global level between both sectors of activity.
2 Effective Tax Rate
In order to analyze the tax burden actually borne as a result of a specific tax, in addition to the nominal rate set forth in the corresponding regulations, it is necessary to consider other additional issues, such as the possible existence of incentives or surcharges that may affect the amount finally paid by the taxpayer. Thus, the tax burden actually borne shall be given by the Effective Tax Rate (ETR), which shall be the ratio between the tax burden finally borne and the taxable base that has generated it.
In the field of corporate taxation, since the US Securities and Exchange Commission (SEC), in its ASR No. 149 published in 1973, require, among other improvements in financial information, a reconciliation between accounting and tax results to show the factors that affect the tax burden of companies; the so-called ETR is used in numerous investigations, playing a relevant role both in the design of business policies and in the tax legislation itself (Callihan 1994).
However, the different objectives pursued by researchers have given rise to a broad typology in relation to the definition of this indicator. Thus, Fullerton (1984), Callihan (1994), Fischer, Rupert and Wartick (2001) or Buijink, Janssen and Schols (2002), among others; distinguish between average and marginal TIEs, in general, considering their retrospective or prospective nature, respectively. Following a different criterion, Zimmerman (1983), Fullerton (1984), Porcano (1986), Gupta and Newberry (1997), Bauman and Schadewald (2001) or Wilkinson, Cahan and Jones (2001) differentiate between total and partial rates, depending on whether the global taxes borne by the company or only part of them - internal or external - are considered.
In this paper, according to its objectives, an average global ETR shall be used, since what is intended to be quantified is the proportion of the earnings before taxes of the companies that the accrued tax expense represents.
Once the type of indicator most suitable for the research is chosen, the next problem to be solved is its formulation. Although many alternatives are available and there is no consensus among researchers, detailed reviews of the literature by Plesko (2003) and Molina (2005) show a marked preference for calculating the average ETR as the quotient between the expense by the tax on profit - whether or not adjusted for deferred taxes - and the accounting result before taxes. This shall also be the formulation chosen for this research, in this case, without making any correction in the accrued tax expense.
3 Data and Methodology
As already mentioned, the scope of this research are the companies operating in the electricity (ENER) and mining (MIN) sectors of Peru, provided they are obliged to present audited financial information to the Superintendency of the Securities Market (SMV for its acronym in Spanish), and the temporal horizon covered by the period between 2010 and 2015.
The accounting information required for the calculation of the ETR has been obtained from the Bloomberg Professional financial database. After discarding the companies without the required data, following GUPTA and NEWBERRY (1997), PLESKO (2003), MOLINA (2005) or ALVAREZ, FERNANDEZ and MARTINEZ (2011), among others; the observations whose ETR were negative or greater than 1 were deleted, and then the extreme values were removed. Table 5 shows the composition of the sample analyzed by sectors, indicating both the number of companies and observations. As can be seen, data problems have been substantially larger with mining companies.
| ENER | MIN | |||
|---|---|---|---|---|
| Item | Companies | Observations | Companies | Observations |
| Initial sample | 23 | 138 | 24 | 144 |
| Suppressed for lack of data or extreme values | 2 | 32 | 6 | 75 |
| Final sample | 21 | 106 | 18 | 69 |
Regarding the applied methodology, firstly, an analysis of the main descriptive statistics for each of the sectors has been carried out, both in annual terms and for the whole period.
Then, in order to match whether there are statistically significant differences between the different years of each group, many one-way analysis of variance (ANOVA) shall be carried out, if applicable, by the Games-Howell tests for pairwise comparisons to determine between what years these differences occur. In order to ensure the soundness of the results, the homogeneity of the variances shall be previously verified by the Levene’s test and, if necessary, the ANOVA results shall be reinforced with the Brown-Forsythe statistic.
Thirdly, it shall be analyzed if the differences between the effective tax rates of the two sectors for the whole period are statistically significant using Student’s T. As in the previous case, if appropriate, based on the Levene’s test results, the study shall be completed with the Mann-Whitney U non-parametric test, equivalent to Student’s T, but not requiring data normality or their homoscedasticity.
4 Results
The TIE obtained, presented in table 6, shows that, for both the whole of the period, and the entirety of the analyzed years, the companies in the mining sector bear an average tax burden on their profits, higher than that the electricity companies have to face.
However, the analysis of the other calculated statistics reveals a much greater dispersion of ETR among the mining companies, which present a much greater interval amplitude. In fact, unless 2015, the minimum values of the mining sector are far below those of electricity companies with differences ranging from just over 4 points in 2011 and 2014 to almost 12 points in 2012. If we look at the maximum values, the sense of the differences affects this question since the higher ETRs are substantially larger in the mining companies every year without exception, with differences ranging between the almost 7.5 points of 2011 and the almost 24 of 2010.
These results are consistent with the legal framework mentioned above, since the Special Tax System for the mining industry is a tax supplement for companies in this sector which is not borne by electricity companies. In this sense, it should be noted that, although this framework came into force in the last quarter of 2011, there was previously Mining Royalty Law No. 28258, in force since August 2004. It is also especially relevant for the interpretation of the results of this study to recall that both regulations establish progressive tax rates.
| N | Minimum | Maximum | Average | Standard Deviation | ||||||
|---|---|---|---|---|---|---|---|---|---|---|
| Period | ENER | MIN | ENER | MIN | ENER | MIN | ENER | MIN | ENER | MIN |
| 2010-2015 | 106 | 69 | 19.87% | 14.54% | 43.59% | 66.15% | 30.75% | 34.16% | 4.33 | 10.99 |
| 2010 | 17 | 16 | 24.49% | 14.54% | 42.22% | 66.15% | 32.72% | 34.34% | 5.02 | 11.53 |
| 2011 | 18 | 16 | 22.36% | 18.05% | 37.21% | 44.68% | 30.75% | 31.60% | 3.21 | 7.01 |
| 2012 | 17 | 12 | 27.78% | 16.11% | 41.60% | 61.18% | 30.77% | 33.14% | 3.14 | 12.25 |
| 2013 | 17 | 9 | 26.93% | 18.06% | 39.43% | 47.72% | 30.67% | 33.98% | 2.82 | 10.25 |
| 2014 | 18 | 9 | 19.87% | 15.65% | 43.59% | 58.77% | 29.15% | 35.00% | 6.20 | 12.43 |
| 2015 | 19 | 7 | 22.02% | 23.53% | 40.51% | 58.13% | 30.53% | 40.51% | 4.36 | 14.95 |
If we analyze the differences between the average ETRs of the two sectors and their evolution, presented in figure 2, we can see how, after a slight decrease between 2010 and 2011, the differences are marked due to the clearly increasing trend of the ETR of mining companies, which contrasts with a triennium of stability followed by a significant decrease of more than 1.5 points in 2014 in the case of electricity companies. Although the last year analyzed, the ETR rises in both sectors, the slope of the trend line is substantially higher in the mining sector, which raises the difference between the effective rates to almost 10 points.
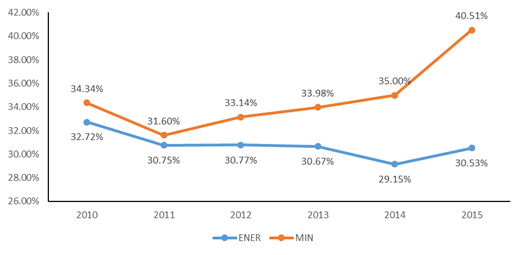
Figure 2
Comparison on Annual TIE Evolution Per Sector
Source: Prepared by the authors
The considerable increase in the tax burden observed in 2015 is of particular relevance given that, a priori, the reduction in the nominal rate set forth in Law No. 30296 should have had the opposite effect.
The reasons to justify this result might be different. Firstly, it could be due to the effects of deferred asset adjustments recognized in the financial statements for the 2014 - 2015 periods. The multinational nature of many of the companies analyzed and, therefore, the possibility that some of their results come from group entities located in other countries, would also have a direct influence on the increase of the ETR. Thirdly, for mining companies in particular, the data obtained show a very significant decrease in average profits as of 2013, which could significantly increase the relative impact of the special taxation of the sector on the borne tax burden. Nonetheless, the detailed analysis of this question is part of a more advanced phase of this research not included in this work.
A more detailed analysis of the evolution of the ETR in each of the sectors shows that the observed differences between the average rates of the six years studied are not statistically significant, neither between the mining companies nor between the electricity companies. In order to make this contrast, although the sample size would have allowed to assume the normality hypothesis, the lack of homogeneity of variances in the data of the electricity sector has discouraged the use of ANOVA applied to the mining companies, reason why, if appropriate, has resorted to the Brown-Forsythe statistic calculation. Nonetheless, since the normality of the data has not been verified, it has been decided to reinforce with this statistic calculation the analysis of the mining sector. Table 7 to 9 show, respectively, the results of the Levene statistic calculation for both sectors, the ANOVA of the mining sector and the solid tests, also for both groups (all statistical tests were performed at a significance level α = 0.05).
| Sector | Levene Statistic | gl1 | gl2 | Sig. |
|---|---|---|---|---|
| ENER | 2.770 | 5 | 100 | 0.022 |
| MIN | 1.200 | 5 | 63 | 0.320 |
| Sector | Sum of squares | gl | Root mean square | F | Sig. | |
|---|---|---|---|---|---|---|
| ENER | Between groups | 0.011 | 5 | 0.002 | 1.215 | 0.308 |
| Within groups | 0.186 | 100 | 0.002 | |||
| Total | 0.197 | 105 |
| Sector | Statistica | gl1 | gl2 | Sig. | |
|---|---|---|---|---|---|
| ENER | Brown-Forsythe | 1.225 | 5 | 75.400 | 0.306 |
| MIN | Brown-Forsythe | 0.590 | 5 | 39.032 | 0.708 |
Since the assumption of equality of means has not been rejected in any case logically, pairwise multiple comparisons have not been carried out.
Finally, in order to conclude this first part of the research, a contrast of equality of means has been made to evaluate whether, at the level of the period as a whole, the sector is relevant in the borne tax burden. For this purpose, a t-test has been performed which, when the homoscedasticity hypothesis has been rejected, has been reinforced with the Mann-Whitney U non-parametric test, the results of which are presented in Tables 10 and 11, respectively.
As can be seen, in both tests the null hypothesis of equality of means of distributions is rejected. Therefore, apart from the impact on the ETR derived from the special tax system for mining, membership to one sector or another does not generate statistically significant differences between the tax burden borne by companies.
| Levene’s test | t-test for the equality of means | |||||
|---|---|---|---|---|---|---|
| Variance hypotheses | F | Sig. | T | gl | Sig. (bilateral) | Difference of means |
| Equal variances are assumed | 42.611 | 0.000 | -2.880 | 173 | 0.004 | -0.034174 |
| Equal variances are not assumed | -2.462 | 81.923 | 0.016 | -0.034174 | ||
| Null hypothesis | Sig. |
|---|---|
| TIE distribution is the same one for sectors | 0.009 |
5 Conclusions
According to the results obtained, we can conclude that during all the years analyzed, the average tax burden borne by the mining sector has been higher than that of the electricity sector, in addition to showing a considerably greater dispersion among the rates of their companies. For the whole 2010 - 2015 period, the average ETR borne by the mining companies has been higher by almost 3.5 points to that of the electricity companies.
However, the differences obtained are not statistically significant neither between the rates of the different years of each of the sectors, nor in the comparative between both sectors at the global level.
Particularly interesting is the finding that, despite the reduction of the nominal rate in 2015 in an attempt to revitalize economic activity, the average effective rate of both sectors experienced an increase, especially notable in the case of mining companies. However, as noted by commenting on the results, this issue requires a detailed analysis to be addressed at a later stage of this research.
At a time when the use of energy sources and activities related to the extraction and exploitation of natural resources with an environment impact are being questioned, the investigation allows us to know the level of taxation that these industries actually support in Peru and, contribution by taxes comes to constitute an additional return to the country, which could help to correct the negative side effects caused by these industries.
The analysis is particularly relevant in the mining sector, whose production boom of the main mining investment projects of the country began in 2015, generating effects on the economy that represent around 12% of the Peruvian economy; while in the case of the electricity sector, the relevance is focused on the fact that it is a strategic sector for the development of the majority of economic activities in Peru, as well as for achieving the objectives of social and energy inclusion established by the last governments.
About future studies, the research becomes an antecedent to conduct a comparative research with the rest of sectors of the Peruvian economy, in that way can be identified if, in fact, when a higher level of taxation occurs in these industries, may allow the country to mitigate the environmental damage caused by these activities. Secondly, the work generates a space for comparative research with the same economic sectors of the countries that make up the Integrated Latin American Market (MILA), which are Colombia, Chile, Mexico and Peru, which has as its relevance, the fact of being considered as the largest market in Latin America.
References
Álvarez, Santiago; Elena Fernández y Antonio Martínez (2011). Corporate tax burden in the European Union. EC Tax Review, 1, 41-55.
Bauman, Christine y Michael Schadewald (2001). Impact of foreign operations on reported effective tax rates: interplay of foreign taxes, U.S. taxes and U.S. GAAP. Journal of international accounting auditing & taxation, 10, 177-196. https://doi.org/10.1016/S1061-9518(01)00043-X
Buijink, Willem; Boudewijn Janssen e Yvonne Schols (2002). Evidence of the effect of domicile on corporate average effective tax rates in the European Union. Journal of international accounting auditing & taxation, 11, 115-130. https://doi.org/10.1016/S1061-9518(02)00069-1
Callihan, Debra S. (1994). Corporate Effective Tax Rates: A Synthesis of the Literature. Journal of accounting literature, 13, 1-43.
Confiep (2016). CONFIEP: La minería tendrá una participación de 32% en el PBI del 2016. Consulta: 18 de marzo de 2017. http://www.confiep.org.pe/images/pdf/19-05-2016.pdf
Congreso de la República (1991). Ley Nº 25327. Ley de Control Parlamentario sobre los actos normativos del Presidente de la República. Lima, 17 de junio.
Congreso de la República (1991). Decreto Legislativo Nº 662. Ley de Promoción de las Inversiones Extranjeras. Lima, 2 de setiembre.
Congreso de la República (1991). Decreto Legislativo Nº 757. Ley Marco para el Crecimiento de la Inversión Privada. Lima, 13 de noviembre.
Congreso de la República (2000). Ley Nº 27342. Ley que regula los convenios de estabilidad jurídica al amparo de los Decretos Legislativos Nº 662 y 757. Lima, 06 de setiembre.
Congreso de la República (2008). Decreto Legislativo N° 1058. Decreto Legislativo que promueve la inversión en la actividad de generación eléctrica con recursos hídricos y con otros recursos renovables. Lima, 28 de junio.
Congreso de la República (2011). Ley N° 29764. Ley que prorroga la vigencia del beneficio tributario aprobado por el Decreto Legislativo 1058, Decreto Legislativo que promueve la inversión en la actividad de generación eléctrica con recursos hídricos y con otros recursos renovables. Lima, 22 de julio.
Congreso de la República (2011). Ley N° 29788 que modifica la Ley 28258, Ley de Regalía Minera. Lima, 28 de setiembre.
Congreso de la República (2011). Ley Nº 29789. Ley que crea el Impuesto Especial a la Minería. Lima, 28 de setiembre.
Congreso de la República (2011). Ley Nº 29790. Ley que establece el Marco Legal del Gravamen Especial a la Minería. Lima, 28 de setiembre.
Congreso de la República (2014). Ley Nº 30296. Ley que promueve la reactivación de la economía. Lima, 31 de diciembre.
Congreso de la República (2016). Decreto Legislativo Nº 1261 que modifica la Ley del Impuesto a la Renta. Lima, 10 de diciembre.
Fischer, Carol M.; Timothy J. Rupert y Martha L. Wartick (2001). Tax policy and planning implications of hidden taxes: effective marginal tax rate exercises. Journal of accounting education, 19, 63-74. https://doi.org/10.1016/S0748-5751(01)00008-2
Fullerton, Don (1984). Which effective tax rate? National tax journal, 37, 23-41.
Gupta, Sanjay y Kaye Newberry (1997). Determinants of the variability in corporate effective tax rates: Evidence from longitudinal data. Journal of Accounting and Public Policy, 16, 1-34. https://doi.org/10.1016/S0278-4254(96)00055-5
Ministerio de Economía y Finanzas (1992). D.S. N° 162. Aprueba Reglamento de los Regímenes de Garantía a la Inversión privada. Lima, 12 de octubre.
Ministerio de Energía y Minas (1992). Decreto Supremo Nº 014-92-EM. Texto Único Ordenado de la Ley General de Minería. Lima, 04 de junio.
Ministerio de Energía y Minas (2014). Resumen Ejecutivo Plan Energético Nacional 2014-2025. Consulta: 18 de marzo de 2017. http://deltavolt.pe/documentos/Resumen2014-2025Vf.pdf
Molina, Rafael (2005). Presión fiscal en las pymes. Estudio de su incidencia en la Comunidad Valenciana. AECA, Madrid.
Osinergmin (2016). Mercado mundial, nacional, efectos derivados y visión de la minería. Reporte de análisis económico sectorial, sector minería. Año 5 - N° 6 - Agosto 2016.
Plesko, George A. (2003). An evaluation of alternative measures of corporate tax rates. Journal of accounting & economics, 35, 201-226. https://doi.org/10.1016/S0165-4101(03)00019-3
Porcano, Thomas M. (1986). Corporate tax rates: progressive, proportional, or regressive. Journal of the American Taxation Association, 7, 17-31.
Wilkinson, Brett R.; Steven F. Cahan y Geoff Jones (2001). Strategies and dividend imputation: the effect of foreign and domestic ownership on average effective tax rates. Journal of international accounting auditing & taxation, 10, 157-176. https://doi.org/10.1016/S1061-9518(01)00042-8
Zimmerman, Jerold L. (1983). Taxes and firm size. Journal of accounting & economics, 5, 119-149. https://doi.org/10.1016/0165-4101(83)90008-3
Author notes
rafael.molina@uv.esodiaz@pucp.edu.pescd286@gmail.comandres.alfaro@miskimayo.com