Artículos
Ecosystem and productive benefits of the strategic inclusion of annual legumes into an annual ryegrass pasture in a no-tillage integrated crop-livestock system
Ecosystem and productive benefits of the strategic inclusion of annual legumes into an annual ryegrass pasture in a no-tillage integrated crop-livestock system
RIA. Revista de Investigaciones Agropecuarias, vol. 47, núm. 3, pp. 344-353, 2021
Instituto Nacional de Tecnología Agropecuaria

Esta obra está bajo una Licencia Creative Commons Atribución-NoComercial 4.0 Internacional.
Recepción: 10 Octubre 2019
Aprobación: 18 Diciembre 2020
Publicación: 01 Diciembre 2021
Abstract: Annual winter pastures are strategic components in crop-livestock systems in Uruguay. The aim of this study was to evaluate the N legume fixation into an annual ryegrass pasture contrasted to the N fertilizer addition. The experimental design was a randomized complete block design with 2x2 factorial arrangement of the treatments, two pasture types: a) annual ryegrass (Lolium multiflorum L.) pasture, and b) of annual ryegrass with two annual legume species (Trifolium resupinatum L. and Trifolium vesiculosum L.); and two levels of N fertilizer: a) no N fertilizer, and b) 64 kg N ha-1. They were grazed with Holstein steers. Setaria italica crop was planted in summer to evaluate the carry over effects of the treatments on its herbage mass production. Pasture accumulated herbage mass was significantly increased with N fertilizer (P ≤ 0.01), increment of 1277 ± 322.5 kg DM ha-1. The legume species’ addition plus N fertilization led to a higher nitrogen nutrition index in the mixed pastures. Ryegrass herbage mass was positively influenced by N addition, but with that there was a 47% of weed herbage mass increase in the pure annual ryegrass pastures. The average daily gain of steers was positively influenced by legumes, with an average of 1.01 kg PV day-1 in mixtures. N fertilizer addition allowed a higher stocking rate and higher animal production in winter. A carryover effect of the treatments was not found on S. italica accumulated herbage mass. Legumes’ addition to annual ryegrass allowed a greater animal performance but did not provide any additional benefit to the following summer crop.
Keywords: nitrogen use, BNF, legumes incorporation, NNI (Nitrogen Nutrition Index).
Resumen: Las pasturas anuales de invierno son componentes estratégicos de los sistemas agropecuarios en Uruguay. El objetivo de este estudio fue evaluar el efecto de la fijación biológica de N de leguminosas en una mezcla con raigrás anual en contraste con la adición de fertilizante nitrogenado. El diseño experimental fue un diseño de bloques completos al azar con arreglo factorial 2 x 2 de los tratamientos, con dos tipos de pasturas: a) pastura de raigrás anual (Lolium multiflorum L.), y b) pastura mezcla de raigrás anual con dos especies de leguminosas anuales (Trifolium resupinatum L. y Trifolium vesiculosum L.); y dos niveles de fertilización con N: a) sin fertilizante, y b) 64 kg N ha-1. Las pasturas fueron pastoreadas con novillos Holstein. En verano se realizó un cultivo de Setaria italica para evaluar los efectos de los tratamientos en la producción de biomasa de este. La biomasa acumulada de las pasturas de invierno incrementó significativamente con fertilización de N (P ≤ 0.01), con un incremento de 1277 ± 322.5 kg MS ha-1. La pastura mezcla fertilizada con N produjo un mayor índice de nutrición nitrogenada que la pastura de raigrás anual. La biomasa aérea de raigrás presentó un incremento con el agregado de N; sin embargo, en las pasturas monofíticas de raigrás hubo un aumento del 47% de malezas. La ganancia media diaria de los novillos incrementó con la incorporación de leguminosas, con un promedio en las pasturas mezclas de 1,01 kg PV día-1. La adición de fertilizante nitrogenado permitió una mayor carga animal y una mayor producción animal en invierno. No se encontró un efecto de los tratamientos en la biomasa acumulada de S. italica. La incorporación de leguminosas al raigrás anual permitió una mayor ganancia diaria de peso vivo por animal, pero no produjo un efecto adicional sobre el cultivo sucesor de verano.
Palabras clave: eficiencia del nitrógeno, FBN, incorporación de leguminosas, INN (Índice de nutrición nitrogenado)..
INTRODUCTION
Integrated crop-livestock systems create synergies between livestock and crops (Peyraud et al., 2014). These systems allow agriculture to be more sustainable by diminishing the soil degradation processes generated by the over utilization of resources produced by certain practices, such as continuous cropping. Pasture inclusion within a crop rotation has shown to break soil degradation processes, the reason why this practice has been adopted in agricultural countries such as Uruguay, since the 60s decade (Garcia-Prechac et al., 2004). The inclusion of legume species, as annual legume cover crops or as part of long-rotation pastures accompanying grasses, is supported by the legume’s atmospheric nitrogen fixation capability (Peyraud et al., 2014).
In mixed pastures, nitrogen (N) fixation is associated with the amount of clover in the mixture total yield, due to the relation between N fixation and the percentage of legume present in the pasture botanical composition, however, this is diminished by N fertilizer addition (Enriquez-Hidalgo et al., 2016). The transference of the N fixed by legumes to the companion grasses in a pasture is highly variable, it depends on which are the other species, the agricultural management and the environmental conditions (Ledgard, 1991; Pirhofer-Walzl et al., 2011). Nevertheless, in a grazing system the amount of N coming from the animal excreta, especially urine, can be larger than that from the legume N fixation activity (Whitehead, 1970; Schnyder et al., 2009). The spatial distribution of N in the soil through large herbivores, which generates patchiness in the pastures, is influenced by several factors including the percentage of legume utilization, excreta distribution in the area and the magnitude of N losses by lixiviation and denitrification (Vallis, 1978).
Legumes in pastures have shown that animal live weight gain per day improves with their inclusion in a grass-only pasture, because of the high legume nutritive value (Sleugh et al., 2000). Normally this has been associated with the larger protein content in legume tissues compared to the grasses, which also favors a greater amount of N cycling in the system. The proportion of N retained by animals is relatively constant, about 10%. The remaining N is returned to the soil, mainly as urine deposition (Wetselaar and Ganry, 1982). More N could be restored to the soil if animals harvested more N from fodder (Cadisch et al., 1994).
The N captured while the biological fixation process is being carried out by winter annual legumes may be a feasible strategy to increase the available N for the next growing season and, thus, be utilized by the following crop in the rotation. However, this process can be erratic when a pasture is grazed. Animal depositions tend to be not homogeneously distributed in paddocks, concentrating larger amounts of N in specific individual soil positions. This increased patchiness in the soil exacerbates pasture growth unevenness, reaching up to 25% of the total defoliated area destined for an individual grazing event (Moir et al., 2010).
The implementation of integrated crop-livestock systems may result in high agricultural productivity levels, enhancing the efficient use of N by the whole system (Peyraud et al., 2014). The research was realized to test the hypothesis that the inclusion of an annual legume alongside an annual ryegrass pasture reduces the need for N fertilizer addition without diminishing pasture forage production, improves the animal performance, and provides soil fertility conditions that allow the successor summer crop to perform competitively without the extra N addition. The aim of the trial was to evaluate herbage mass accumulation and animal production in annual winter pastures and carryover effects of legumes incorporation and/or N fertilization in a no-tillage crop-livestock system.
MATERIALS AND METHODS
Site, treatments and climatological data
The trial was carried out in Paysandú (32° 23’ 27.1’’ S; 58° 03’ 41.76’’ W), Uruguay. The soil was Typic Argiudol, superficial to moderately deep and clay loam texture (Altamirano et al., 1976). Two types of pastures (M) were sown on 26 March 2016 to be evaluated, monophyte annual ryegrass pasture (RG), and RG – legumes mixture pasture (MX), under two N fertilizer rates (N), 0 (N0) and 64 (N64) kg N ha-1. The combination of both main factors generated the following treatments: 1) Lolium multiflorum L. cv. LE284 (RG) pasture without N fertilizer addition (0 kg N ha-1), called RG0; 2) RG with 64 kg N ha-1 (RG64); 3) RG, Trifolium resupinatum cv. Maral and Trifolium vesiculosum cv. Fertiseta pasture (MX) without N fertilizer (MX0); 4) MX with 64 kg N ha-1 (MX64). The N fertilization criterion was based on the herbage mass production (~2000 kg ha-1) (Leborgne, 1984), as well as the forage N content (~3%) during winter.
Legume seeds were inoculated with Rhizobium leguminosarum and pelleted with calcium carbonate. The temperature conditions and the hydric balance for the period are shown in Fig. 1. Evapotranspiration was estimated using the FAO method, with weather data (temperature, relative humidity, solar radiation and wind speed).
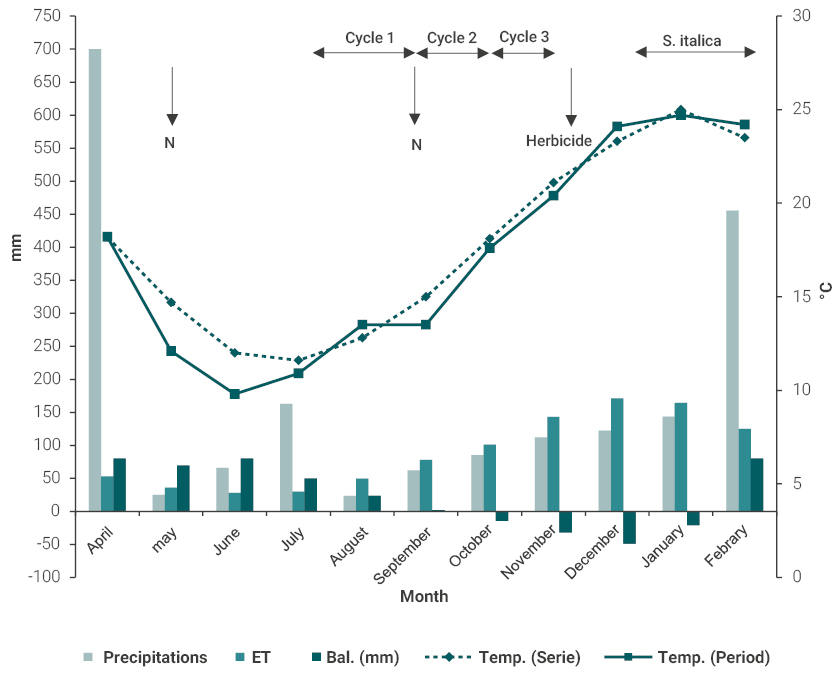
Figure 1
Average temperatures during the experimental period (April 2016 to February 2017) and historical series (2002-2014) in Paysandú, Uruguay. Bars indicate precipitations, potential evapotranspiration (ET) and soil water balance (Bal) in mm from April 2016 to February 2017. temp. (Series): average temperature during 2002-2014; Temp. (Period) average temperature for the experimental period. Horizontal arrows indicate length of each grazing cycle and vertical arrows indicate application time of mineral N and herbicide.
For the monophyte pastures, the annual ryegrass sowing rate was 19.2 kg ha-1. In the mixed pastures the annual ryegrass sowing rate was 12 kg ha-1, plus 5 kg ha-1 of legumes. Seed germination tests and seed weight calculation in laboratory determined that the monophyte pastures had 626 RG viable seeds per m-2, meanwhile the MX pastures had 392 RG viable seeds per m-2 and 305 viable seeds per m-2 clovers. The annual legumes were composed of 24% of T. resupinatum and 6% of T. vesiculosum, which were not possible to distinguish the seedlings between species in the laboratory due to the morphological similarity. The proportion of each species used in the mixtures was to pursue a pasture legume biomass capable of fixing a similar amount of N as the provided by N fertilizer utilized.
Seeds were sown by direct drilling in lines 17 cm apart. In MX, seeds were allocated in the same sowing line. Soil samples taken from the first 20 cm soil depth indicated that Olsen-P levels were 6 mg kg-1. To fulfill species P requirements, all plots received 17.5 kg ha-1 of P. Urea fertilizer (46% of N) was applied to RG64 and MX64 at the rate of 32 kg ha-1 of N in two opportunities: 50 days after sowing date (May 18, 2016) and after first grazing (September 6, 2016).
The experiment was a randomized complete block design, with six blocks and a 2 x 2 factorial arrangement of the treatments: two pasture types and two N rates, resulting in RG0, RG64, MX0 and MX64 treatments. The area of the plots was 0.35 ha, comprising a total experimental area of 8.4 ha. The trial was grazed with yearling Holstein steers (average weight of 200 kg ± 17 kg). Each grazing event started when the undisturbed pasture height reached 15-20 cm. The residual pasture height target was 5-7 cm height. Non-core animals were added or removed to keep pasture forage allowance at about 8 kg DM pasture mass per 100 kg of animal body weight. Thus, the number of steers per plot was different with a minimum of three and a maximum of five animals.
A rotational grazing was utilized. Three groups of steers were randomly assigned to the pastures and three of the six blocks were grazed at the same time. When the post-grazing target was reached in one block, the steers were moved to a second block, after which they returned to the prior block, completing with this a grazing cycle. Each plot was grazed by three to five steers; thus, the forage allowance was maintained steady.
To avoid nutrient transference between treatments, at all times the animals grazed the same treatment during the whole trial. Grazing began on 15 July 2016, and ended on 3 November 2016. Three grazing cycles were completed, with an average of 15 days of grazing and 20 days of rest for each block. The first grazing cycle was from 15 July to 6 September and corresponded to winter, the second grazing cycle was between 6 September to 14 October and the last cycle was from 14 October to 3 November. The last two cycles occurred in the spring season.
After the last cycle, the pastures were sprayed with 3 l ha-1 of glyphosate and 1 l ha-1 of 2,4-Dichlorophenoxyacetic acid herbicides to establish the summer crop. Setaria italica was sown in all treatments, on 12 December 2016, with a seeding rate of 20 kg ha-1 by direct-drilling.
Tiller number per plant and tiller number m-2
Immediately before the first grazing cycle, the ryegrass tiller population was measured, tillers m-2 were counted in situ at six locations per plot (in a one-meter line following the sown rows, 15 cm between sowing rows). Daughter tillers per plant was registered by destructive technique collecting six 10 cm-2 cores per plot (Jewiss, 1972).
Accumulated herbage mass and botanical composition
Herbage mass production was calculated according to Campbell (1996). The pre-grazing and post-grazing herbage mass were determined using the double sampling technique with 8 samples per plot and a 20 x 50 cm quadrat. The double sampling technique consisted in measuring undisturbed pasture height in three locations inside the quadrats, and after cutting the forage inside them to a ground level, the herbage mass was dried in a forced air oven at 65 °C until constant weight. A regression analysis between herbage height (independent variable) inside the quadrat and its herbage weight (dependent variable) was made. In order to calculate the herbage mass per plot, the formula obtained from the regression analysis was replaced with the average of 40 undisturbed pasture height measurements recorded in each plot (Haydock and Shaw, 1975). This procedure was repeated for each pre and post-grazing herbage mass measurement. The botanical composition was estimated by the area estimation cover method (Brown, 1954), using a 20 x 50 cm quadrat to perform the estimation. Forty visual samples per plot were taken to estimate botanical composition and the percentage of pasture cover was sorted into “grass”, “legumes” and “weeds”. Thus, the kg ha-1 of each component of the pastures was calculated as the product of each component percentage and pasture herbage mass production.
Nutrition status of pastures
From RG and MX pastures, grass and legume herbage N concentration (Nact) was measured separately using the Kjeldahl method (Bradstreet, 1954). Thus, the nitrogen content of the pre-grazing herbage mass was measured at the beginning of the second grazing cycle. This was performed to four of the six blocks. The nitrogen status of the pastures was assessed through the Nitrogen Nutrition Index (NNI) (Lemaire and Gastal, 1997):
NNI = Nact/ Ncr
where, Ncr is the critical N concentration estimated as
Ncr = 4.8 W-0.32
where, W is the pre-grazing dry matter herbage mass (t ha-1). NNI was calculated also for the grass and legume components. A regression analysis was made between the NNI and the second grazing cycle accumulated herbage mass for the RG and MX pastures.
Successor summer crop
Total soil nitrogen concentration was measured from soil samples taken from the first 5 cm of soil before sowing S. italica. The soil sampling was carried out before applying the herbicide pre-direct drilling S. italica on the remnant pastures growing at that time. Soil sampling was done in a paired basis, from the soil directly located under the urine patches and at 1.5 m distance from that individual urine patch, being called “no urine patch” position. A urine patch was detected by the stronger green color of the forage and larger plant size, compared to its surrounding pasture. A total of 7 paired samples per plot were taken and assessed in December 2016. Soil N content was determined through the Kjeldahl method (Bradstreet, 1954) in the Agricultural School Laboratory, Universidad de la República, Uruguay.
Soil bulk density (g cm-3) from a urine patch and from a no urine patch was assessed by inserting a cylinder (5 cm length and 2.5 cm diameter) to a ground level. The soil was dried at 104°C during 48 h and weighted. Bulk density was calculated based on the volume of the cylinder and the dried weight of the soil.
In addition, on 1 February 2017, the concentration of N in S. italica was determined by the Kjeldhal method, in the stage 49 according to Zadoks et al. (1974) and the accumulated herbage mass (kg DM ha-1) was measured through eight samples (quadrat 50 x 50 cm) per plot cut to a 1 cm above ground level.
Biological N fixation
In the pre-grazing herbage mass of the second and the third grazing cycle, N fixation of legumes was evaluated with the natural abundance 15N technique. First, shoot material from MX0 was separated into grass (non-fixing crop) and legumes (fixing crop components), oven-dried at 60°C per 48 h, weighted, and ground using a 1-mm sieve. Total N and δ15N (‰) were determined using ANA-mass spectrometers (at the Soil Laboratory, Universidad de la República, Uruguay). The %Ndfa (% of fixing N) was estimated according to Ledgard (1989):
%Ndfa = [δ 15N(‰)non-fixing crop− δ 15N(‰)fixing crop] / [δ 15N(‰)non-fixing crop−B]×100
where, factor B (correction factor) is -1‰ (Peoples et al., 1991).
The total amount of N2 fixed was the result of multiplying %Ndfa by kg N ha-1 of legumes in MX0.
Animal average daily gain and animal production per hectare
Animals were weighted once a month in order to calculate herbage allowance and animal daily gain (ADG) per treatment. As the experiment involved three animal groups (repetitions), it was possible to do a statistical analysis for WG per hectare for winter, spring and the whole period.
Statistical analysis
The variables were analyzed assuming normal distribution. General linear model was applied, and Tukey test performed to separate the means. The interaction of the two main factors, pasture type (M) and N fertilizer (N), at their two levels (nitrogen at 0 and 64 kg N ha-1; pasture type [RG and MX]) was evaluated in the model, and the interaction was nested within grazing cycles.
The evaluation of the nutritional status of the pastures and its relationship with the herbage mass production were carried out by regression analysis between NNI (independent variable) and net dry matter production (dependent variable) for the period. The level of significance used in all the analyses was 5% (P = 0.05).
RESULTS
Pastures herbage mass production
The accumulated herbage mass from 26 March 2016 to 3 November 2016 along the three grazing cycles is shown in Table 1. The first grazing cycle started with the accumulated herbage mass from sowing to the 6th September. There was no significant interaction between pasture type (M) and N fertilizer (N) for the total accumulated herbage mass. The N fertilizer addition significantly increased (P ≤ 0.01) the total accumulated herbage mass. No statistically significant differences (P > 0.05) were found for pasture type (M). The annual ryegrass flowered by mid of November 2016.
Regarding the grazing cycles, N fertilizer level was statistically different (P ≤ 0.05) for the first and second grazing cycles, showing higher herbage mass productions on the fertilized pastures (table 1). Thus, for the whole experimental period the nitrogen use efficiency for N fertilized pastures was 19.9 kg DM kg-1 per kg of N applied.
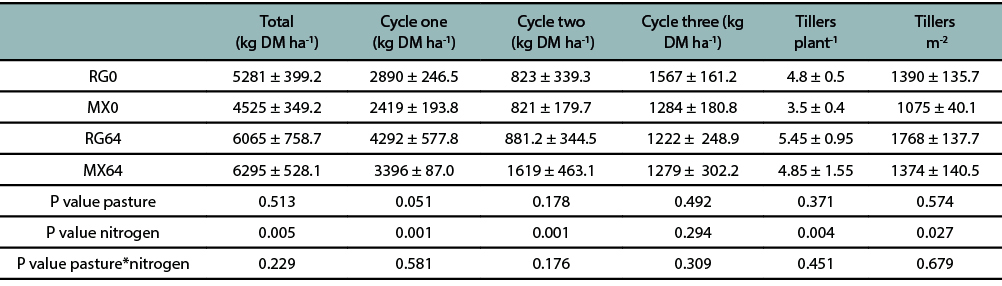
Table 1
Herbage mass production per grazing cycle, total accumulated herbage mass and tillers number for mixed pastures with (MX64) and without (MX0) addition of 64 kg N ha-1, and annual ryegrass pastures with (RG64) and without (RG0) addition of 64 kg N ha-1. Values are expressed as means ± SEM.
Changes on tiller population
Nitrogen fertilizer addition significantly increased (P ≤ 0.01) the tiller number per plant and the tillers m-2. There was non-significant interaction between N fertilizer addition and type of pasture (P > 0.05) (table 1).
Total and seasonal botanical composition
The herbage mass of ryegrass in the pastures diminished towards spring for both pastures and fertilizer levels. Total ryegrass accumulated herbage mass was statistically different between pasture types (P ≤ 0.05), being higher in RG than in MX pastures. Similar thing was measured during the first grazing cycle (P ≤ 0.001). In addition, N fertilization significantly increased (P ≤ 0.001) ryegrass accumulated herbage mass and ryegrass herbage mass for grazing cycles one and two (P ≤ 0.001). Weed accumulated herbage mass and weed herbage mass during grazing cycles two and three were statically different (P ≤ 0.05) for type of pasture, with an increase of 47% for the RG pastures in relation to the MX pasture (table 2).
The legume component maintained a similar accumulated herbage mass and herbage mass per grazing cycle between MX0 and MX64, despite the N fertilizer addition, with an average of 1790.0 ± 207.7 kg ha-1 and 596.0 ± 47.3 kg ha-1, respectively.
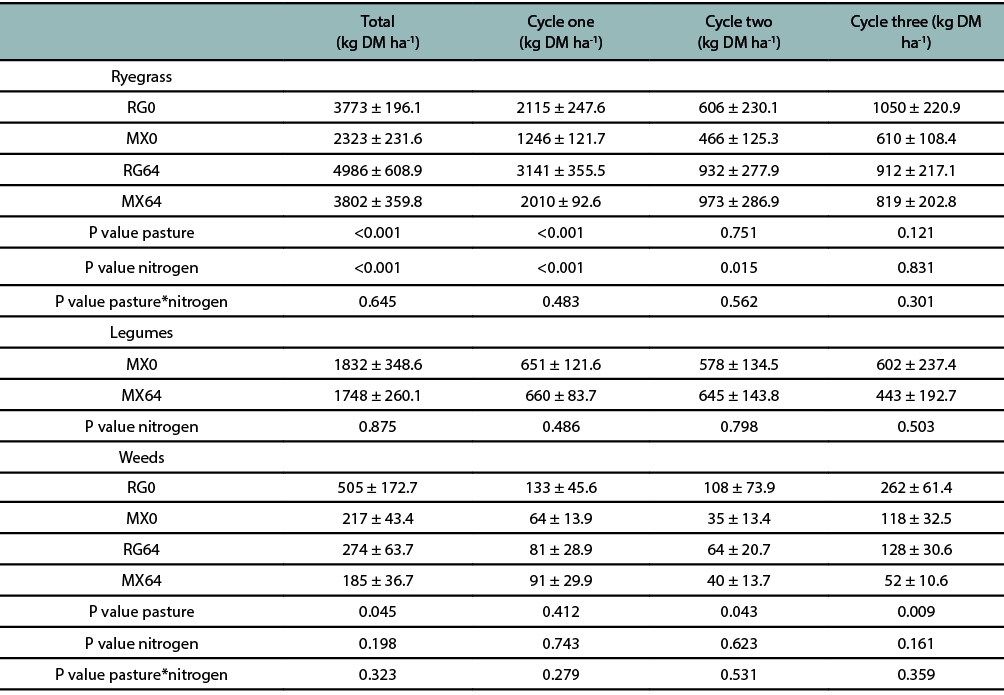
Table 2
Botanical composition of the total accumulated herbage mass and per grazing cycle. MX0: mixed pasture without N fertilizeraddition; RG0: annual ryegrass pasture without N fertilizer addition; MX64: mixed pasture fertilized with 64 kg N ha-1; RG64: annual ryegrasspasture fertilized with 64 kg N ha-1.Values are expressed as means ± SEM.
Nutritional status of the pastures
During the second grazing cycle, the N fertilization increased the herbage mass N concentration (P ≤ 0.05), accumulated N (kg N ha-1) (P ≤ 0.05) and NNI. In addition, these three variables were different for pasture type, being higher for the mixed pastures. There was no significant interaction between N fertilizer and pasture type. The legume species NNI was 0.75 ± 0.04, while 0.56 ± 0.05 for the ryegrass in MX64, and 0.38 ± 0.04 in MX0 (table 3).
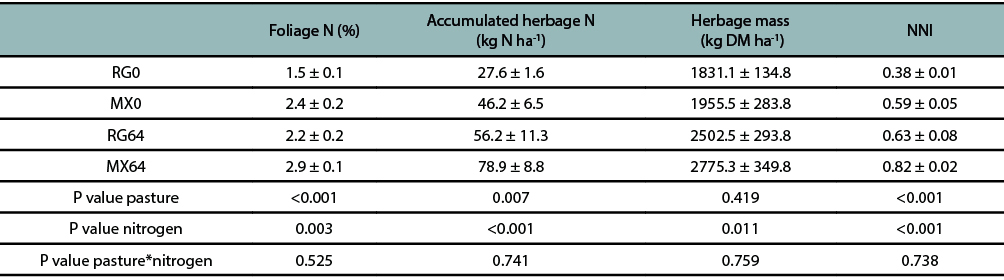
Table 3
Accumulated herbage N (kg ha-1), foliage N concentration (%) and NNI in the pre grazing herbage mass for annual ryegrass pasturewith (64 kg N ha-1) (RG64) and without N fertilizer addition (RG0), and for the mixed pasture with (64 kg N ha-1) (MX64) and withoutN fertilizer addition (MX0).Values are expressed as means ± SEM.
Biological N fixation
Legumes Ndfa in MX0 was 95%, with 2.9% N concentration and 1220 kg DM ha-1. Thus, during the last two grazing cycles, a total of 33.6 kg ha-1 N were fixed by MX0.
Animal production
During winter, independently of what type of pasture was evaluated, the ADG showed significant differences (P ≤ 0.05) only for N fertilizer rate factor, being N64 the best alternative. However, during spring, independently of the N fertilizer rate, significant differences (P ≤ 0.05) were related to the type of pasture factor, where ADG behaved better when animals were grazing the MX pasture. For both seasons, there were no statistical differences with respect to the interaction (pasture*N). The mean ADG had the same trend as the spring period, where the type of pasture factor showed significant differences (P ≤ 0.05) in favor of the MX pasture. As well as in winter and in spring, there were no statistical differences when the interaction (pasture*N) was studied (table 4). The WG per hectare was only different in winter for the N fertilizer level (P ≤ 0.05), independently of the pasture type used (RG or MX). Total WG did not probe differences between treatments.
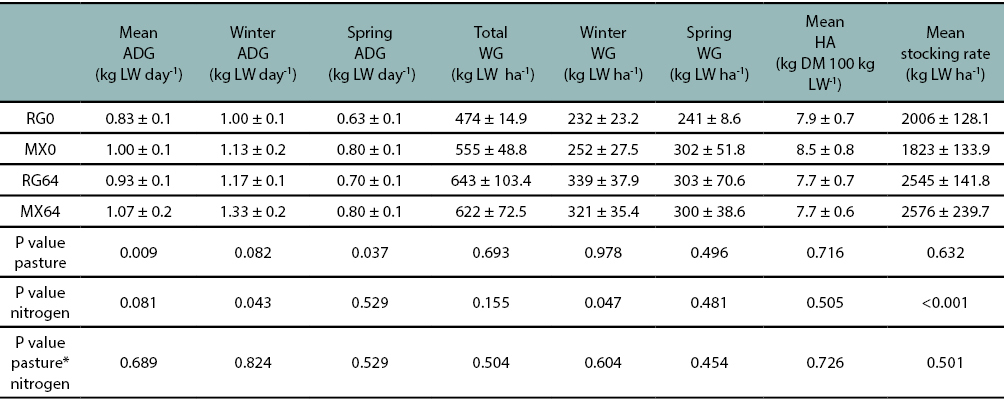
Table 4
Mean average daily gain (ADG) (kg LW day-1), ADG in winter and spring, total live weight gain (WG), WG in winter and spring ofsteers. Mean herbage allowance (HA) and mean stocking rate utilized in the pastures. MX0: mixed pasture without N fertilizer addition;RG0: annual ryegrass pasture without N fertilizer addition; MX64: mixed pasture fertilized with 64 kg N ha-1; RG64: annual ryegrass pasturefertilized with 64 kg N ha-1.Values are expressed as means ± SEM.
Summer crop and carryover effects of treatments
The soil analysis performed immediately after the pastures finished their productive cycle showed no statistically differences in the total soil N levels, neither by consequence of the N application, nor by the effect of legumes N symbiotic fixation.
The overall average total soil N, for the no urine patches was 4.3 ± 1.15 kg ha-1, and for the urine patches was 18.5 ± 3.8 kg N ha-1. The total soil N for the urine patches showed a statistical trend only for the pasture type (P=0.065) (table 5).
Setaria italica herbage mass production and N concentration in the foliage were not statistically different between the treatments. The average herbage mass production was 1855.0 ± 137.2 kg DM ha-1, while the foliage N concentration was 1.52 ± 0.06%.
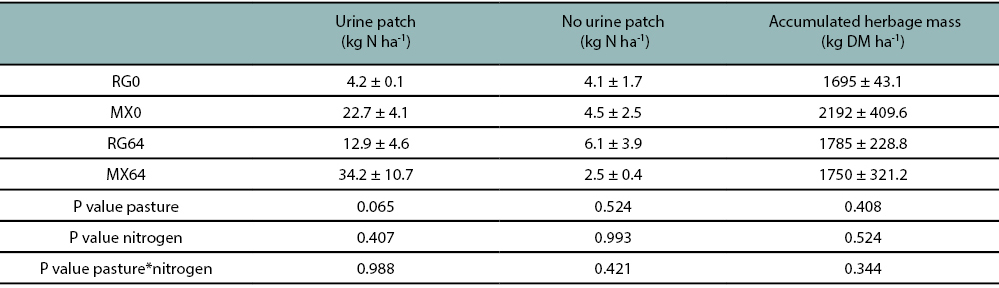
Table 5
Soil mineral N in urine patches and in areas without visible urine patches and S. italica accumulated herbage mass at 49 stage,according to Zadoks et al. (1974) scale. MX0: mixed pasture without N fertilizer addition; RG0: annual ryegrass pasture without N fertilizeraddition; MX64: mixed pasture fertilized with 64 kg N ha-1; RG64: annual ryegrass pasture fertilized with 64 kg N ha-1.Values are expressed as means ± SEM.
DISCUSSION
Pasture production and botanical composition
This study highlighted the relevance of N fertilizer addition to increase annual ryegrass pasture production. This evidences the low N contribution from annual legumes to grasses during their initial stages (table 1). Nitrogen deficiency is shown in pastures through the diminishing in the number of tillers per plant, leaves growth and leaves photosynthetic rate (Woledge and Pearse, 1985). A higher tiller density of the pastures with N fertilization showed greater accumulated herbage mass in the first cycle compared with not fertilized pastures. The rate of tiller production per plant is sensitive to soil mineral N fluctuations (Langer, 1963; Simon and Lemaire, 1987), which was shown in the current study by the increase of tiller per plant and tiller per m2 when the pasture was fertilized with N (table 1).
A similar amount of accumulated herbage mass between RG and MX pastures during the grazing cycles (table 1) was a consequence of complementation growth processes between species within each of them (Hooper et al., 2005). The water deficit that occurred from the second half of the second cycle and throughout the third cycle (fig. 1) negatively affected the RG growth probably due to its greater density and, consequently, its higher intraspecific competition (Hall, 1978), which likely led to equalize the differences measured in the first cycle (table 2). On the other hand, according to Whitehead (1995), mixed pastures of grasses-legumes without N fertilization produce a higher yield than pure grasses pastures exposed to conditions of low mineral N in the soil, because of the presence of biological N fixation of the legume species. In the present trial, the lack of difference could be attributed to the short life of the pastures, therefore long-term effects, such as N fixation-utilization by companion species, were not able to be expressed as grass dry matter growth. It was not enough time for the N fixed by the legume to be transferred to the neighboring grass species, a process that is carried out after the first year of the pasture’s life (Harris, 1990).
The production of T. resupinatum behaved similarly to a legume monoculture fertilized with N, where production remains unchanged (Soussana and Tallec, 2009). The present study suggests that adding low rate of N fertilizer to a mixed pasture of annual ryegrass and annual legumes has a different outcome compared with perennial mixed pastures, where in the latter there is a diminishment of clover herbage mass, which is caused by a shading effect of grass (Enriquez-Hidalgo et al., 2016).
The lack of differences on weed accumulated herbage mass (kg ha-1) in the first grazing cycle probably was a consequence of high growth rates and good tillering of the pastures, which allowed to quickly close the furrow, preventing the invasion of non-sown species. In the following grazing cycles, there was an increase of weeds in the RG pastures, evidencing that there was an available ecological niche which eventually could have been occupied by any species (table 2). Other non-sown species were found, such as Medicago lupulina and Trifolium repens, both species capable of fixing atmospheric nitrogen. Schwinning and Parsons (1996), using hierarchical models, determined that the amount of legumes (Trifolium repens in this case) was positively related to the extent of available sites with low soil N concentration to be colonized by them, as it was determined in this study.
Nitrogen content in pastures and biological N fixation
In the mixture, the grass component could not use the atmospheric N fixed, reflected on the similar amount of NNI regarding the annual ryegrass pasture without N fertilizer. Morris et al. (1990) reported that 4 kg ha-1 of N were transferred from T. vesiculosum to the companion grasses only after the second year, which corresponded to a minor N supply compared to the N fixation capacity of these species (Mueller and Thorup-Kristensen, 2001).
In the current study, NNI was closely related to herbage mass production and turned to be an important indicator in the decision to apply N fertilizer (fig. 2) (Lemaire and Meynard, 1997). In mixed pastures, a high proportion of NNI values were between 0.6 and 0.8 NNI (Fig. 2), a range that is close to that reported by Soussana and Arregui (1995), between 0.7-0.8 NNI in mixed grass and legume pastures, but without fertilizer addition. The findings of Soussana and Arregui (1995) were based on perennial grasses with greater root systems compared to the annual ryegrass roots, therefore with a greater soil exploratory capacity to potentially acquire soil mineral N from a larger soil volume (Garnier, 1992). In the present research, greater NNI values in the mixed pastures compared with the annual ryegrass pastures (table 3) are mainly explained by the presence of legume components in the former, since legumes have more crude protein in the foliage than grasses. However, herbage mass production in mixtures did not reflect it, because legumes proportion was comparatively lower in relation to ryegrass component (table 2).
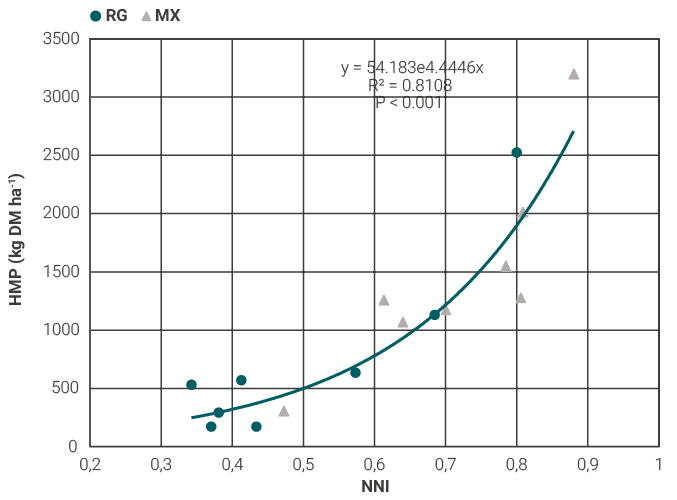
Figure 2
Herbage mass production (kg DM ha-1) according to different NNI (Nitrogen Nutrition Index). Closed circles: annual ryegrasspastures (RG); gray triangles: mixed pastures (M).
Animal production
The lack of significant difference between treatments when studying total WG suggests that it is possible to achieve similar animal production using either N fertilizer or legume incorporation, in spite of the important numerical differences. The greater effect of the type of pasture factor on the mean ADG, evidences the importance of including legumes in order to get better individual performances, also reported by Fruet et al. (2019).
Total WG results concur with the ones exposed by Butler et al. (2012), in which they evaluated the third year of production of a tall fescue under N fertilizer addition (112 kg ha-1) or using annual legumes (T. vesiculosum, Vicia villosa and Pisum sativum) beside the tall fescue, but this did not occur for the mean ADG which in the current experiment were favored by the presence of legumes during spring period while the authors reported similar daily gains.
During winter, the increase of WG per hectare in the pastures that received N fertilizer, as reported in Table 4, was associated with more fodder production, due to higher levels of forage mass and also an improvement in forage quality. This enabled maintaining high individual gains at the previously proposed forage allowances.
Although total WG was similar between treatments, the higher stocking rate used in pastures with N fertilizer addition (25% higher) compared with pastures without N addition, allowed to keep more and heavier animals growing in the fertilized pastures, being probably the reason of the similar ADG between N fertilized and unfertilized pastures. Furthermore, according to Aguirre (2018) the animal production results (kg ha-1 of live weight) of the present trial for pastures with and without N fertilizer were located in the top 5% of the farms with the highest production in the last 10 years in Uruguay.
It stands out based on the results above not only the significance that presents N by promoting higher fodder production during winter determining an increase in individual animal performance, but also the importance of stimulating the presence of legumes within the pasture, which through its contribution to digestibility and protein enhance animal diet quality during spring, leading to better individual weight gain during the season, and mean ADG along the whole period.
Successor summer crop and carryover effects of treatments
The low mineral N levels in the soil prior to S. italica sown and the lack of differences between treatments rejected the hypothesis that the inclusion of annual legumes alongside an annual ryegrass pasture adds a high amount of N to the soil enough to support the herbage mass production of the following crop within the rotation.
The findings in the present trial agree with Franzluebbers and Stuedemann (2014), which did not find an increase in the summer crop production due to the legume incorporation in the cover crop. In grazing systems, the animals are a source of soil heterogeneity, modifying soil nutrients levels and distribution, through dung and especially urine, also they alter soil physical attributes and pasture condition, through stimulating changes on variables such as botanical composition, tiller and plant density, herbage mass accumulation amongst others (Auerswald et al., 2009). In the present trial, the lack of statistical differences in herbage mass production of S. italica between treatments could have been explained by the absence of differences in the soil N concentration between the urine patches and the non-urine patches. Previous research has reported that the soil N concentration in the urine patches can be reduced to similar values to no urine patch conditions in the first 50 days after an urine application (Simon et al., 2019). This probably explains the small amount of soil N in the urine patches in the present study (Hoogendoorn et al., 2010), as the soil N sampling was done more than 30 days from the end of the least grazing cycle.
In addition, the water shortage that occurred during late spring and early summer probably contributed to a low N soil mineralization from soil organic matter and plant litter (Bloem et al., 1992), preventing differences between S. italica treatments yield to be detected (Cabrera et at., 2005).
CONCLUSIONS
Pasture production increased in response to the N fertilizer addition, regardless of the type of pasture factor.
The legume addition to the pasture increased individual animal performance in a no-tillage crop-livestock system.
Setaria italica herbage mass production did not evidence significant differences associated neither with the legume’s incorporation, nor the N fertilizer addition. Climatic conditions related to a negative hydric balance and spring-summer temperatures, had greater effects than that from the predecessor treatments. Hence, it is suggested to repeat the trial in order to diminish the climatic effects.
Acknowledgments
The authors thank Fertiprado Uruguay for the financial support.
REFERENCES
AGUIRRE, E. 2018. Evolución reciente de la productividad ganadera en Uruguay (2010-17). Metodología y primeros resultados 1. Ministerio de Agricultura, Ganadería y Pesca. (Available at: http://www.mgap.gub.uy/sites/default/files/34_anuario_2018_-_evolucion_productividad_ganadera.pdf verified: December 15th 2018).
ALTAMIRANO, A.; DA SILVA, H.; DURÁN, A., ECHEVERRÍA, A.; PANARIO, D.; PUENTES, R. 1976. Carta de reconocimiento de suelos del Uruguay: Clasificación de suelos. Ministerio de Ganadería Agricultura y Pesca, Montevideo, Uruguay.
AUERSWALD, K.; MAYER, F.; SCHNYDER, H. 2009. Coupling of spatial and temporal pattern of cattle excreta patches on a low intensity pasture. Nutr. Cycling Agroecosyst. 88: 275-288. doi:10.1007/s10705-009-9321-4
BLOEM, J.; DE RUITER, PC; KOOPMAN, GJ; LEBBINK, G; BRUSSAARD, L. 1992. Microbial numbers and activity in dried and rewetted arable soil under integrated and conventional management. Soil Biol. Biochem. 24: 655-665.
BRADSTREET, R.B. 1954. Kjeldahl method for organic nitrogen. Anal. Chem. 26: 185-187.
BROWN, D. 1954. Methods of surveying and measuring vegetation. Commonw. Bur. Pastures and Field Crops, Bull. 42. Berks, U.K.
BUTLER, T.J.; BIERMACHER, J.T.; KERING, M.K.; INTERRANTE, S.M. 2012. Production and Economics of Grazing Steers on Rye–Annual Ryegrass with Legumes or Fertilized with Nitrogen. Crop Sci. doi:10.2135/cropsci2011.11.0611
CABRERA, M. L.; KISSEL, D. E.; VIGIL, M. F. 2005. Nitrogen mineralization from organic residues. Journal of environmental quality. 34(1): 75-79.
CADISCH, G.; SCHUNKE; R.M.; GILLER, K.E. 1994. Nitrogen cycling in a pure grass pasture and a grass-legume mixture on a red latosol in Brazil. Tropical grasslands 28: 43-43.
CAMPBELL, A. 1966. Grazed pasture parameters. II. Pasture dry-matter use in a stocking rate and grazing management experiment with dairy cows. J. agric. Sci. 67: 211-216.
ENRIQUEZ-HIDALGO, D.; GILLILAND, T.J.; HENNESSY, D. 2016. Herbage and nitrogen yields, fixation and transfer by white clover to companion grasses in grazed swards under different rates of nitrogen fertilization. Grass Forage Sci. 71: 559-574.
FRANZLUEBBERS, A. J.; STUEDEMANN, J. A. 2014. Crop and cattle production responses to tillage and cover crop management in an integrated crop–livestock system in the southeastern USA. Eur J Agron. 57: 62-70.
FRUET, A.; STEFANELLO, F.; TROMBETTA, F.; DE SOUZA, A.; ROSADO JÚNIOR, A.; TONETTO, C.; FLORES, J. L. C.; SCHEIBLER, R. B; BIANCHI R. M.; PACHECO, P. S.; DE MELLO, A.; NÖRNBERG, J. 2019. Growth performance and carcass traits of steers finished on three different systems including legume–grass pasture and grain diets. Animal. 13(7):1552-1562.
GARCIA-PRÉCHAC, F.; ERNST, O.; SIRI-PRIETO, G.; TERRA, J. A. 2004. Integrating no-till into crop–pasture rotations in Uruguay. Soil Tillage Res. 77. 1-13.
GARNIER, E. 1992. Growth analysis of congeneric annual and perennial grass species. Journal of Ecology: 665-675.
HALL, R. 1978. The analysis and significance of competitive and non-competitive interference between species. In: J.R. Wilson, editor, Plant Relations in Pastures. CSIRO, Melbourne, Vic. p. 163-174.
HARRIS, W. 1990. Pastures as an ecosystem. In: LANGER R.H.M. (editor). Pastures: their ecology and management. Oxford University Press: Auckland, New Zealand. 75-31 pp.
HAYDOCK, K.P.; SHAW, N.H. 1975. The comparative yield method for estimating dry matter yield of pasture. Aust. J. Exp. Agric. Anim. Husb. 15: 663-670.
HOOGENDOORN, C.J.; BETTERIDGE, K.; COSTALL, D.A.; LEDGARD, S.F. 2010. Nitrogen concentration in the urine of cattle, sheep and deer grazing a common ryegrass/cocksfoot/white clover pasture. New zeal j agr res. 53(3): 235-243.
HOOPER, D.U.; CHAPIN, F.S.; EWEL, J.; HECTOR, A., INCHAUSTI, P.; LAVOREL, S.; LAWTON, J.H.; LODGE, D.; LOREAU, M.; NAEEM, S. 2005. Effects of biodiversity on ecosystem functioning: a consensus of current knowledge. Ecol. Monogr. 75. 3-35.
JEWISS, O. 1972. Tillering in grasses—its significance and control. Grass Forage Sci. 27: 65-82.
LANGER, R.H.M. 1963. Tillering in herbage grasses. Herb. Abstr. 33: 141-148.
LEBORGNE, R. 1984. Antecedentes técnicos y metodología para presupuestación en establecimientos lecheros. lnf.de campo. Proyecto URU/78/004.Fucrea-FAO-PNUD. 50 p.
LEDGARD, S. 1989. Nutrition, moisture and rhizobial strain influence isotopic fractionation during N2, fixation in pasture legumes. Soil Biol. Biochem. 21: 65-68.
LEDGARD, S. 1991. Transfer of fixed nitrogen from white clover to associated grasses in swards grazed by dairy cows, estimated using 15 N methods. Plant Soil 131: 215-223.
LEMAIRE, G.; GASTAL, F. 1997. N uptake and distribution in plant canopies. In: LEMAIRE, G. (Ed.). Diagnosis of the nitrogen status in crops. Springer, Berlin, Heidelberg. 3-43 pp.
LEMAIRE, G.; MEYNARD, J. 1997. Use of the nitrogen nutrition index for the analysis of agronomical data. In: LEMAIRE, G. (Ed.). Diagnosis of the nitrogen status in crops. Springer, Berlin, Heidelberg. 45-55 pp.
MOIR, J.L.; CAMERON, K.C.; DI, H.J.; FERTSAK, U. 2010. The spatial coverage of dairy cattle urine patches in an intensively grazed pasture system. The Journal of Agricultural Science 149: 473-485. doi:10.1017/s0021859610001012
MORRIS, D.; WEAVER, R.; SMITH, G.; ROUQUETTE, F. 1990. Nitrogen transfer from arrowleaf clover to ryegrass in field plantings. Plant Soil 128: 293-297.
MUELLER, T.; THORUP-KRISTENSEN, K. 2001. N-fixation of selected green manure plants in an organic crop rotation. Biol. Agric. Hortic. 18: 345-363.
PEOPLES, M.; BERGERSEN, F.; TURNER, G.; SAMPET, C.; RERKASEM, B.; BHROMSIRI, A.; NURHAYATI, D.P.; FAIZAH, A.W.; SUDIN, M.N.; NORHAYATI, M.; HERRIDGE, D.F. 1991. Use of the natural enrichment of 15N in plant available soil N for the measurement of symbiotic N2 fixation. In: BARRIE, A. (Ed.). Stable isotopes in plant nutrition, soil fertility and environmental studies. IAEA, Vienna. 117-129 pp.
PEYRAUD, J.L.; TABOADA, M.; DELABY, L. 2014. Integrated crop and livestock systems in Western Europe and South America: a review. Eur J Agron. 57. 31-42.
PIRHOFER-WALZL, K.; ASMUSSEN, J.; HØGH-JENSEN, H.; ERIKSEN, J.; SØEGAARD, K.; RASMUSSEN, J. 2011. Nitrogen transfer from forage legumes to nine neighbouring plants in a multi-species grassland. Plant Soil 350: 71-84. doi:10.1007/s11104-011-0882-z
SCHNYDER, H.; LOCHER, F.; AUERSWALD, K. 2009. Nutrient redistribution by grazing cattle drives patterns of topsoil N and P stocks in a low-input pasture ecosystem. Nutr. Cycling Agroecosyst. 88: 183-195. doi:10.1007/s10705-009-9334-z
SCHWINNING, S.; PARSONS, A. 1996. A spatially explicit population model of stoloniferous N-fixing legumes in mixed pasture with grass. Journal of Ecology: 815-826.
SIMON, J.; LEMAIRE, G. 1987. Tillering and leaf area index in grasses in the vegetative phase. Grass Forage Sci. 42: 373-380.
SIMON, P.L.; DE KLEIN, C.A.; WORTH, W.; RUTHERFORD, A.J.; DIECKOW, J. 2019. The efficacy of Plantago lanceolata for mitigating nitrous oxide emissions from cattle urine patches. Sci Total Environ. 691: 430-441.
SLEUGH, B.; MOORE, K.J.; GEORGE, R; Brummer, E.C. 2000. Binary Legume–Grass Mixtures Improve Forage Yield, Quality, and Seasonal Distribution. Agron. J. 92: 24-29.
SOUSSANA, J.F.; TALLEC, T. 2009. Can we understand and predict the regulation of biological N2 fixation in grassland ecosystems? Nutr. Cycling Agroecosyst. 88: 197-213. doi:10.1007/s10705-009-9335-y
SOUSSANA, J.; ARREGUI, M. 1995. Impact de l’association sur le niveau de nutrition azotée et la croissance du ray-grass anglais et du trèfle blanc. Agronomie 15: 81-96.
VALLIS, I. 1978. Nitrogen relationships in grass/legume mixtures. In: WILSON, J.R. (Ed.). Plant Relations in Pastures. CSIRO, Melbourne, Vic. 190-201 pp.
WETSELAAR, R.; GANRY, F. 1982. Nitrogen balance in tropical agrosystems. In: DOMMERGUES, R; DIEM, H.G. (Eds.). Microbiology of tropical soils and plant productivity. Martinus Nijhoff, Hague. 1-36 pp.
WHITEHEAD, D.C. 1970. The role of nitrogen in grassland productivity. A review of information from temperate regions. Bull. 48. Commonwealth Bur. Past. Fld. Crops Farnham Royal: Common W. Agric. Bur.
WHITEHEAD, D.C. 1995. Grasses: Uptake of nitrogen and effects on morphology and physiology. In: WHITEHEAD, D. (Ed.). Grassland nitrogen. CAB International, UK. 16-34 pp.
WOLEDGE, J.; PEARSE, P.J. 1985. The effect of nitrogenous fertilizer on the photosynthesis of leaves of a ryegrass sward. Grass Forage Sci. 40: 305-309.
ZADOKS, J.C.; CHANG, T.T.; KONZAK, C.F. 1974. A decimal code for the growth stages of cereals. Weed Res. 14: 415-421.