Artículos
Effects of Bt soybean on biodiversity are limited to target species and host-specific parasitoids in La Pampa province, Argentina
Effects of Bt soybean on biodiversity are limited to target species and host-specific parasitoids in La Pampa province, Argentina
RIA. Revista de Investigaciones Agropecuarias, vol. 50, núm. 3, pp. 112-129, 2024
Instituto Nacional de Tecnología Agropecuaria

Esta obra está bajo una Licencia Creative Commons Atribución-NoComercial 4.0 Internacional.
Abstract: Bt crops were incorporated in South America more than 20 years ago and their use has increased sharply since then. However, the potential negative environmental effects are still a concern, specifically, the impacts on non-target arthropod species. The objective of this work was to determine if the effects of Bt soybean are limited to the removal of the larvae of target Lepidoptera species or if they also indirectly affect the arthropod community. Bt soybean expressing Cry1Ac toxin and non-Bt soybean were planted under the same environmental and agricultural conditions at two planting dates (early and late planting dates). None of the cultivars received insecticide applications. The abundance of phytophagous insects and predatory arthropods was recorded in each treatment (cultivar × planting date). Moreover, the larvae Lepidopteran, stink bugs and eggs of both groups were collected and maintained under controlled rearing conditions to record parasitoids. The diversity of the arthropod assemblage, as well as that of the phytophagous and entomophagous subassemblages of each treatment, and the similarities between them were estimated with and without the presence of target species and their parasitoids. The range-abundance curves were plotted following the same criteria. The diversity was higher in the non-Bt cultivar than in the Bt one. No clear effects of planting date were detected. A high similarity was found among treatments. Our results show that the removal of the target species larvae and their specific parasitoids is sufficient to explain the effect of the Bt soybean on the richness and diversity of the arthropod assemblage as well as those of the phytophagous and entomophagous subassemblages, with no evidence of additional indirect effects on biodiversity.
Keywords: Bt crops, arthropods, indirect effects.
Resumen: Los cultivos Bt se incorporaron ampliamente en los sistemas productivos de América del Sur siguiendo una pronunciada curva de adopción iniciada hace más de 20 años. Sin embargo, los posibles efectos ambientales negativos siguen siendo una preocupación, específicamente, los impactos sobre las especies de artrópodos no blanco. El objetivo de este trabajo fue determinar si los efectos de la soja Bt se limitan a la remoción de larvas de las especies lepidópteras blanco de la toxina o presentan efectos indirectos sobre la comunidad de artrópodos. Se sembraron sojas Bt (que expresan la toxina Cry1Ac) y no Bt bajo las mismas condiciones ambientales y agrícolas en dos fechas de siembra (fecha de siembra temprana y fecha de siembra tardía). El ensayo se mantuvo sin aplicaciones de insecticidas. Se registró la abundancia de insectos fitófagos y de artrópodos predadores en cada tratamiento (variedad × fecha de siembra). Además, se colectaron larvas de lepidópteros, chinches fitófagas y huevos de ambos grupos. Los individuos y huevos recolectados se mantuvieron bajo condiciones controladas con el fin de obtener y registrar parasitoides. Se estimó la diversidad y similitud y se trazaron las curvas rango-abundancia para el ensamble de artrópodos y los subensambles de insectos fitófagos y artrópodos entomófagos con y sin presencia de especies blanco y sus parasitoides. La diversidad resultó alta en la variedad no Bt. No se detectaron efectos claros de la fecha de siembra. Se encontró una similitud elevada entre los tratamientos para los ensambles y subensambles. Nuestros resultados muestran que los efectos de la variedad Bt sobre la comunidad de artrópodos de soja se debe a la eliminación de las larvas de especies blanco de la toxina y sus parasitoides específicos, sin evidencias de efectos indirectos adicionales sobre la biodiversidad.
Palabras clave: cultivos Bt, artrópodos, efectos indirectos.
INTRODUCTION
Biodiversity is a key issue for sustainable development (Ammann, 2009) it helps maintaining the structure of communities and food chains (Carmona Galindo and Carmona, 2013) and provides a series of ecosystem services considered of environmental, economic and social importance (Mace et al., 2012). Therefore, biodiversity conservation is considered a priority for agriculture (Bàrberi, 2013). It has been argued that agricultural intensification could be the main driver of its deterioration (Andrade, 2017; Arpaia, 2021).
Arthropods are the animal group with the greatest presence and diversity in agroecosystems (Hernández-Aranda et al., 2022), contributing to important services such as pollination, pest control, decomposition and nutrient recycling (Haan et al., 2021). Less than 0.5% of the insect species are considered pests (Jankielsohn, 2018). Bt crops are genetically modified (GM) crops expressing genes derived from the soil bacterium Bacillus thuringiensis (Catarino et al., 2015; Manjunath, 2020). GM crops produce proteins that are toxic to specific insect pests (Abbas, 2018). Bt crops are considered important tools that contribute to the diversification of integrated pest management tactics (Anderson et al., 2019) and provide effective control of lepidopteran pests in soybean crops (Blanco et al., 2016). While part of the literature claims that Bt crops can benefit arthropod diversity thanks to the lower use of insecticides (Hoy et al., 1998; Carpenter, 2011; Abbas, 2018; Anderson et al., 2019; Romeis et al., 2019), some concerns have been expressed regarding the potential negative impacts on non-target species, which threaten biodiversity in agroecosystems (Garcia and Altieri, 2005; Arpaia, 2010; Naranjo et al., 2019). Possible negative effects could occur by direct and indirect mechanisms caused by Bt endotoxins on non-target species, like the following: 1) insects could come into direct contact with Bt proteins when feeding on plant tissues or through the preys and hosts that acquired the toxin by feeding on Bt plants (Romeis et al., 2009); 2) population abundances of non-target species could increase through non-competitive effects caused by the absence of the target species (Naranjo et al., 2008; Zeilinger et al., 2016); and 3) the presence or abundance of natural enemies may decrease as an indirect effect of reduced emission of attracting volatiles by plant tissues usually triggered by herbivore damage (Liu et al., 2015; Nascimento et al., 2021).
South America is one of the most important soybean producers globally, with Brazil and Argentina comprising 50% of the world production (Meira et al., 2019). Bt soybean cultivars expressing Cry1Ac toxin represent 25% and 80% of the whole area planted to soybeans in Argentina and Brazil, respectively (Horikoshi et al., 2021; REM, 2021). Soybean planting during the 2021/2022 season covered about 16.1 million hectares in Argentina and 74.5 million hectares in Brazil (Conab, 2022; MAGyP, 2022).
We pose the question of whether the influence of Bt soybean on the arthropod community is limited to the removal of the lepidopteran species targeted by the toxin or the community composition is also influenced by indirect effects. Due to the high adoption level and regional importance of Bt-soybean crops in most soybean production areas in South America, we proposed it as a model crop to explore this question. Under the working hypothesis that the indirect effects would reach the entire community, we predicted that the differences in the arthropod assemblages between Bt soybeans and conventional soybeans would not lie only in the absence of target species.
MATERIAL AND METHODS
Experimental design and data collection
During the 2018/2019, 2019/2020 and 2020/2021 growing seasons, two field experiments with different planting dates (early and late) were established in a split-block design at the Estación Experimental Agropecuaria Guillermo Covas, INTA, located in Anguil, La Pampa province, Argentina (36o32’15”S; 63o 59’32”O). The environment in which the field experiments were located corresponded to the typical crops of the region (maize, sunflowers and alfalfa). In each of the experiments, Bt and non-Bt soybean cultivars belonging to the same maturity group were planted. None of the cultivars received insecticide applications. The treatments were determined by the planting date × soybean cultivar combination. Each treatment consisted of 4 replicates of 1750 m2 each. The contrasting planting dates were used to estimate the abundance of phytophagous and entomophagous arthropods. To estimate arthropod abundance, each of the replicates were weekly monitored using a systematic design. Ten sampling units were taken following systematic patterns (“W”, “M”, “X”) on successive sampling dates to reduce the probability of overlapping between samples (Pedigo and Buntin, 1994). The vertical cloth technique (Gamundi, 1995) was used to sample arthropods present in the canopy. Each sample consisted of n=10 sampling units. A sweep net (36 cm hoop diameter, 60 cm deep sleeve and 70 cm handle) was used to collect jumping (Ves Losada and Baudino, 1998; Cuirolo, 2005) and flying (Chanthy et al., 2015) insects. A sampling scheme with a fixed sample size (n=10) was implemented. Each sample unit was represented by 5 180° angle-sweeps of the net (Vyavhare et al., 2015).
To determine the abundance of parasitoids, all the lepidopteran larvae, stink bugs, and the eggs of the lepidoptera and pentatomid species were collected. The eggs were collected manually from the plants present in each 1-meter segment of the plant row (sampling unit), which was delimited using the vertical cloth method. All the collected specimens were transferred to the laboratory, where they were sorted by species and labeled, including information of the treatment and the date of collection. Each insect and each egg or egg mass was isolated individually in plastic containers of 7.5 × 10.5 Diam × Ht, covered with plastic wrap and kept under controlled rearing conditions (24 ± 1°C, 70 ± 10% RH) until their cycle was completed, parasitoids emerged or eggs hatched. The material was monitored weekly. The lepidoptera larvae were fed soybean leaves and pods extracted from the field and previously examined to avoid contamination with other insects. Stink bugs were fed pods of Phaseolus vulgaris L. The taxonomic determination of the lepidopteran larvae (Barrionuevo, 2011), stink bugs (Saini, 1984; 1987; 1988), entomophagous arthropods and other groups of insects (Triplehorn and Johnson, 2005) was carried out based on specific literature and consultations with taxonomy experts. For all the analyses, each parasitoid obtained in the laboratory was incorporated and the date, treatment and replicate from which its host was collected were recorded. We assumed that each new parasitoid originated from a different female.
Diversity analysis
The diversity of the assemblages of each treatment was calculated and compared through the Hill’s numbers of order q = 0, 1 and 2. When q = 0, 0D is species richness; If q = 1, 1D is the Shannon entropy exponential; and when q = 2, 2D is the inverse of Simpson’s concentration index (Chao et al., 2014). The diversities were estimated in standardized samples with a common sample completeness value to compare assemblages and subassemblages with equal coverage (Chao et al., 2016). The iNEXT package (Hsieh et al., 2016; Hsieh et al., 2020) run in R software (R Core Team, 2021) was used to obtain the estimates of diversity and their 95% confidence intervals (CI) for the minimum common coverage among all assemblages and subassemblages of each treatment. Additionally, in order to identify effects on the diversity of less frequent species, the Chao-1 index and its CI were estimated in the PAST software (Version 3.20) (Hammer et al., 2001). The CIs were used to compare the diversity estimates.
Similarity analysis
The SpadeR software in its online version was used to estimate the similarity measures for orders q = 0 (Sørensen index), 1 (Horn) and 2 (Morisita - Horn index), based on abundance data (Jost, 2006; Chao et al., 2015). The CIs were used to compare the similarity measures.
Rank-Abundance curves
The rank-abundance curves for the assemblage of arthropods, as well as the subassemblages of phytophagous insects and entomophagous arthropods, were elaborated in the PAST software (Version 3.20) (Hammer et al., 2001). The adult moths were removed from the records to avoid interference in the analysis since they were recorded in both cultivars.
For the arthropod assemblages, rank-abundance curves were compared among Bt and non-Bt cultivars, with early and late planting date combinations, and with and without Lepidoptera larvae —the target insect of Cry1Ac protein— and their parasitoids. For the phytophagous and entomophagous subassemblages, rank-abundance curves were compared among the same combinations of soybean cultivars and planting dates, but with and without target Lepidoptera larvae of the Cry1Ac protein and with and without parasitoids of Lepidoptera larvae, respectively.
The plotted data were adjusted to a standard abundance model of the geometric type, which fits the abundances of species observed in very unequal communities with low diversity (He and Tang, 2008), as are the communities of agroecosystems, particularly those of extensive productive systems. The k parameter of the geometric series can be considered an indicator of the complexity of the species composition in the system (Ferreira and Petrere, 2008); therefore, it was used to compare the rank-abundance curves.
RESULTS
The results of the diversity analysis show that, in general, the whole arthropod assemblage as well as the entomophagous subassemblage were more diverse in the non-Bt cultivar, regardless of the diversity indices analyzed. More precisely, richness (q=0) was higher in non-Bt than Bt only in late plantings (table 1 and 2). The subassemblage of phytophagous insects showed similar results, except for species richness, with no significant differences between treatments (table 3). The planting date did not exhibit clear effects on the diversity of the assemblages and subassemblages studied. Sampling completeness was close to 100% (tables 1, 2 and 3). The Chao-1 index also showed high similarity between the assemblages (table 4).
The Sorenson index varied from 0.52 to 1 but showed no significant differences of similarity among treatment pairs, implying that similarities do not depend on cultivar or planting dates. Horn and Morisita-Horn indices yielded high similarity values, both for the arthropod assemblage (from 0.84 to 0.98; table 5) and for the entomophagous (from 0.86 to 0.99; table 6) and phytophagous subassemblages (from 0.82 to 0.99; table 7) separately. When the Horn index was applied for arthropod assamblages (table 5), the highest similarity occurred between early and late plantings of the non-Bt cultivar. However, this similarity did not differ from that between early and late plantings of the Bt cultivar. In other words, the similarity between early and late plantings is independent of the cultivar. In the case of phytophagous subassemblages (table 7), the similarity between early and late planted plots with the non-Bt cultivar was significantly higher than the rest of the contrasts. This implies that the cultivar affects the similarity between the subassemblages present in plots of different planting dates. Regarding entomophagous (table 6), no significant differences were found between any treatment combinations except the most contrasting one (early non-Bt - late Bt) in which the similarity was the lowest.
When the Morisita Horn index was used for arthropod assemblage (table 5) and phytophagous subassemblage (table 7) the similarity between early and late planted plots with the non-Bt cultivar was significantly higher than the rest of the contrasts. With respect to the entomophagous subassemblage (table 6), the highest similarity was found for the early planted non-Bt and Bt treatments. But this was not different from the late planted Bt and non-Bt plots. In other words, planting date has no effect on the similarity between the assemblages of the different cultivars. The species composition and relative abundances within each assemblage (defined by planting date × soybean cultivar combination) are presented for each agricultural season in tables 8 and 9.
Figures 1, 2. 3 show the rank-abundance curves for the arthropod assemblages and the subassemblages of entomophagous arthropods and phytophagous insects. The value of the parameter k is indicated in each curve to allow for comparisons between the different treatments of each assemblage and subassemblage. Once the data of the target species larvae, their parasitoids, and the two combined were removed from the non-Bt cultivar data set, the values of the parameter k increased considerably, equaling or exceeding those obtained in Bt-soybean. For the entomophagous arthropods subassemblage in late plantings, the non-Bt plots with parasitoids removed exhibited an intermediate k parameter value, lying between the non-Bt plots with parasitoids present and the Bt cultivars.
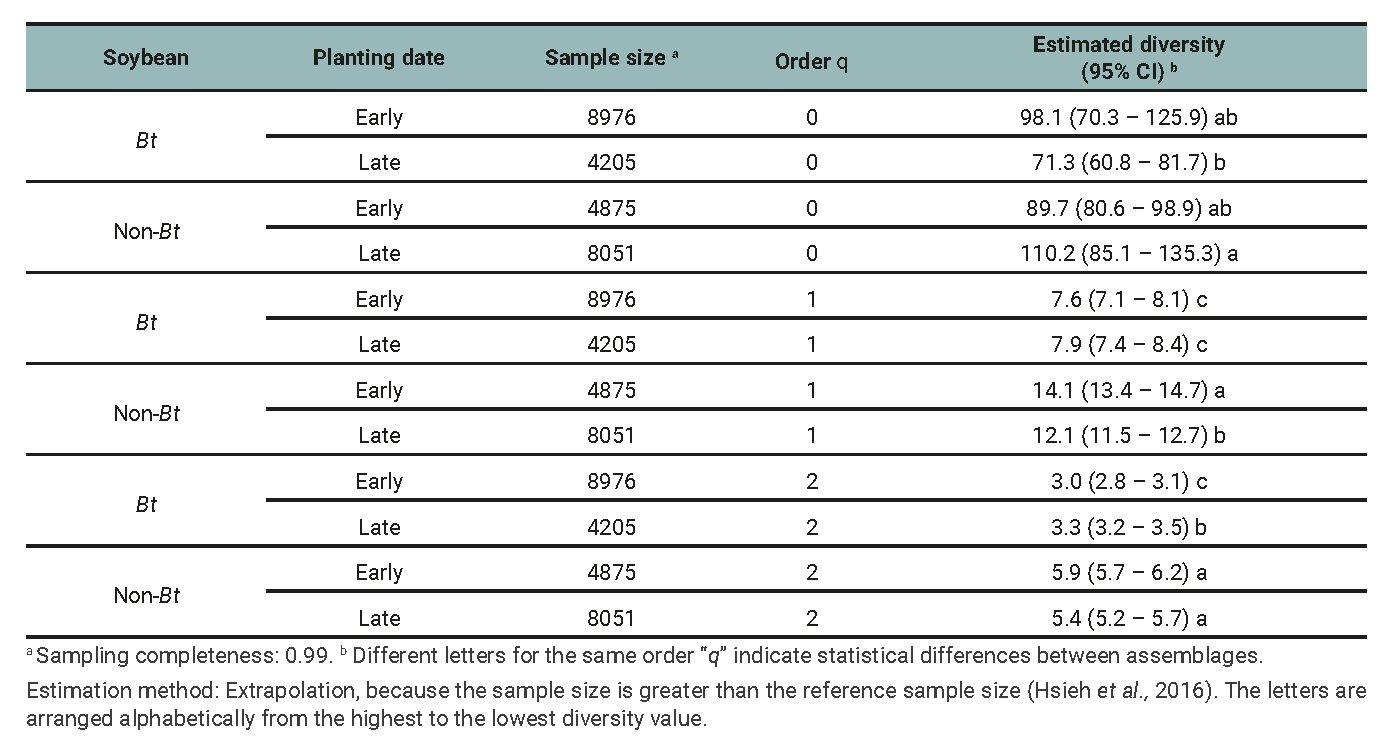
Table 1
Arthropod assemblage: Species richness (0D), Shannon entropy exponential (1D), inverse of Simpson’s concentration index (2D), and their respective 95% confidence intervals (CI) for the minimum common cover among treatments determined by the planting date (early and late) and soybean cultivar (Bt and non-Bt) combination for data of 2018/2019, 2019/2020, and 2020/2021 growing seasons.
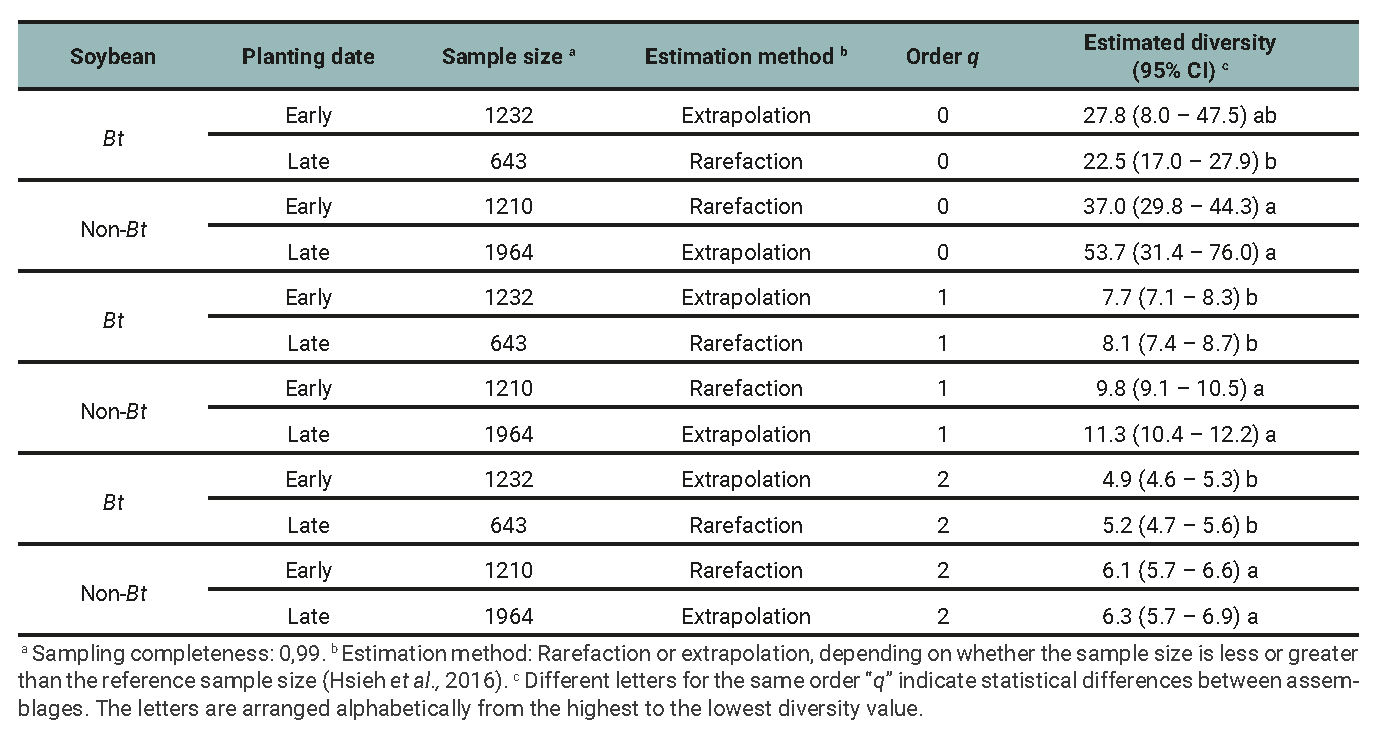
Table 2
Entomophagous arthropod subassemblage: Species richness (0D), Shannon entropy exponential (1D), inverse of Simpson’s concentration index (2D), and their respective 95% confidence intervals (CI) for the minimum common cover among treatments determined by the planting date (early and late) and soybean cultivar (Bt and non-Bt) combination for data of 2018/2019, 2019/2020 and 2020/2021 growing seasons.
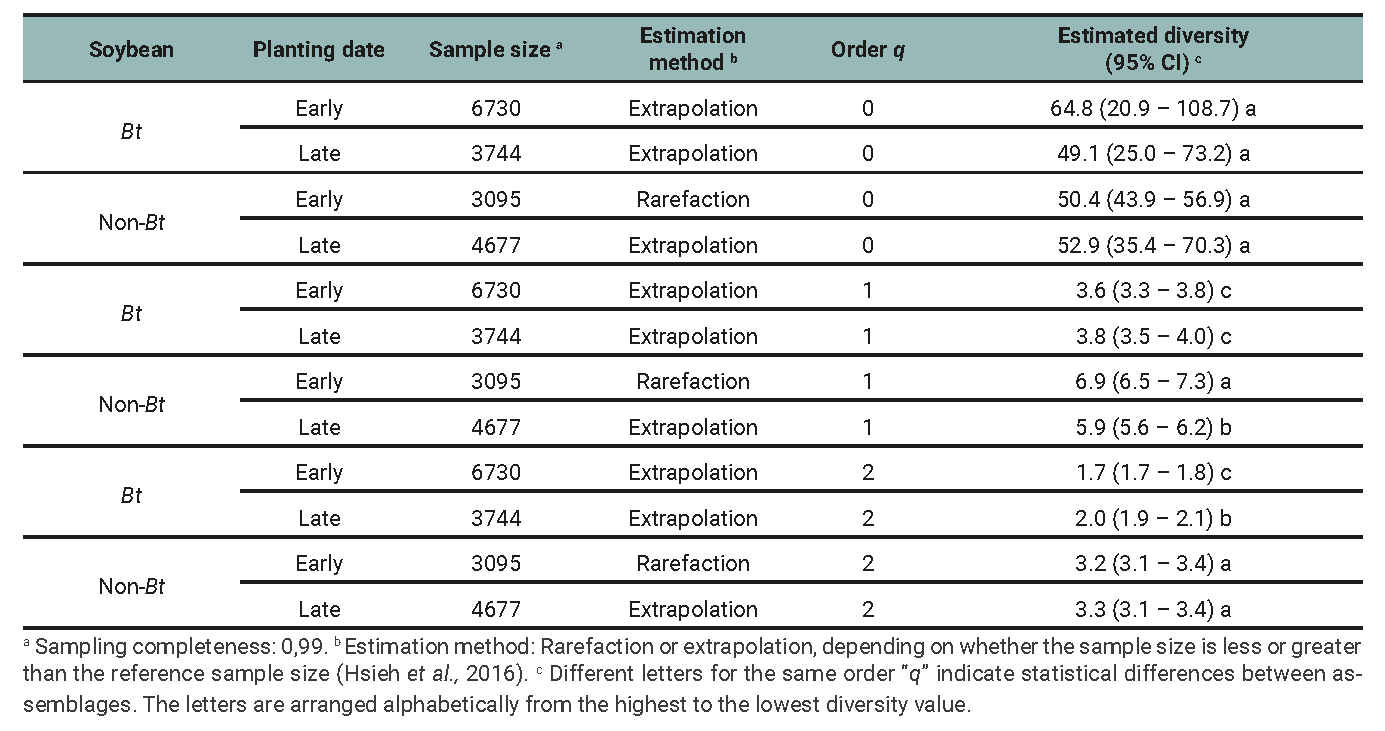
Table 3
Phytophagous insect subassemblage: Species richness (0D), Shannon entropy exponential (1D), inverse of Simpson’s concentration index (2D), and their respective 95% confidence intervals (CI) for the minimum common cover among treatments determined by the planting date (early and late) and soybean cultivar (Bt and non-Bt) combination for data of 2018/2019, 2019/2020 and 2020/2021 growing seasons.
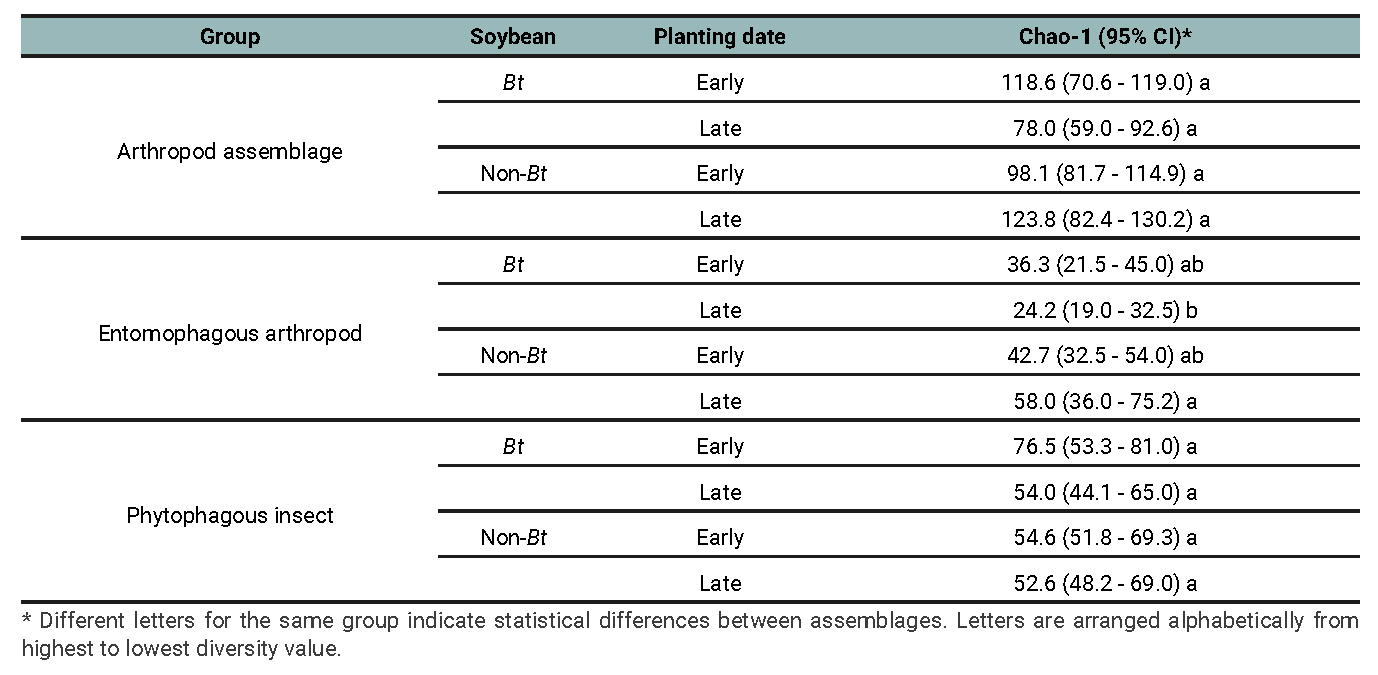
Table 4
Arthropod assemblage, Entomophagous arthropod subassemblage and Phytophagous insect subassemblage: Chao-1 index and their respective 95% confidence interval (CI) for the treatments determined by the planting date (early and late) and soybean cultivar (Bt and non-Bt) combination for data of 2018/2019, 2019/2020 and 2020/2021 growing seasons.
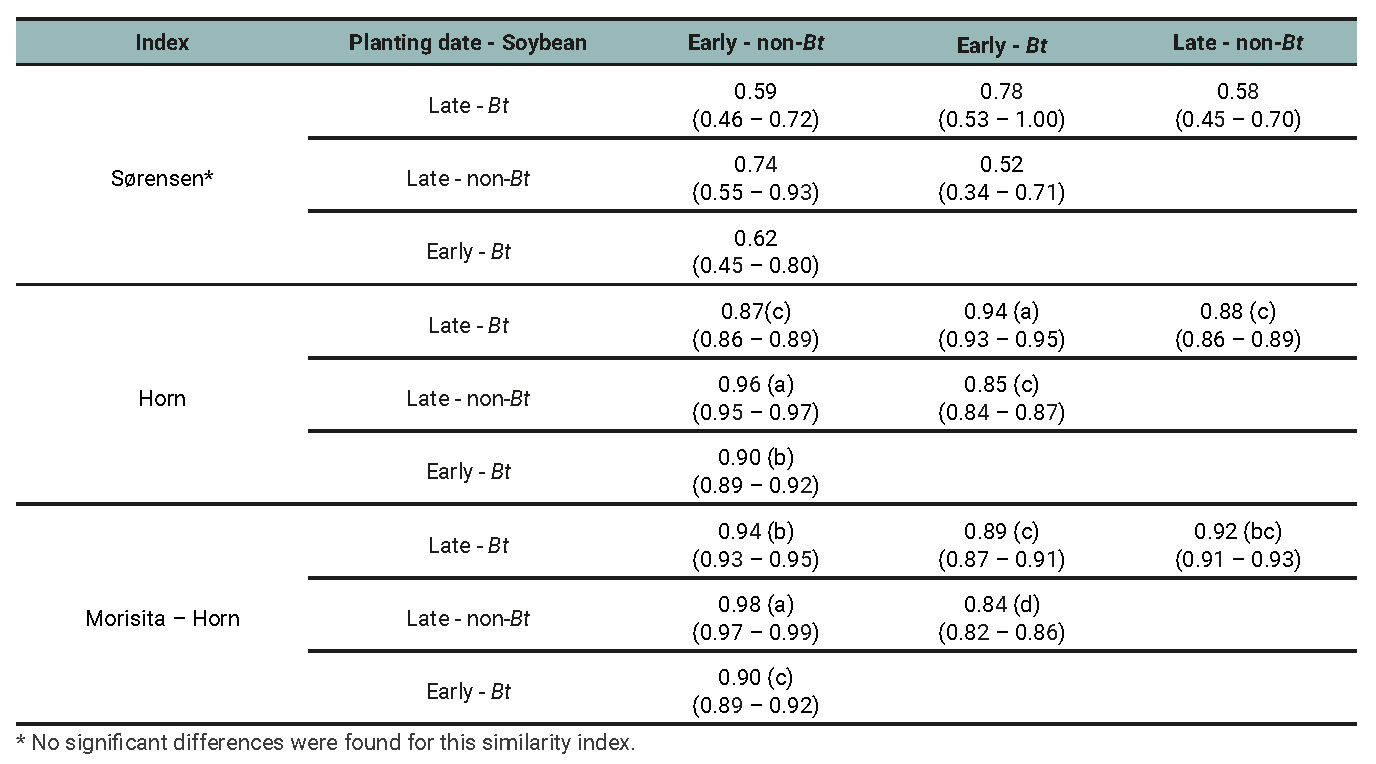
Table 5
Arthropod assemblage: Similarity index between treatments determined by the planting date (early and late) and soybean cultivar (Bt and non-Bt) combination for the data of three growing seasons.
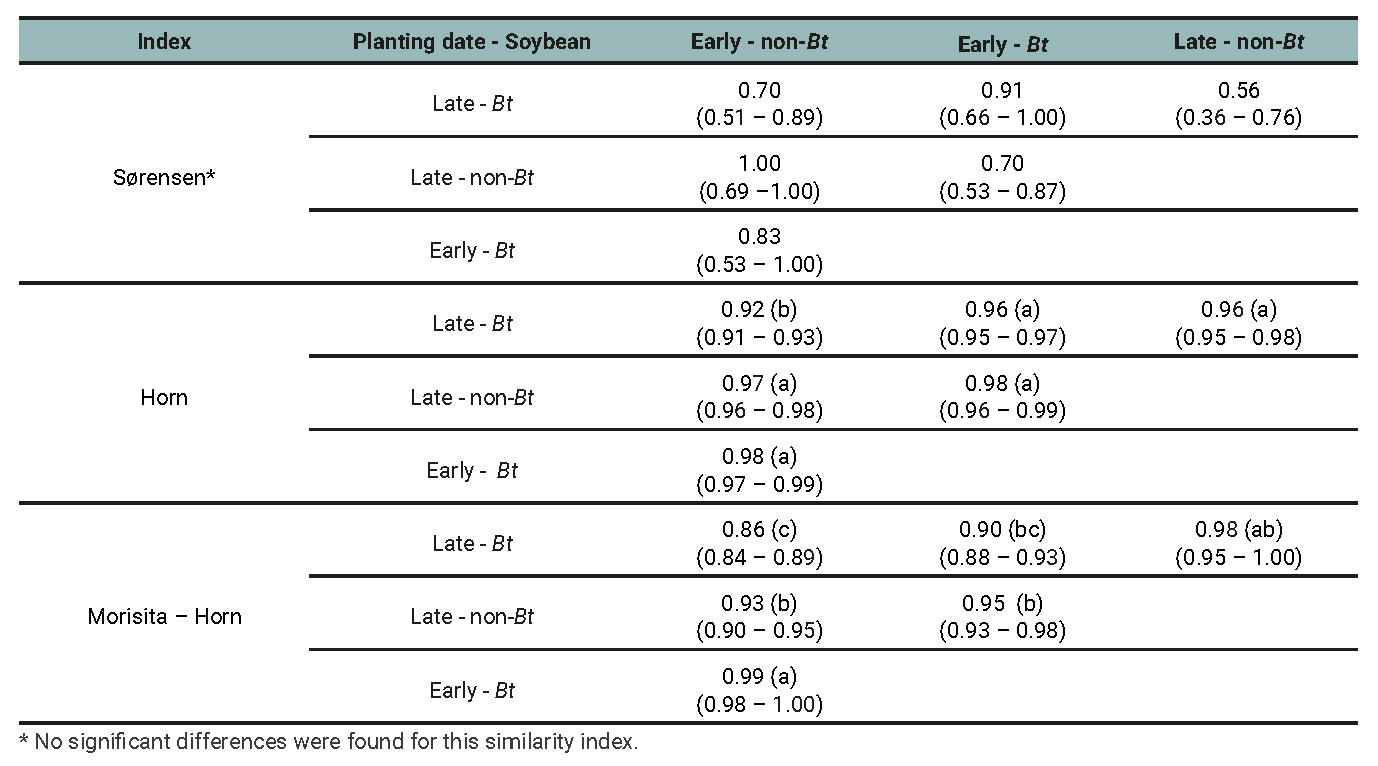
Table 6
Entomophagous arthropod subassemblage: Similarity index between treatments determined by the planting date (early and late) and soybean cultivar (Bt and non-Bt) combination for the data of three growing seasons.
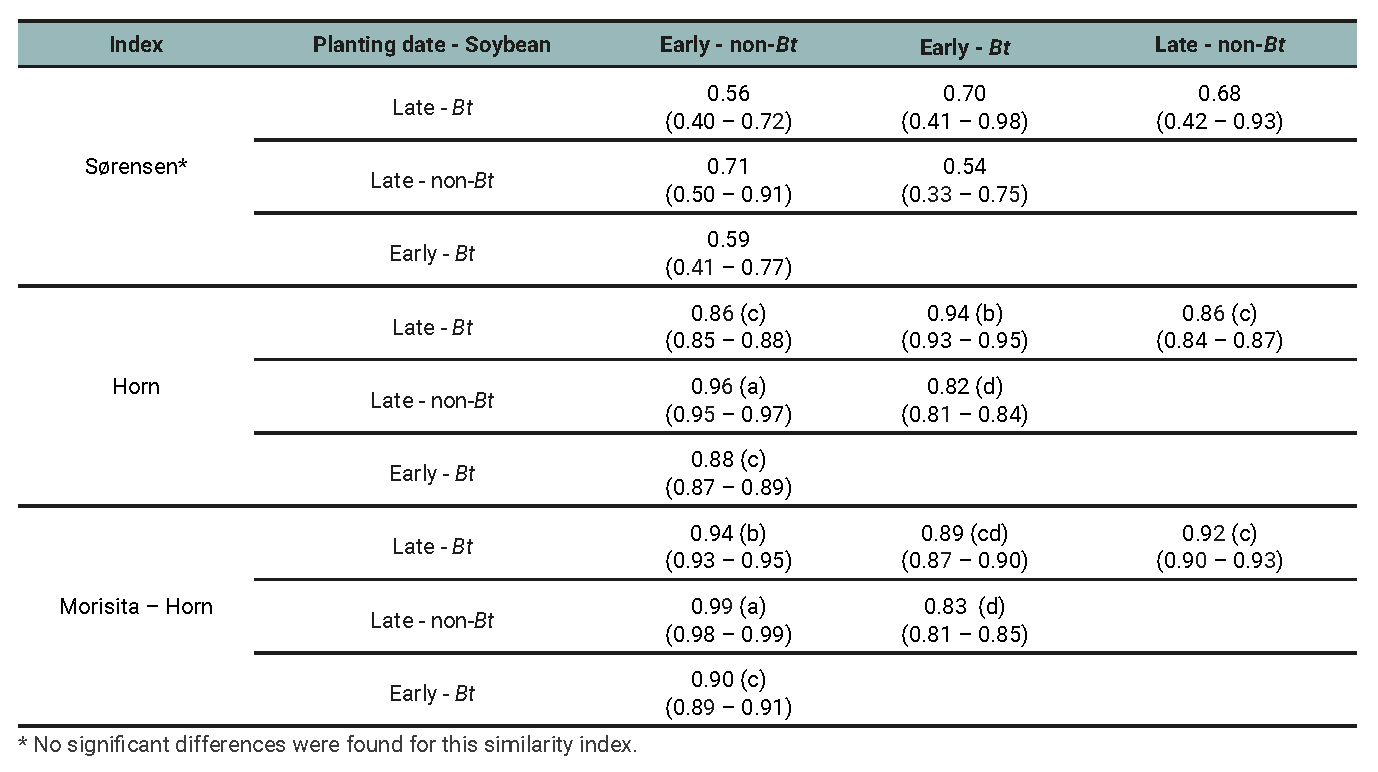
Table 7
Phytophagous subassemblage: Similarity indices between treatments determined by the planting date (early and late) and soybean cultivar (Bt and non-Bt) combination for data of three growing seasons.
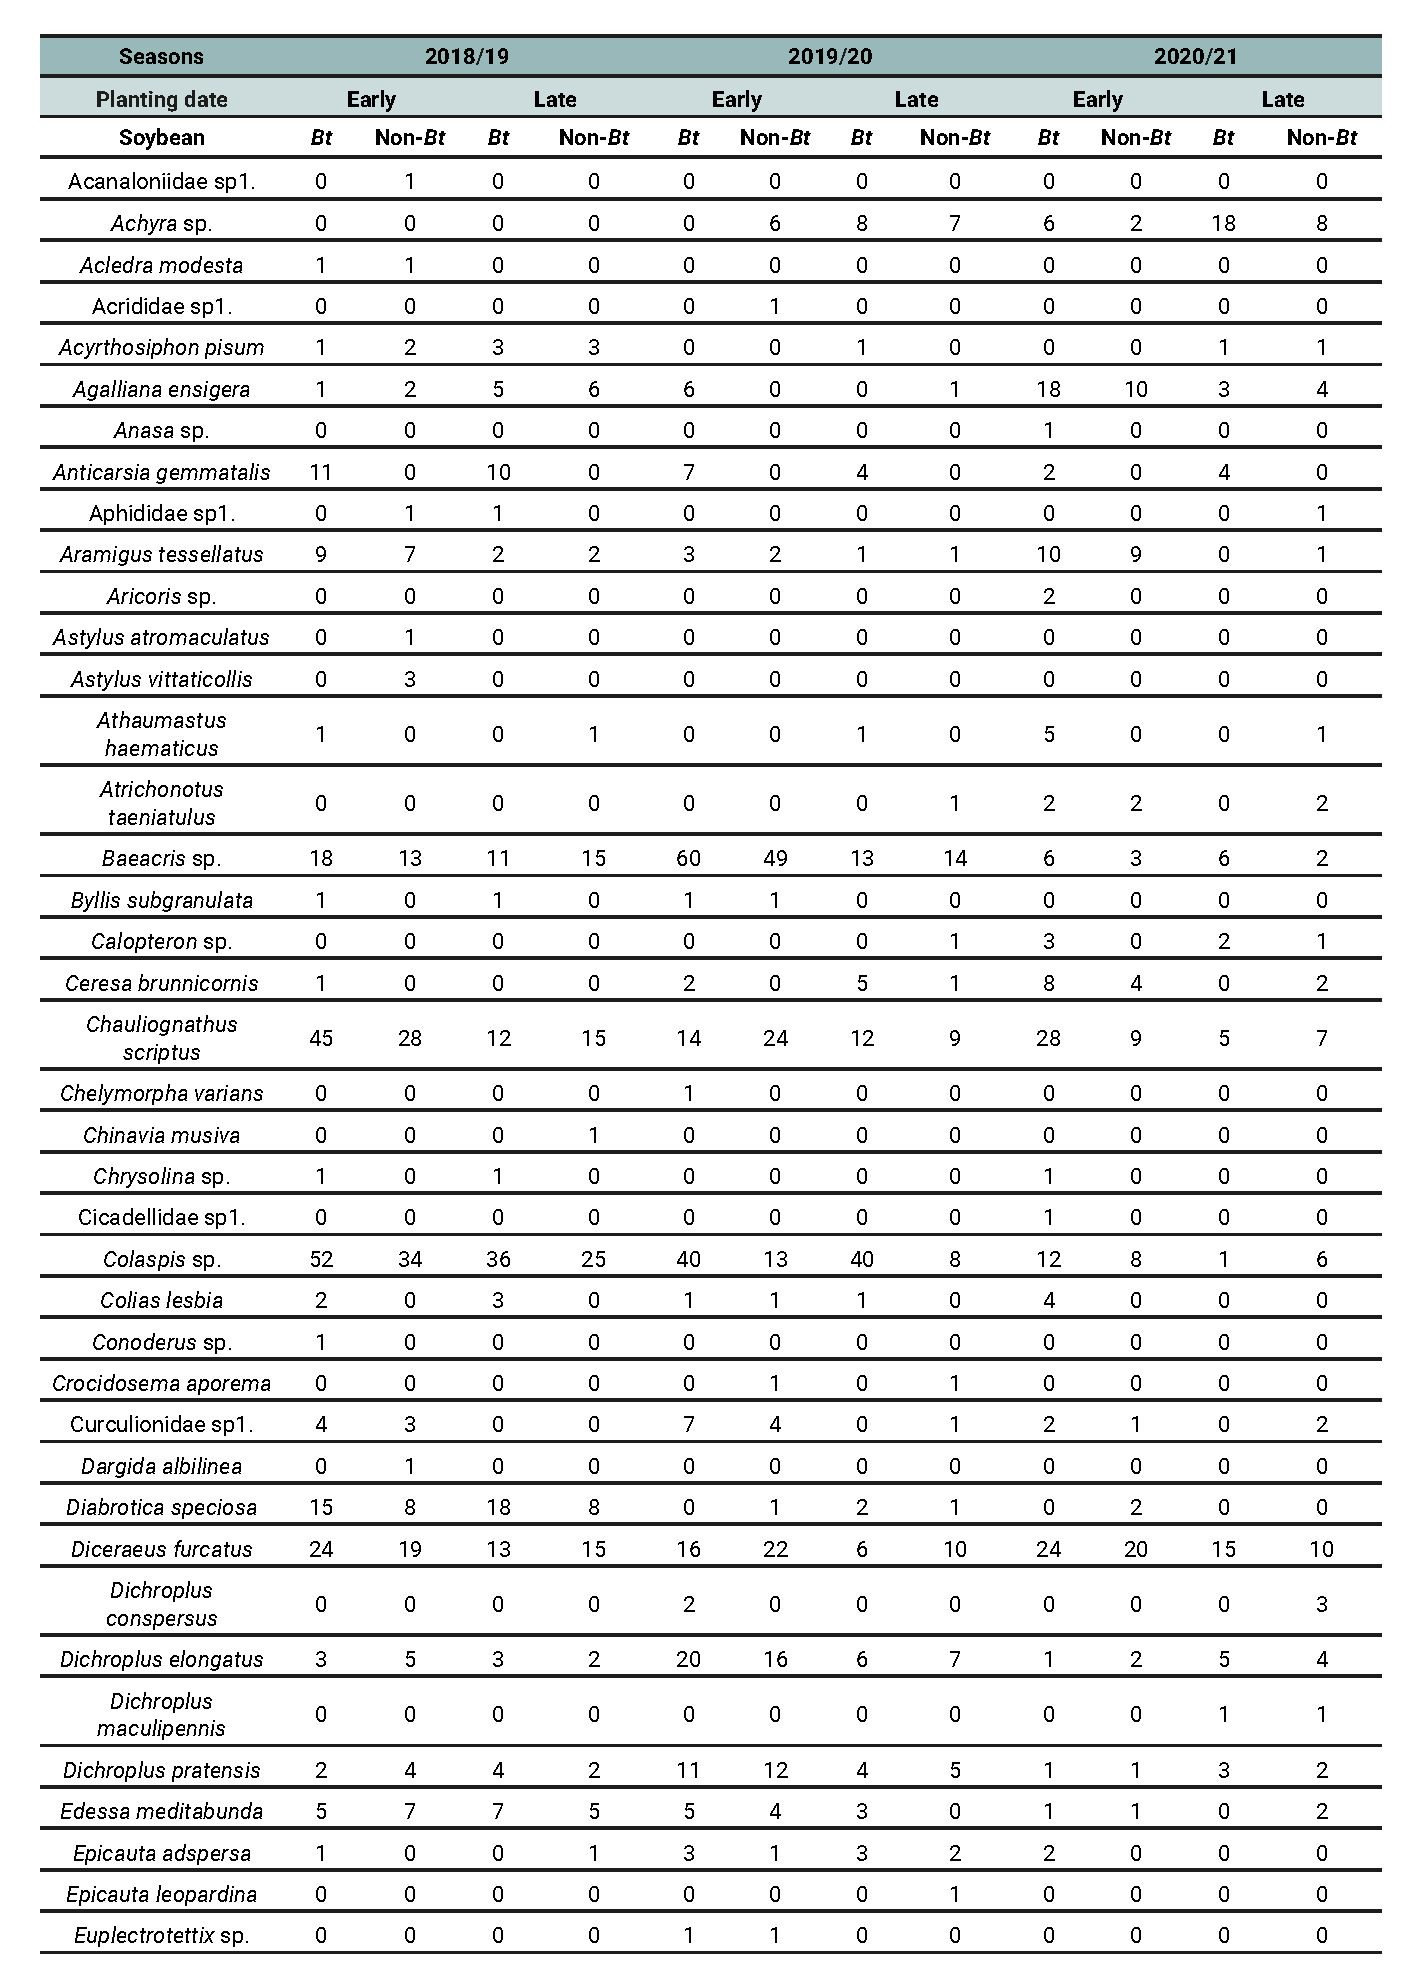
Table 8 - Part 1 of 2
Abundance of phytophagous species recorded across different treatment combinations involving planting date (early vs late) and soybean cultivar (Bt vs non-Bt) for the 2018/2019, 2019/2020, and 2020/2021 growing seasons in Anguil, La Pampa (Semiarid Pampean Region).
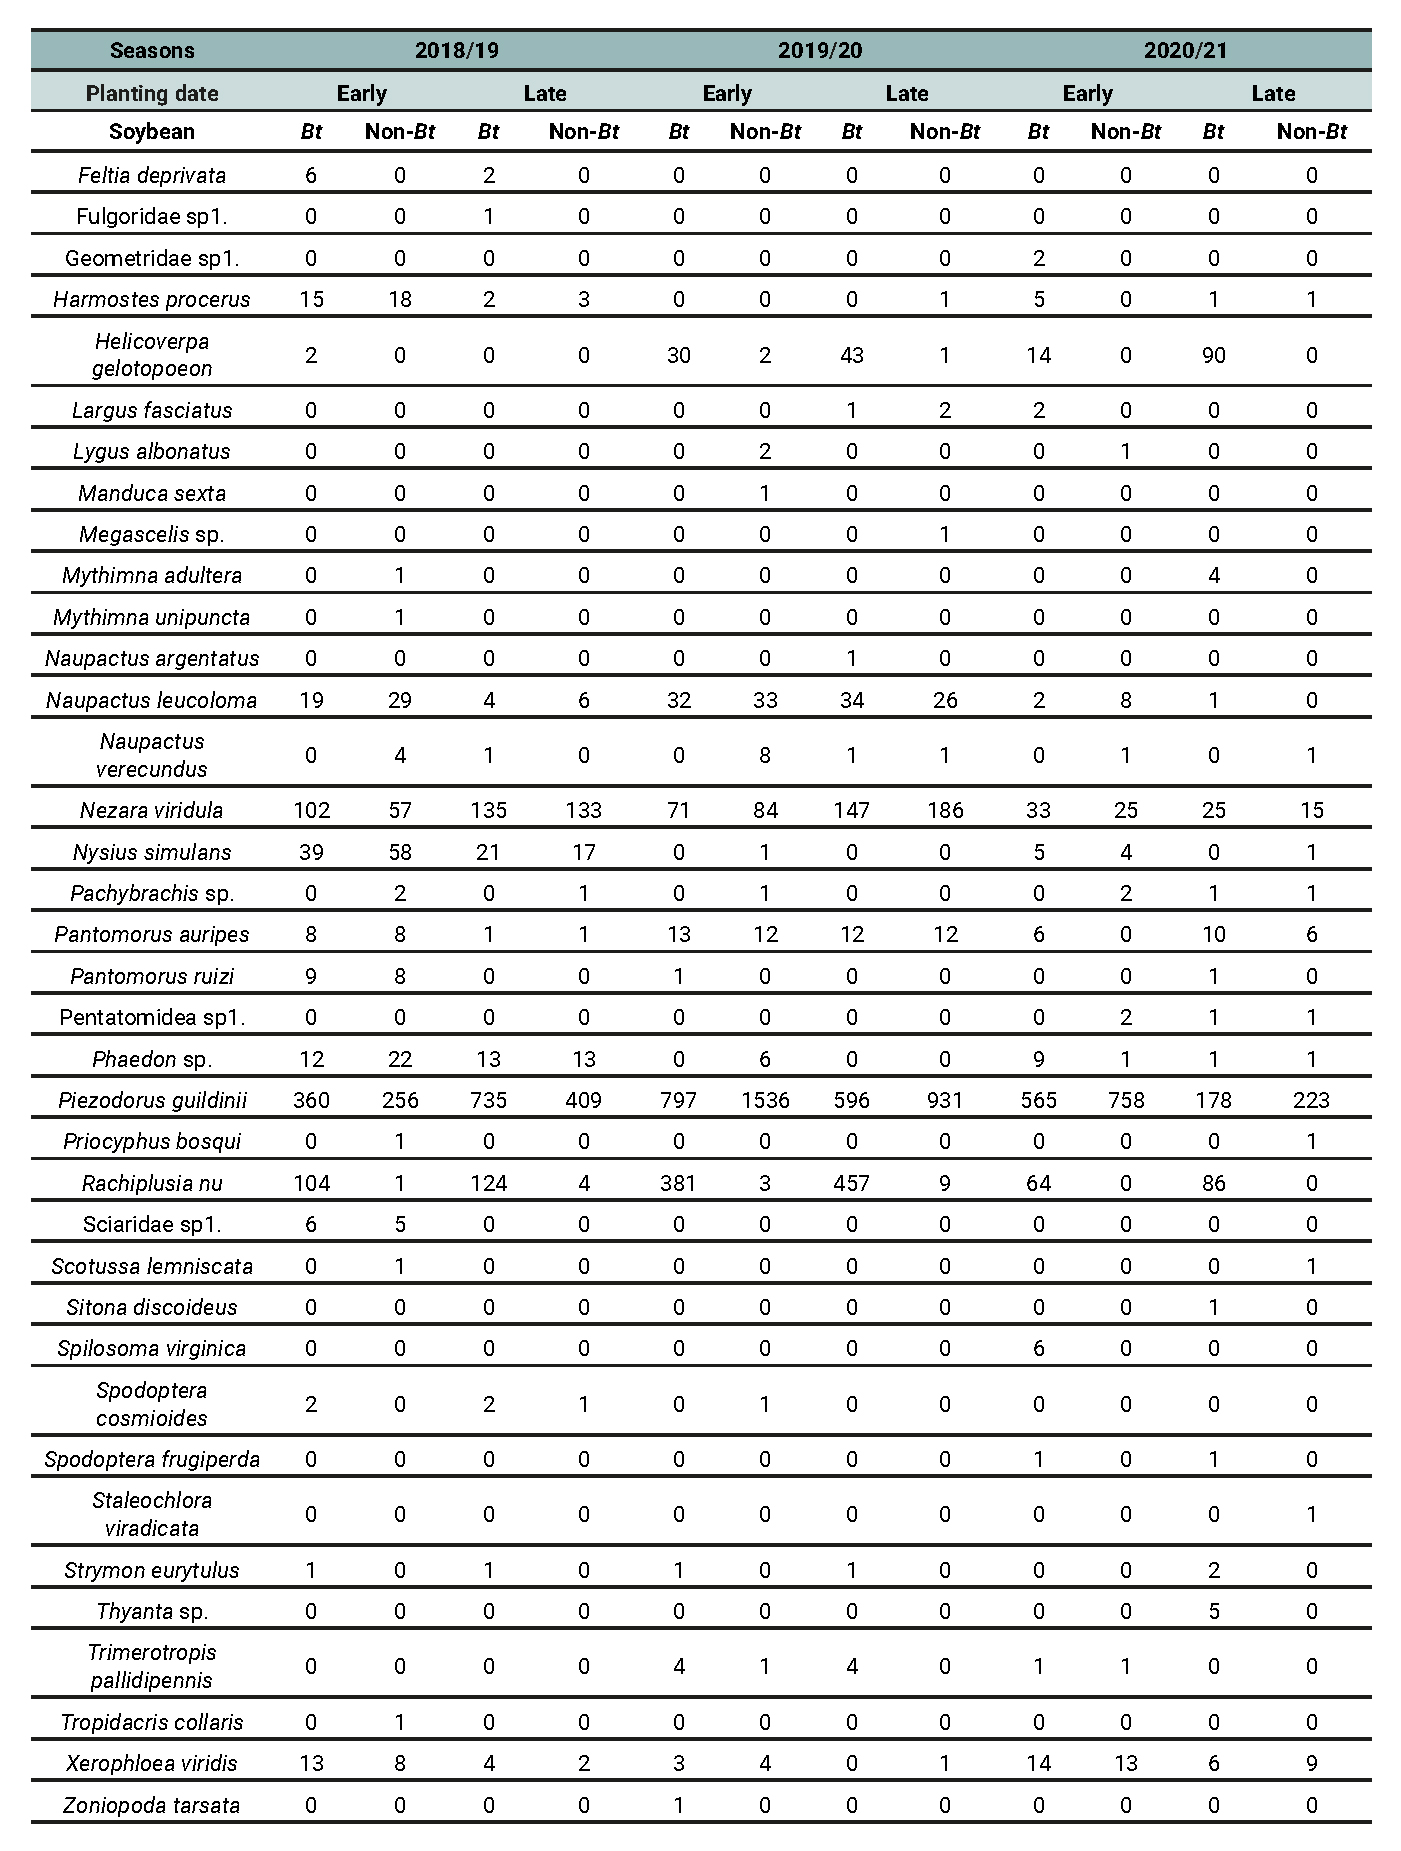
Table 8 - Part 2 of 2
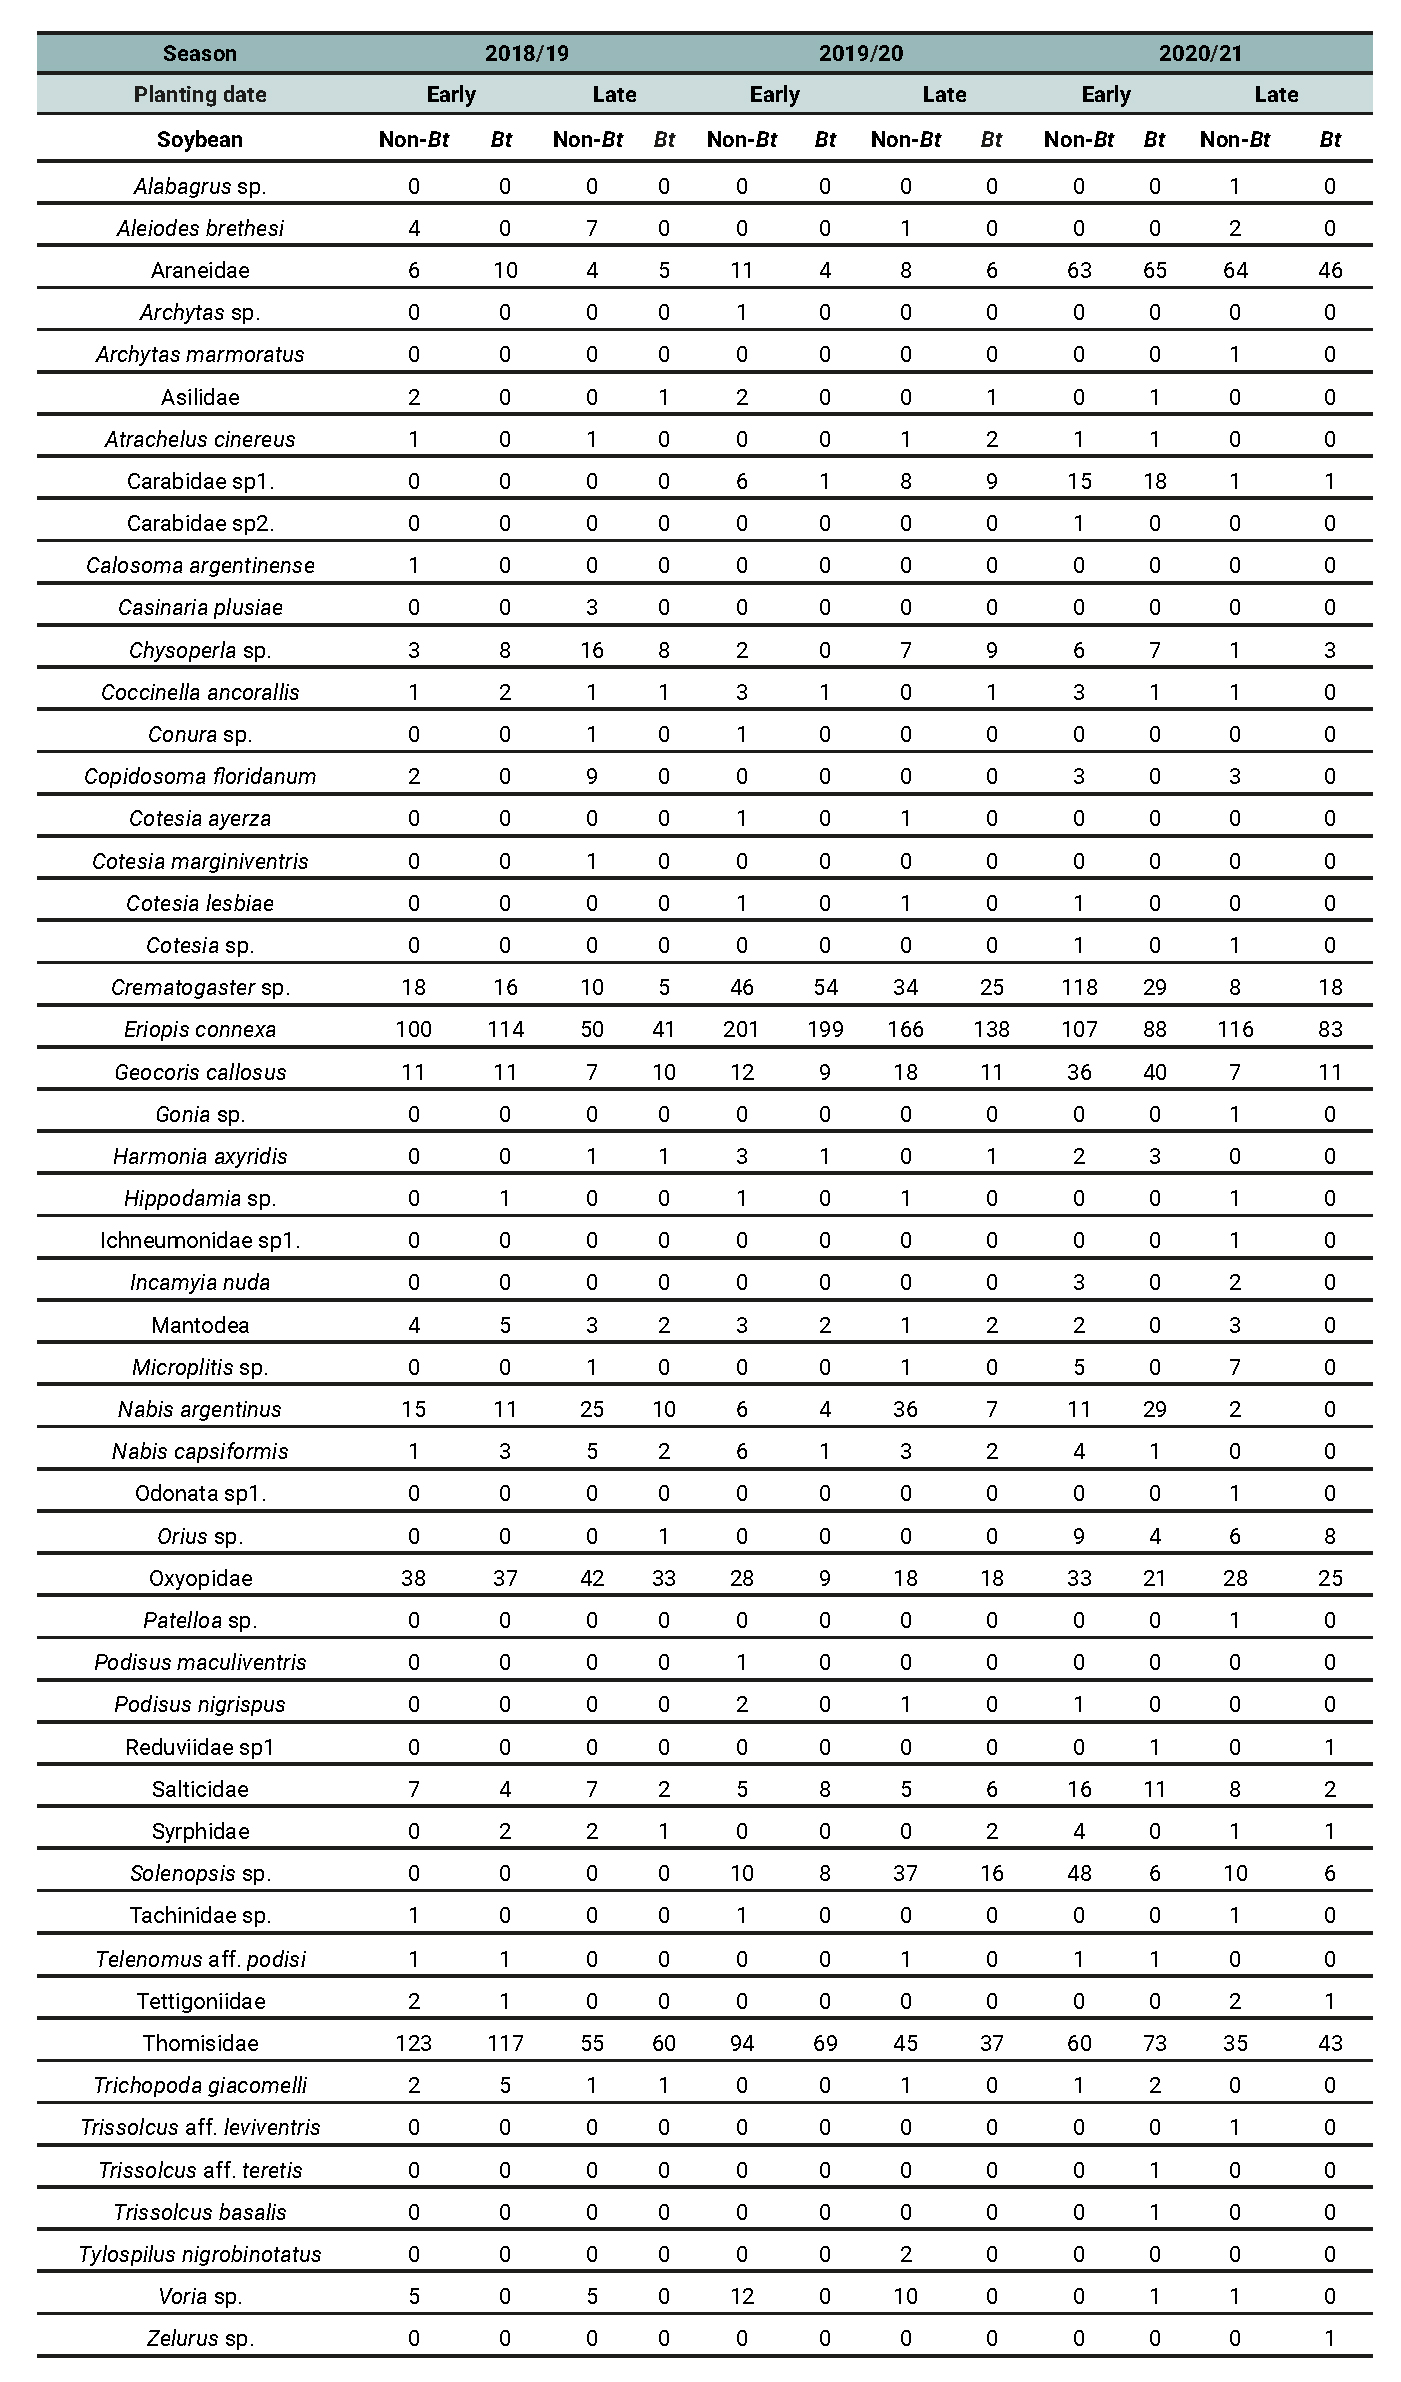
Table 9
Abundance of entomophagous species recorded across different treatment combinations involving planting date (early vs late) and soybean cultivar (Bt vs non-Bt) for the 2018/2019, 2019/2020, and 2020/2021 growing seasons in Anguil, La Pampa (Semiarid Pampean Region).
DISCUSSION
Bt crops have gained momentum in South America, followed by a very fast adoption (Horikoshi et al., 2021; Manzur and Cárcamo, 2014). Nonetheless, the debate on their potential externalities is still present in the literature, with the direct and indirect influence on non-target species (Conner et al., 2003) as a special topic of discussion (Dang et al., 2021; Romeis, 2019). Among the indirect effects, the most basic impact of Bt crops on natural enemies is thought to be the decrease in the availability and quality of their preys and hosts (Faria et al., 2007; Dhillon and Sharma, 2009; Lundgren et al., 2009). Natural enemies that tend to be more specialized (parasitoids) are the most affected by this mechanism (Schuler et al., 1999; Fontes et al., 2002; Frizzas et al., 2017). The hypothesis of indirect effects predicts that arthropod communities differ between Bt and conventional crops. We tested this prediction by focusing on the classical properties of these communities: richness, diversity and similarity.
To obtain robust results, the parameters selected to test the prediction require a high level of sample coverage. Therefore, when coverage is equalized, the bias in diversity comparisons is reduced (Roswell et al., 2021). Low coverage levels provide inaccurate estimates (Chao and Jost, 2012). In this work, the coverages were 99% (tables 1, 2, 3). Other studies on arthropod diversity in field crops show a range of coverage from 95 to 99% (García García et al., 2017; Sanchez et al., 2018). In studies of spider diversity in the tropical forests of Brazil, Azevedo et al. (2013) estimated that from 70% completeness, the sampling effort should be increased greatly to maximize the richness observed effectively. Presumably, it is easier to reach high levels of coverage in agroecosystems than in pristine environments.
Studies on the potential effects of Bt crops on the arthropod communities present in various crops have yielded mixed results. In this work, the effect of the Cry1Ac protein, expressed in Bt soybean cultivars, is limited to the elimination of the larvae of the lepidopteran species targeted by the toxin and, consequently, to the absence of their parasitoids, due to the high host specificity of this group. Whitehouse et al. (2005) detected only subtle differences between the arthropod communities in Bt and conventional cotton. All the diversity indices showed significant differences between treatments, except for the species richness index (D0) of the phytophagous insects subassemblage. The Chao-1 index of the phytophagous and overall arthropod assemblages, showed no differences suggesting lack of effect of rare species while for entomophagous subassamblage in late plantings diversity in Non-Bt was significantly higher than in Bt. In general, we found a higher diversity in the non-Bt cultivar than in the Bt cultivar. Rachiplusia nu (Guenée) is the most abundant species of lepidoptera in the summer crops where the trials were established; therefore, its parasitoids are also abundant (Sierra Fetter and Peralta, 2010; Cisnero and Virano, 2011; Lovera and Roggia 2021). The absence of parasitoids in the Bt cultivar may explain the results found in this work. Several authors found no differences in the arthropods richness, diversity or dominance between Bt and non-Bt cultivars (Rose and Dively, 2007; Dhillon and Sharma, 2013; Sosa and Almada, 2014; Yu et al., 2014; Chaves Resende et al., 2016; García García et al., 2017; Frizzas et al., 2017 and Schutte, 2020). Regarding the diversity of natural enemies’ community, little or no effects of Bt cultivars of cotton and soybean compared to their non-Bt counterparts were detected (Whitehouse et al., 2005; Guo et al., 2016; Frizzas et al., 2017; Carbone, 2018; Kaur et al., 2021). Numerous studies point out little to no differences in community structure or species diversity between Bt crops and their non-Bt counterparts (Ögür and Tuncer, 2012).
Our results agree with previous works reporting a decrease in species richness and arthropod diversity in Bt compared to non-Bt cotton (Sisterson et al., 2004; Liu and Luo, 2019). However, for pest arthropods in the same crop, Men et al. (2003) reported an increase in diversity in Bt cultivars. These authors worked on agricultural field crops areas between 0.4 and 1.64 hectares. The similarity found between treatments was high for all assemblages and subassemblages and for all indicators that considered both only species composition and composition and abundance (tables 5 – 7). This indicates that the assemblages differed by only a few species. Our results agree with those of Carbone (2018), who found that the Bt and non-Bt soybean cultivars shared the same predator species, evidencing similarity between cultivars. The same inference can be made by comparing the rank-abundance curves (figures 1, 2, 3). For the arthropod assemblages as well as for the phytophagous insects or entomophagous arthropods subassemblages, differences were found between the Bt cultivar and its non-Bt counterpart, with the latter presenting a greater diversity and equitability. These differences diminished or were reversed when the larvae of the Bt target species and their parasitoids were removed from the analysis, suggesting that these species are the ones that differentiate one cultivar from the other in the field. No differences in the uniformity and composition of the insect community were found between Bt and conventional corn (Frizzas et al., 2017) and soybean (Schutte, 2020).
Studies on cotton and corn are relevant to this discussion. The cotton crop expresses the same protein as Bt soybean, the Cry1Ac protein. Therefore, it is possible to consider these studies as background information on the potential effects of this toxin on the arthropod community. On the other hand, although Bt toxins in corn are different from those in soybean (MRI, 2017; ArgenBio, 2021), a direct or indirect influence on communities may be reflected in emergent properties of this level of organization, such as richness and diversity, beyond the effects on particular target species.
An important issue is the discussion about the scope of this study. Ecological processes have a scale of operation. A single process is regulated by different mechanisms; and, therefore, it can generate different patterns at different scales (García, 2008). In this work, each of the replicates covered an area equivalent to 0.18 hectare. The four replicates together did not occupy one hectare of cultivation (70%), which suggests the occurrence of scale effects, especially for highly mobile species such as Hemiptera, Orthoptera and natural enemies. However, a process cannot be attributed to a particular scale, but specific space and time scales in which one process prevails over another can be pointed out (Schneider, 1994, 2009). In studies on population dynamics, Bengtsson et al. (2004) suggest that analyses of small-scale movement patterns of animals can help to understand and predict movement on a larger scale. However, the results presented here should not be extrapolated to other environments or to larger scales. Studies at commercial plots or farm scales are necessary in order to verify the results found in this work. At the same time, the characteristics of the environmental matrix at the landscape level can also influence the size of the sources from which the colonization or dispersal of arthropods to crops occurs (Mitchell et al., 2014; González, 2015). Nonetheless, considering the homogeneity of the surroundings (typical crops of the region), we would not expect much influence of the spatial scale.
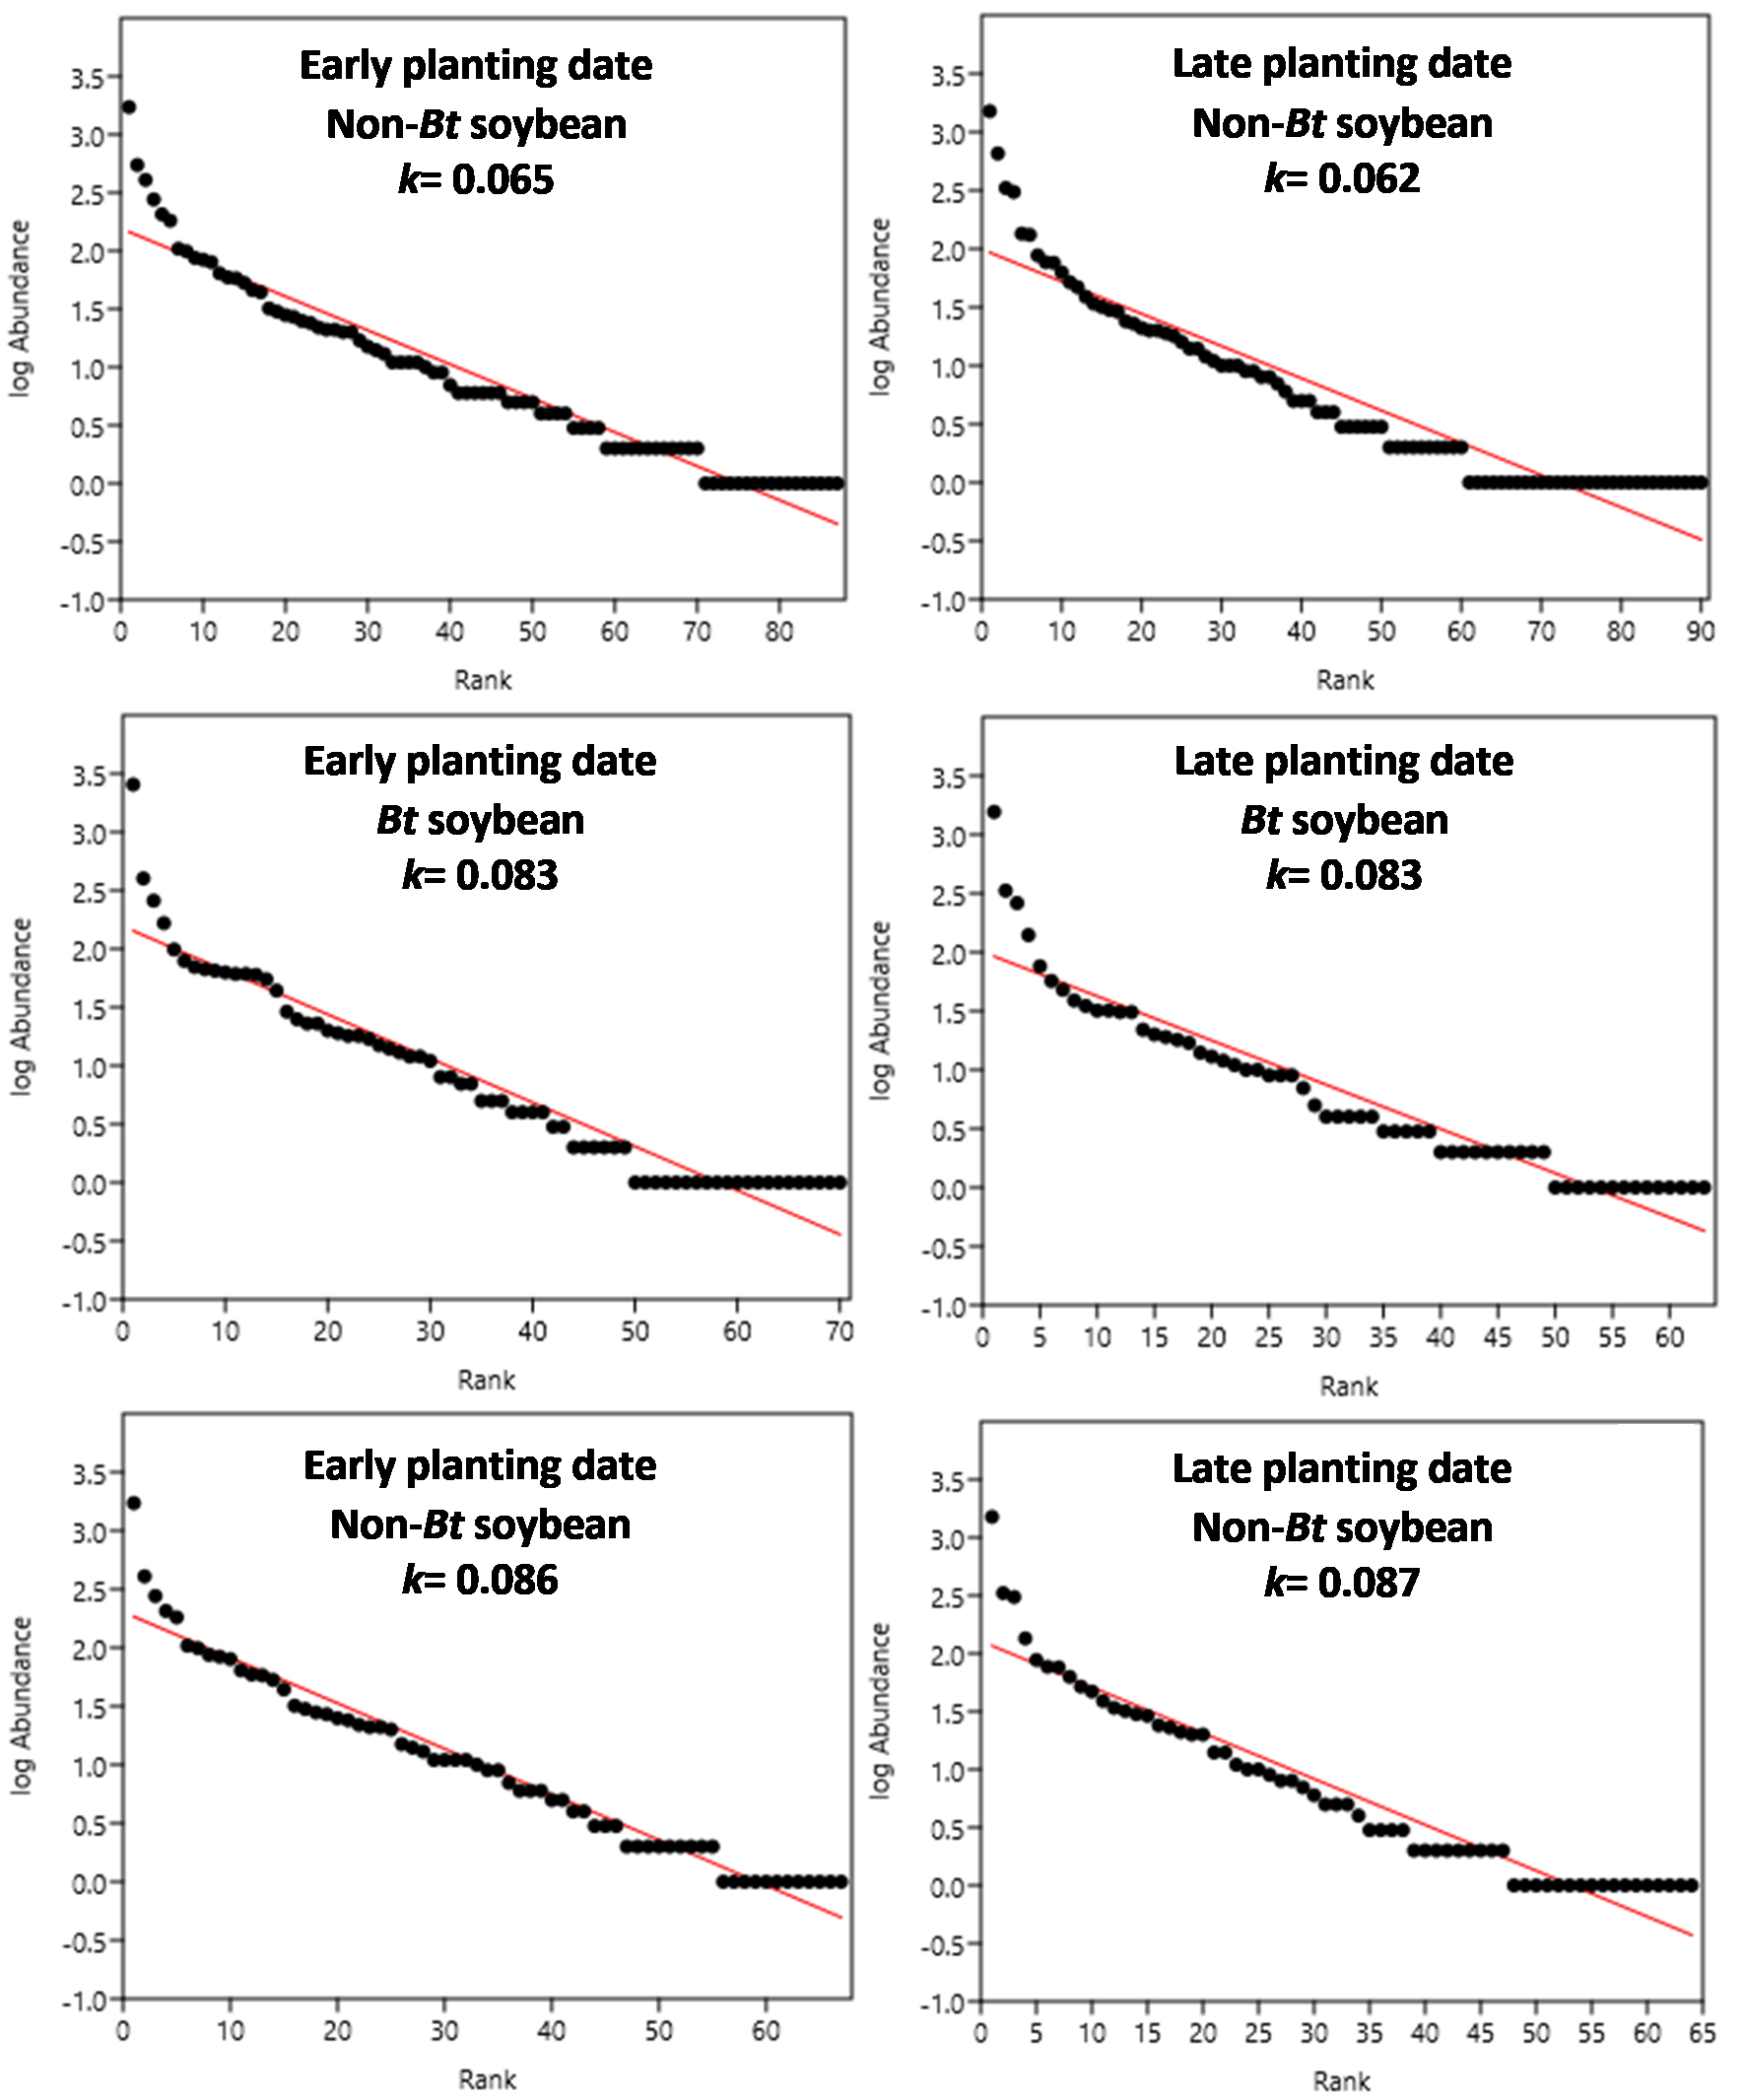
Figure 1
Arthropod assemblage: Rank–Abundance curves and estimates of the parameter k. Panels a and d: non-Bt soybean; Panels b and e: Bt soybean; Panels c and f: Non-Bt soybean without the presence of lepidopteran larvae, target of Cry1Ac toxin and their parasitoids.
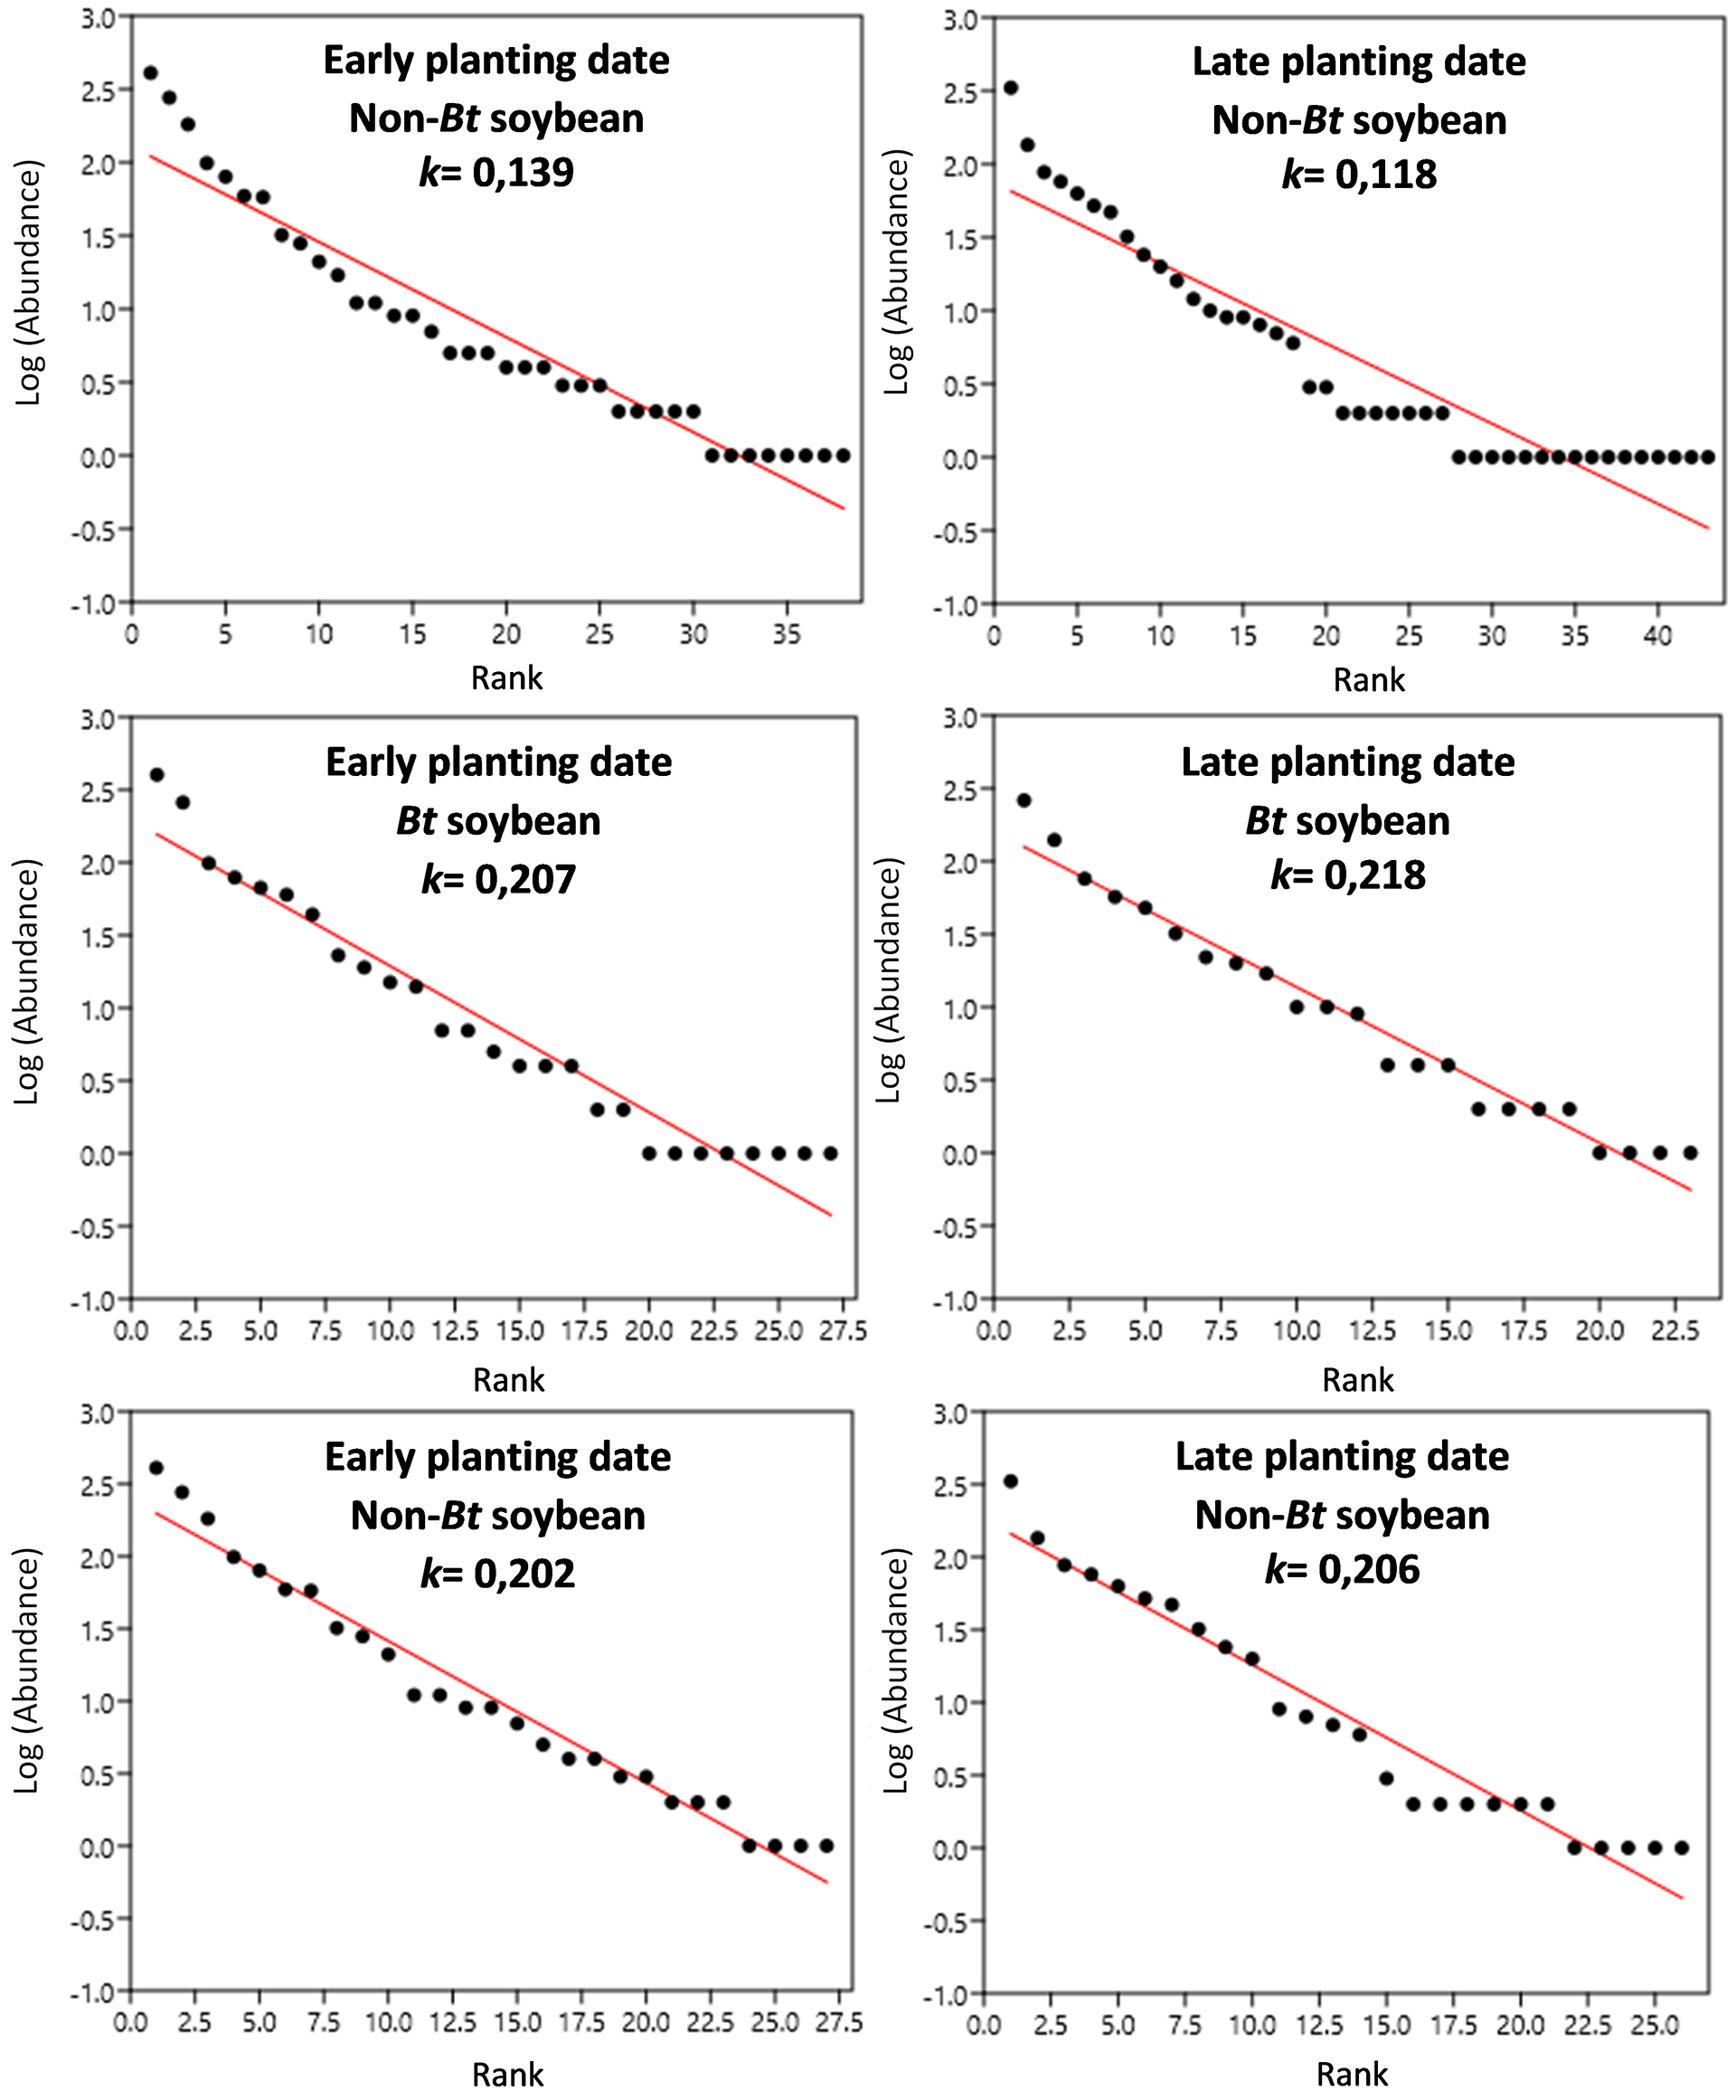
Figure 2
Entomophagous arthropod subassemblage: Rank–Abundance curves and estimates of the parameter k. Panels a and d: Non-Bt soybean; Panels b and e: Bt soybean; Panels c and f: Non-Bt soybean without the presence of parasitoids of lepidopteran larvae, target of Cry1Ac toxin.
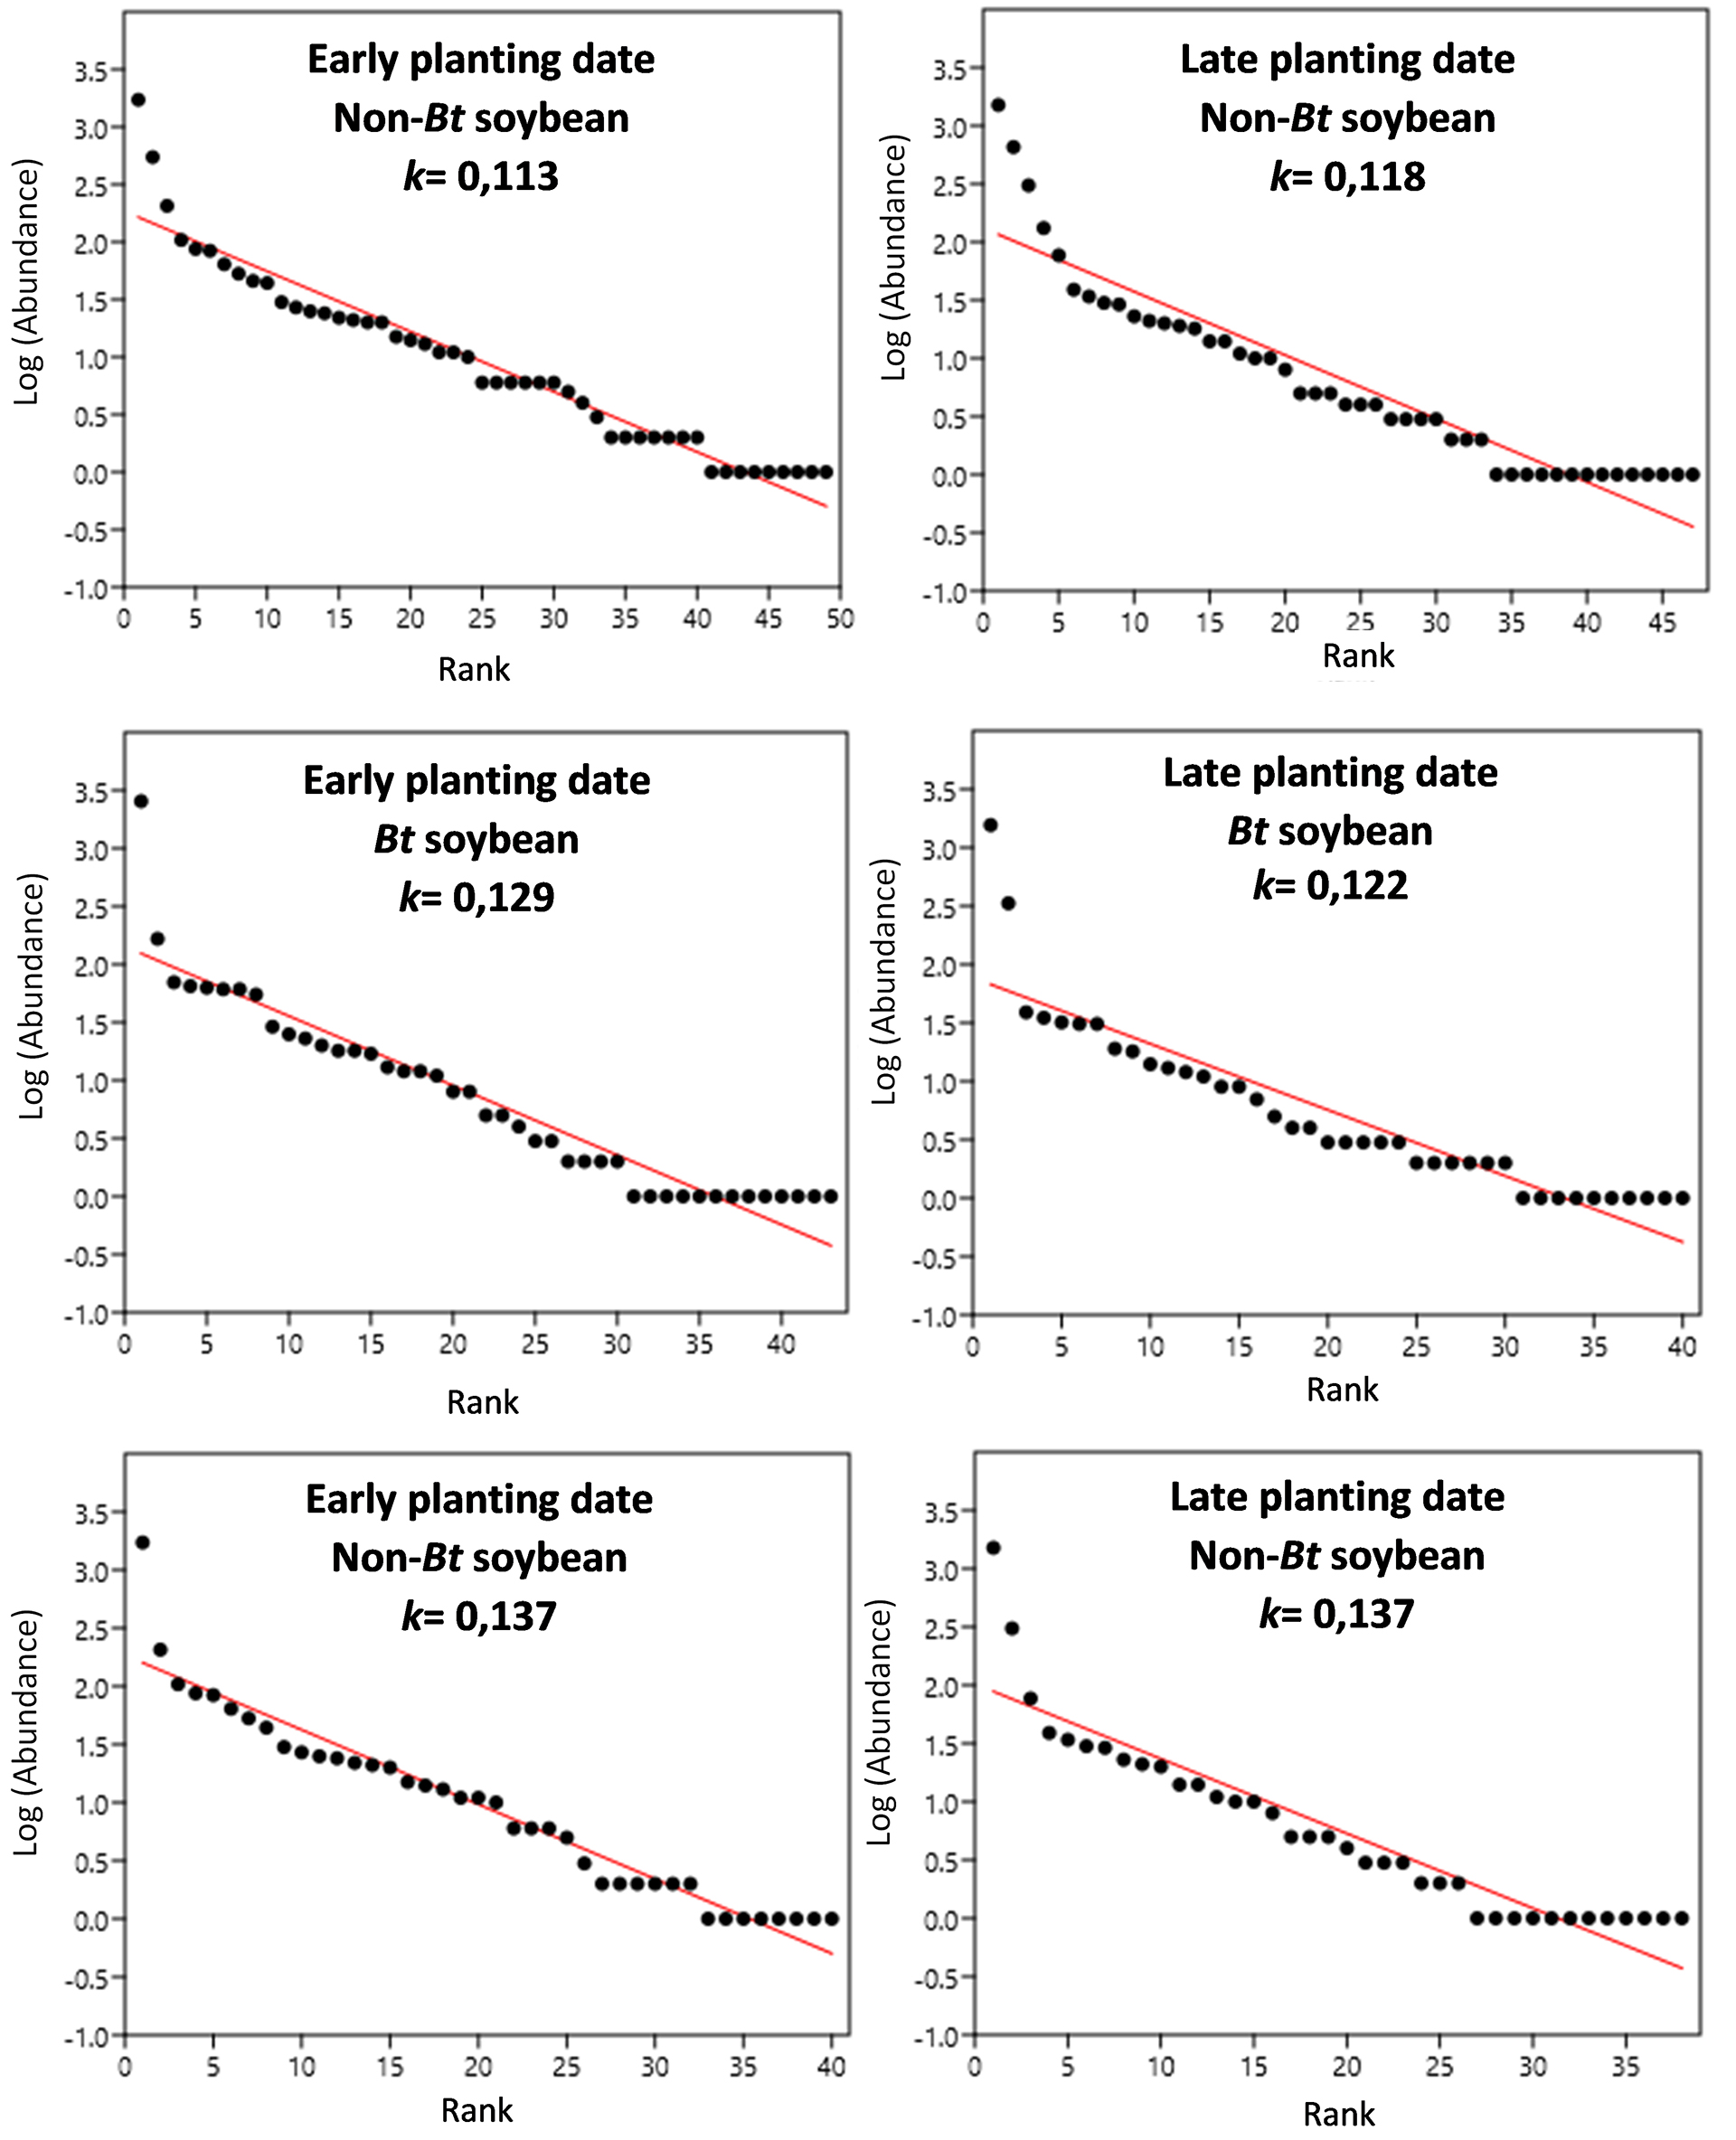
Figure 3
Phytophagous insect subassemblage: Rank–Abundance curves and estimates of the parameter k. Panels a and d: Non-Bt soybean; Panels b and e: Bt soybean; Panels c and f: No-Bt soybean without the presence of lepidopteran larvae, target of Cry1Ac toxin.
CONCLUSIONS
This work provides information on arthropod assemblages of Bt soybean and adds to the background on the possible effects of crops expressing Bt proteins on phytophagous insects and entomophagous arthropod subassemblages, as well as on entire assemblage. Under the study conditions, the data support the conclusion that the effects of the Cry1Ac protein are limited to the suppression of the larvae of the target species and their parasitoids as a consequence of host specificity. The planting dates had no influence on the diversity of the arthropod assemblages present in the soybean crops.
Acknowledgments
ACKNOWLEDGEMENTS
The authors appreciate the collaboration of the support staff of INTA and INTeA S.A. in the planting of field trials. We thank Adriana Marvaldi, Ana M. Marino de Remes Lenicov, Cecilia Margaría, Fabiana Cuezzo, Federico Agrain, Fernanda Cingolani, Fernando Diez, Germán San Blas, Juan José Martínez, Marcela Cornelis, María Gramajo, María del Río, María De Wysiecki, María Cigliano and Susana Paradell for their contributions to the taxonomic identification of the different groups of arthropods.
REFERENCES
ABBAS, M.S.T. 2018. Genetically engineered (modified) crops (Bacillus thuringiensis crops) and the world controversy on their safety. Egyptian Journal of Biological Pest Control, 28, Article 52. https://doi.org/10.1186/s41938-018-0051-2
AMMANN, K. 2009. Biodiversity and Genetically Modified Crops. In: FERRY, N.; GATEHOUSE, A.M,R. (Eds.). Environmental Impact Of Genetically Modified Crops. CABI. 240-264 pp.
ANDERSON, J.A.; ELLSWORTH, P.C.; FARIA, J.C.; HEAD, G.P.; OWEN, M.D.K.; PILCHER, C.D.; SHELTON A.M.; MEISSLE, M. 2019. Genetically Engineered Crops: Importance of Diversified Integrated Pest Management for Agricultural Sustainability. Frontiers in Bioengineering and Biotechnology, 7, Article 24. https://doi.org/10.3389/fbioe.2019.00024
ANDRADE, F. 2017. Los desafíos de la agricultura argentina. Satisfacer las futuras demandas y reducir el impacto ambiental. (1.a Edición). Ediciones INTA.
ARGENBIO (CONSEJO ARGENTINO PARA LA INFORMACIÓN Y EL DESARROLLO DE LA BIOTECNOLOGÍA). 2021. Los cultivos transgénicos en Argentina y en el mundo. Cuaderno N.o 43.
ARPAIA, S. 2010. Genetically Modified Plants and “Non-Target” Organisms: Analyzing the Functioning of the Agro-ecosystem. Collection of Biosafety Reviews, 5, 12-80.
ARPAIA, S. 2021. Environmental risk assessment in agro-ecosystems: Revisiting the concept of receiving environment after the EFSA guidance document. Ecotoxicology and Environmental Safety,208, Article 111676. https://doi.org/10.1016/j.ecoenv.2020.111676
MRI (PROGRAMA MANEJO DE RESISTENCIA DE INSECTOS). 2017. Cultivos Bt y manejo de resistencia de insectos, preguntas y respuestas. (2.a Edición). (Available at: https://programamri.ar/images/descargas/MRI_Q&A.pdf verified on April 15, 2024).
AZEVEDO, G.H.F.; FALEIRO, B.T.; MAGALHÃES, I.L.F.; BENEDETTI, A.R.; OLIVEIRA, U.; PENA-BARBOSA, J.P.P.; SANTOS, M.T.T.; VILELA, P.F.; DE MARIA, M.; SANTOS, A.J. 2013. Effectiveness of sampling methods and further sampling for accessing spider diversity: a case study in a Brazilian Atlantic rainforest fragment.InsectConservation and Diversity,7(4), 381-391. https://doi.org/10.1111/icad.12061
BÀRBERI, P. 2013. Functional Agrobiodiversity: The Key to Sustainability? In: BHULLAR, G.S.; BHULLAR, N.K. (Eds.). Agricultural Sustainability. Progress and Prospects in Crop Research. Elsevier (Academic Press). 3-20 pp.
BARRIONUEVO, M.J. 2011. Redescripción de los estados preimaginales de Rachiplusia nu (Lepidoptera: Noctuidae). Revista de la Sociedad Entomológica Argentina, 70(3-4), 169-184.
BENGTSSON, G.; NILSSON, E.; RYDÉN, T.; WIKTORSSON, M. 2004. Irregular walks and loops combines in small-scale movement of a soil insect: implications for dispersal biology. Journal of Theoretical Biology, 231, 299-306. https://doi.org/10.1016/j.jtbi.2004.06.025
BLANCO, C.A.; CHIARAVALLE, W.; DALLA-RIZZA, M.; FARIAS, J.R.; GARCÍA-DEGANO, M.F.; GASTAMINZA, G.; MOTA-SÁNCHEZ, D.; MURÚA, M.G.; OMOTO, C.; PIERALISI, B.K.; RODRÍGUEZ, J.; RODRÍGUEZ-MACIEL, J.C.; TERÁN-SANTOFIMIO, H.; TERÁN-VARGAS, A.P.; VALENCIA, S.J.; WILLINK, E. 2016. Current situation of pests targeted by Bt crops in Latin America. Current Opinion in Insect Science, 15, 131-138. https://doi.org/10.1016/j.cois.2016.04.012
CARBONE, J.S. 2018. Cultivo de soja Glycine max (L.) Merrill genéticamente modificada con Bacillus thuringiensis Berliner (Bt), su efecto en lepidópteros y depredadores en el noroeste de Buenos Aires. (Tesis para Ingeniero Agrónomo, Escuela de Ciencias Agrarias, Naturales y Ambientales (UNNOBA)).
CARMONA GALINDO, V.D.; CARMONA, T.V. 2013. La Diversidad de los Análisis de Diversidad. Bioma, 14, 20-28.
CARPENTER, J.E. 2011. Impact of GM crops on biodiversity. GM Crops, 2(1), 7-23.
CATARINO, R.; CEDDIA, G.; AREAL, F.J.; PARK, J. 2015. The impact of secondary pests on Bacillus thuringiensis (Bt) crops. Plant Biotechnology Journal, 13(5), 601-612. https://doi.org/10.1111/pbi.12363
CHANTHY, P.; MARTIN, R. J.; GUNNING, R. V.; ANDREW, N. R. 2015. Arthropod survey on soybean crops in Cambodia: A comparison of the sweep netting and beat sheeting collection methods for estimating arthropod diversity and species richness. Australian Journal of Entomology, 52(4), 299-308. https://doi.org/10.1111/aen.12035
CHAO, A.; JOST, L. 2012. Coverage-based rarefaction and extrapolation: standardizing samples by completeness rather than size. Ecology, 93(12), 2533-2547. https://doi.org/10.1890/11-1952.1
CHAO, A.; MA, K.H.; HSIEH, T.C.; CHIU, C.H. 2015. Online Program SpadeR (Species-richness Prediction And Diversity Estimation in R). Program and User’s Guide. (Available at: http://chao.stat.nthu.edu.tw/wordpress/software_download/ verified on November 05, 2021).
CHAO, A.; MAO, K.H.; HSIEH, T.C. 2016. User’s Guide for iNEXT Online: Software for Interpolation and Extrapolation of Species Diversity. Institute of Statistics, National Tsing Hua University. http://dx.doi.org/10.13140/RG.2.2.25777.79200
CHAO, A.; GOTELLI, N.J.; HSIEH, T.C; SANDER, E.L.; MA, K.H.; COLWELL, R.K.; ELLISON, A.M. 2014. Rarefaction and extrapolation with Hill numbers: a framework for sampling and estimation in species diversity studies. Ecological Monographs, 84, 45-67. https://doi.org/10.1890/13-0133.1
CHAVES RESENDE, D.; MARTINS MENDES, S.; MARUCCI, R.C.; DE CARVALHO SILVA, A.; MATOSO CAMPANHA, M.; MAGID WAQUIL, J. 2016. Does Bt maize cultivation affect the non-target insect community in the agro ecosystem? Revista Brasileira de Entomologia, 60, 82-93. https://doi.org/10.1016/j.rbe.2015.12.001
CISNERO, D.; VIRANO, M. 2011. Fluctuación poblacional de larvas y parasitoides himenópteros de oruga medidora Rachiplusia nu (Lepidoptera: Noctuidae) en soja al este de La Pampa. (Trabajo Final de Graduación. Facultad de Agronomía (UNLPam)).
COMPANHIA NACIONAL DE ABASTECIMENTO (Conab). 2022. 2.o Censo de Granos para la Cosecha 2022/23. (Available at: https://www.conab.gov.br/info-agro/safras/graos/boletim-da-safra-de-graos/item/19343-2-levantamento-safra-2022-23 verified on December 05, 2022).
CONNER, A.J.; GLARE, T.R.; NAP, J.P. 2003. The release of genetically modified crops into the environment: Part ii. Overview of ecological risk assessment. The Plant Journal, 33(1), 19-46. https://doi.org/10.1046/j.0960-7412.2002.001607.x
CUIROLO, J.I. 2005. Análisis del sistema de monitoreo de tucuras (Orthoptera: Acrididae) mediante el uso de red de arrastre. (Tesis para Ingeniero Agrónomo, Facultad de Agronomía (UBA)).
DANG, C.; ZHOU, X.; SUN, C.; WANG, F.; PENG, Y.; YE, G. 2021. Impacts of Bt rice on non-target organisms assessed by the hazard quotient (HQ). Ecotoxicology and Environmental Safety, 207, Article 111214. https://doi.org/10.1016/j.ecoenv.2020.111214
DHILLON, M.K.; SHARMA, H.C. 2009. Effects of Bacillus thuringiensis δ-endotoxins Cry1Ab and Cry1Ac on the coccinellid beetle, Cheilomenes sexmaculatus (Coleoptera, Coccinellidae) under direct and indirect exposure conditions. Biocontrol Science and Technology, 19, 407-420. https://doi.org/10.1080/09583150902783801
DHILLON, M.K.; SHARMA, H.C. 2013. Comparative studies on the effects of Bt-transgenic and non-transgenic cotton on arthropod diversity, seed cotton yield and bollworm control. Journal of Environmental Biology, 34, 67-73.
MINISTERIO DE AGRICULTURA, GANADERÍA Y PESCA (MAGyP). 2022. Estimaciones agrícolas. (Available at: https://datosestimaciones.magyp.gob.ar/reportes.php?reporte=Estimaciones verified: December on 05, 2022).
FARIA, C.A.; WACKERS, F.L.; PRITCHARD, J.; BARRETT, D.A.; TURLINGS, T.C.J. 2007. High Susceptibility of Bt-maize to Aphids Enhances the Performance of Parasitoids of Lepidopteran Pests. PLoS ONE, 2(7), Article e600. https://doi.org/10.1371/journal.pone.0000600
FERREIRA, F.C.; PETRERE, M. 2008. Comments about some species abundance patterns: classic, neutral, and niche partitioning models. Brazilian Journal of Biology, 68(4, Suppl.): 1003-1012.
FONTES, E.M.G.; PIRES, C.S.S.; SUJII, E.R.; PANIZZI, A.R. 2002. The Environmental Effects of Genetically Modified Crops Resistant to Insects. Neotropical Entomology, 31(4), 497-513. https://doi.org/10.1590/S1519-566X2002000400001
FRIZZAS, M.R.; DE OLIVEIRA, C.M.; OMOTO, C. 2017. Diversity of insects under the effect of Bt maize and insecticides. Arquivos do Instituto Biologico, 84, 1-8. https://doi.org/10.1590/1808-1657000062015
GAMUNDI, J.C. 1995. Evaluación de técnicas de muestreo de insectos plaga y depredadores en cultivos de soja con diferentes sistemas de siembra y labranza. Tomo 11, iv Trabajo presentado en Primer Congreso Nacional de Soja, Segunda Reunión Nacional de Oleaginosos. AIANBA, Pergamino (Bs. As.). 43-50.
GARCÍA GARCÍA, L.; OYOLA VIDES, Y.; FERNÁNDEZ HERRERA, C.; PÉREZ GARCÍA, K.; CORREA ALVAREZ, E. 2017. Diversidad de artrópodos asociados al algodón Bt y convencional (Gossypium hirsutum L.) en Colombia. Revista Mexicana de Ciencias Agrícolas, 8(4), 905-918. https://doi.org/10.29312/remexca.v8i4.16
GARCÍA, D. 2008. El concepto de escala y su importancia en el análisis espacial. In MAESTRE GIL, F.; ESCUDERO ALCÁNTARA, A.; BONET JORNET, A. (Eds.). Introducción al análisis espacial de datos en ecología y ciencias ambientales: Métodos y Aplicaciones. Editorial Dykinson S.L. 35-73 pp.
GARCIA, M.A.; ALTIERI, M.A. 2005. Transgenic Crops: Implications for Biodiversity and Sustainable Agriculture. Bulletin of Science, Technology & Society, 25(4), 335-353. https://doi.org/10.1177/0270467605277293
GONZÁLEZ, E.; SALVO, A.; VALLADARES, G. 2015. Sharing enemies: evidence of forest contribution to natural enemy communities in crops, at different spatial scales. Insect Conservation and Diversity, 8(4), 359-366. https://doi.org/10.1111/icad.12117
GUO, J.; HE, K.; HELLMICH, R.L.; BAI, S.; ZHANG, T.; LIU, Y.; AHMED, T.; WANG, Z. 2016. Field trials to evaluate the effects of transgenic cry1Ie maize on the community characteristics of arthropod natural enemies. Scientific Reports, 6, Article 22102. https://doi.org/10.1038/srep22102
HAAN, N.L.; IULIANO, B.G.; GRATTON, C.; LANDIS, D.A. 2021. Designing agricultural landscapes for arthropod-based ecosystem services in North America. Advances in Ecological Research, 64, 191-250. https://doi.org/10.1016/bs.aecr.2021.01.003
HAMMER, Ø.; HARPER, D.A.T.; RYAN, P.D. 2001. PAST: Paleontological Statistics Software Package for Education and Data Analysis. Palaeontologia Electronica, 4(1), Article 4.
HE, F.; TANG, D. 2008. Estimación del parámetro de prefe- rencia de nicho de la serie geométrica. Acta Oecologica, 33(1), 105-107.
HERNÁNDEZ-ARANDA, V.; JARQUIN-GÁLVEZ, R.; LARA-ÁVILA, P.; AGUILAR-BENÍTEZ, G. 2022. Bioprospecting of beneficial insects in agroecological and organic production systems in San Luis Potosí. Revista mexicana de ciencias agrícolas, 13(3), 511-525. https://doi.org/10.29312/remexca.v13i3.2896
HORIKOSHI, R.J.; BERNARDI, O.; GODOY, D.N.; SEMEÃO, A.A.; WILLSE, A.; CORAZZA, G.O.; RUTHES, E.; FERNANDES, D.S.; SOSA-GÓMEZ, D.R.; BUENO, A.F.; OMOTO, C.; BERGER, G.U.; CORRÊA, A.S.; MARTINELLI, S.; DOURADO, P.M.; HEAD, G. 2021. Resistance status of lepidopteran soybean pests following large-scale use of MON87701 × MON89788 soybean in Brazil. Scientific Reports, 11, Article 21323. https://doi.org/10.1038/s41598-021-00770-0
HOY, C.W.; FELDMAN, J.; GOULD, F.; KENNEDY, G.G.; REED, G.; WYMAN, J.A. 1998. Naturally occurring biological controls in genetically engineered crops. In: BARBOSA, P. (Ed.). Conservation biological control. Academic Press. 185-205 pp.
HSIEH, T.C.; MA, K.H.; CHAO, A. 2016. iNEXT: an R package for rarefaction and extrapolation of species diversity (Hill numbers). Methods in Ecology and Evolution, 7, 1451-1456. https://doi.org/10.1111/2041-210x.12613
HSIEH, T.C.; MA, K.H.; CHAO, A. 2020. iNEXT: INTerpolation and EXTrapolation for species diversity. R package version 2.0.20. (Available at: http://chao.stat.nthu.edu.tw/wordpress/software-download/ verified: May on 05, 2024).
JANKIELSOHN, A. 2018. The Importance of Insects in Agricultural Ecosystems. Advances in Entomology, 6, 62-73. https://doi.org/10.4236/ae.2018.62006
JOST, L. 2006. Entropy and diversity. Oikos, 113(2), 363-375. https://doi.org/10.1111/j.2006.0030-1299.14714.x
KAUR, J.; AGGARWAL, N.; KULAR, J.S. 2021. Abundance and diversity of arthropods in transgenic Bt and non-Bt cotton fields under Indian conditions. Phytoparasitica, 49, 61-72. https://doi.org/10.1007/s12600-020-00874-9
LIU, Q.; ROMEIS, J.; YU, H.; ZHANG, Y.; LI, Y.; PENG, Y. 2015. Bt rice does not disrupt the host-searching behavior of the parasitoid Cotesia chilonis. Scientific Reports,5, Article 15295. https://doi.org/10.1038/srep15295
LIU, Y.; LUO, Z. 2019. Neighbouring crop diversity mediates the effect of Bt cotton on insect community and leaf damage in fields. Transgenic Research, 28, 357-367. https://doi.org/10.1007/s11248-019-00155-0
LOVERA, S.; ROGGIA, F.N. 2021. Estudio de la abundancia y el grado de parasitoidismo de “isoca medidora” (Rachiplusia nu) y “gata peluda norteamericana” (Spilosoma virginica), sobre el cultivo de girasol. (Trabajo final de graduación. Facultad de Agronomía (UNLPam)).
LUNDGREN, J.G.; GASSMANN, A.J.; BERNAL, J.; DUAN, J.J.; RUBERSON, J. 2009. Ecological compatibility of GM crops and biological control. Crop Protection, 28, 1017-1030. https://doi.org/10.1016/j.cropro.2009.06.001
MACE, G.M.; NORRIS, K.; FITTER, A.H. 2012. Biodiversity and ecosystem services: a multilayered relationship. Trends in Ecology and Evolution, 27(1), 19-26. https://doi.org/10.1016/j.tree.2011.08.006
MANJUNATH, T.M. 2020. Role of transgenic Bt-crops in promoting biological control and integrated pest management. Journal of Biological Control, 34(1), 1-7. DOI: 10.18311/jbc/2020/23252
MAZUR, M.I.; CÁRCAMO, M.I. 2014. América Latina: La transgénesis de un continente. Visión crítica de una expansión descontrolada (Versión Actualizada) (2.a edición). Ediciones Boll.
MEIRA, S.; RODRÍGUEZ BAIDE, J.M.; CONFALONE, A.; FATECHA FOIS, D.A.; FERNANDES, J.M.; PÉREZ GONZÁLEZ, O.; VAN DEN BERG, M. 2019. Modelaje del cultivo de soja en Latinoamérica, Estado del arte y base de datos para parametrización, EUR 29057 ES. Publications Office of the European Union, Luxembourg. http://dx.doi.org/10.2760/408823, JRC110355
MEN, X.; GE, F.; LIU, X.; YARDIM, E.N. 2003. Diversity of Arthropod Communities in Transgenic Bt Cotton and Non Transgenic Cotton Agroecosystems. Environmental Entomology, 32(2), 270-275. https://doi.org/10.1603/0046-225X-32.2.270
MITCHELL, M.G.E.; BENNETT, E.M.; GONZALEZ, A. 2014. Agricultural landscape structure affects arthropod diversity and arthropod-derived ecosystem services. Agriculture, Ecosystems & Environment, 192, 144-151. http://dx.doi.org/10.1016/j.agee.2014.04.015
NARANJO, S.E.; RUBERSON, J.R.; SHARMA, H.C.; WILSON, L.; WU, K. 2008. The Present and Future Role of Insect-Resistant Genetically Modified Cotton in IPM. In: ROMEIS, J.; SHELTON, A.M.; KENNEDY, G.G. (Eds.). Integration of Insect-Resistant Genetically Modified Crops with IPM Systems. Springer. 159-194 pp.
NARANJO, S.E.; HELLMICH, R.L.; ROMEIS, J.; SHELTON, A.M.; VÉLEZ, A.M. 2019. The role and use of genetically engineered insect-resistant crops in integrated pest management systems. In: KOGAN, M.; HEINRICHS, E.A. (Eds.). Integrated management of insect pests: Current and future developments. Burleigh Dodds Science Publishing. 283-340 pp.
NASCIMENTO, P.T.; FADINI, M.A.M.; ROCHA, M.S.; SOUZA, C.S.F.; BARROS, B.A.; MELO, J.O.F.; VON PINHO, R.G.; VALICENTE, F.H. 2021. Response of Trichogramma pretiosum females (Hymenoptera: Trichogrammatidae) to herbivore‑induced Bt maize volatiles. Arthropod-Plant Interactions, 15, 107-125. https://doi.org/10.1007/s11829-020-09801-5
ÖGÜR, E.; TUNCER, C. 2012. Genetiği Değiştirilmiş Bitkilerin Böceklere Etkileri. Journal of the Institute of Science and Technology, 2(4), 29-36.
PEDIGO, L.P.; BUNTIN, G.D. (Eds.). 1994. Handbook of Sampling Methods for Arthropods in Agriculture. (1st ed.). CRC Press. https://doi.org/10.1201/9781003067900
R CORE TEAM. 2021. R: A language and environment for statistical computing. R Foundation for Statistical Computing, Vienna, Austria. (Available at: https://www.R-project.org/ verified December on 05, 2022).
RED DE MONITOREO DE PLAGAS DE AAPRESID (REM). 2021. Nivel de adopción y manejo de soja Bt. In: ROGGERO, D. (Ed.). Red de Innovadores. Revista Técnica Soja 2021. Aapresid. 67-71 pp.
ROMEIS, J.; MEISSLE, M.; RAYBOULD, A.; HELLMICH, R.L. 2009. Impact of Insect-resistant Transgenic Crops on Above-ground Non-Target Arthropods. In:FERRY, F.; GATEHOUSE, A.M.R. (Eds.), Environmental Impact Of Genetically Modified Crops. CABI. 165-198 pp.
ROMEIS, J.; NARANJO, S.E.; MEISSLE, M.; SHELTON, A.M. 2019. Genetically engineered crops help support conservation biological control. Biological Control, 130, 136-154. https://doi.org/10.1016/j.biocontrol.2018.10.001
ROSE, R.; DIVELY, G.P. 2007. Effects of insecticide-treated and lepidopteran-active Bt transgenic sweet corn on the abundance and diversity of arthropods. Environmental Entomology, 36(5), 1254-1268. https://doi.org/10.1603/0046-225x(2007)36[1254:eoialb]2.0.co;2
ROSWELL, M.; DUSHOFF, J.; WINFREE, R. 2021. A conceptual guide to measuring species diversity. Oikos, 130, 321-338. https://doi.org/10.1111/oik.07202
SAINI, E.D. 1984. Identificación de los huevos de pentatómidos (Heteroptera) encontrados en cultivos de soja. IDIA, 425-428, 79-84.
SAINI, E.D. 1987. Clave para la identificación de las ninfas de pentatómidos encontrados en cultivos de soja. Revista de la Sociedad Entomológica Argentina, 46(1-4), 129-139.
SAINI, E.D. 1988. Identificación práctica de pentatómidos perjudiciales y benéficos II. Inst. Patol. Veg., INTA Castelar.
SANCHEZ, M.L.; LINARES, J.C.; FERNÁNDEZ HERRERA, C.; PÉREZ GARCÍA, K.D. 2018. Análisis de la entomofauna benéfica en cultivos de maíz transgénico y convencional, Córdoba - Colombia. Temas Agrarios, 23(2), 121-130. https://doi.org/10.21897/rta.v23i2.1296
SCHNEIDER, D.C. 1994. Quantitative ecology: spatial and temporal scaling. Academic Press.
SCHNEIDER, D.C. 2009. Scale in Ecology. In: SCHEIDER, D.C. Quantitative Ecology: Measurement, Models, and Scaling. Elsevier (Academic Press), 17-41 pp.
SCHULER, T.H.; POTTING, R.P.J.; DENHOLM, I.; POPPY, G.M. 1999. Parasitoid behaviour and Bt plants. Nature, 400, 825-826. https://doi.org/10.1038/23605
SCHUTTE, N.C. 2020. Comparative diversity of arthropods on conventional and genetically modified Bt soybean plants in field trials in South Africa. Dissertation accepted in fulfilment of the requirements for the degree Master of Science in Environmental Sciences with Integrated Pest Management at the North-West University, Potchefstroom, South Africa.
SIERRA FETTER, C.; PERALTA, R. 2010. Moscas (Diptera: Tachinidae) parasitoides de oruga medidora (Lepidoptera: Noctuidae) defoliadora del cultivo de soja en el este de la provincia de La Pampa. (Trabajo Final de Graduación. Facultad de Agronomía (UNLPam)).
SISTERSON, M.S.; BIGGS, R.W.; OLSON, C.; CARRIÉRE, Y.; DENNEHY, T.J.; TABASHNIK, B.E. 2004. Arthropod Abundance and Diversity in Bt and Non-Bt Cotton Fields. Environmental Entomology, 33(4), 921-929. https://doi.org/10.1603/0046-225X-33.4.921
SOSA, M.A.; ALMADA, M.S. 2014. Diversity of arthropods communities in transgenic cotton varieties in Santa Fe province, Argentina. Revista de la Facultad de Agronomía, 113(2), 147-156.
TRIPLEHORN, C.A.; JOHNSON, N.F. 2005. Borror and DeLong’s Introduction to the Study of Insects (7th Edition). Brooks/Cole.
VES LOSADA, J.C.; BAUDINO, E.M. 1998. Influencia de sistemas de labranza sobre la población de tucuras (Orthoptera: Acrididae). Boletín de Divulgación Técnica. INTA, EEA Anguil, 59, 1-7.
VYAVHARE, S.S.; WAY, M.O.; KNUTSON, A.; BILES, S.; PEARSON, R.A. 2015. Managing Soybean Insects in Texas. Report number: ENTO-045 9/15. Texas A&M AgriLife Extension Service.
WHITEHOUSE, M.E.A.; WILSON, L.J.; FITT, G.P. 2005. A Comparison of Arthropod Communities in Transgenic Bt and Conventional Cotton in Australia. Environmental Entomology, 34(5), 1224-1241. https://doi.org/10.1093/ee/34.5.1224
YU, H.; LI, Y.; LI, X.; WU, K. 2014. Arthropod Abundance and Diversity in Transgenic Bt Soybean. Environmental Entomology, 43(4), 1124-1134. http://www.bioone.org/doi/full/10.1603/EN13337
ZEILINGER, A.R.; OLSON, D.M.; ANDOW, D.A. 2016. Competitive release and outbreaks of non-target pests associated with transgenic Bt cotton. Ecological Applications, 26(4), 1047-1054. https://doi.org/10.1890/15-1314