Artículos

Esta obra está bajo una Licencia Creative Commons Atribución-NoComercial 4.0 Internacional.
Abstract: One of the main causes of yield and quality loss in barley (Hordeum vulgare L.) crops are fungal diseases. Understanding the severity of these diseases is essential to achieve proper phytosanitary management. Monitoring is the practice used to assess the health status of crops. This is necessary for diagnosing and quantifying the level of attack, as well as for calculating the impact caused by diseases. This procedure is usually carried out through visual estimates and is therefore often subjective and imprecise. Remote sensing techniques emerge as a potentially useful alternative for detecting disease hotspots and differentiating areas with varying severity. The objectives were the following: to obtain the spectral signatures of healthy and diseased crops, to evaluate the feasibility of differentiating them using spectral indices, to identify the most sensitive bands for differentiation, and to compare the visual estimation of severity with that obtained through image classification. For this purpose, samples of healthy leaves and leaves showing symptoms of each of the foliar diseases caused by Drechslera teres, Rhynchosporium commune, and Bipolaris sorokiniana were used. Seventeen indices and the MDI were calculated from the spectral signatures obtained in the laboratory. The NDVI, CARI, NRI, OSAVI, RGR, and MDI indices showed significant differences between healthy and diseased leaves, but not between different diseases; only GNDVI was able to differentiate between them. The most sensitive bands identified by MDI were 440-490 nm and 645-680 nm. Regarding severity, the results showed a wide dispersion in visual estimates and the potential for using RGB image classification to quantify the intensity of disease symptoms. These results justify future field investigations to develop tools that contribute to improved phytosanitary management.
Keywords: remote sensing, crops, phytopathology.
Resumen: Una de las principales causas de pérdida de rendimiento y calidad en el cultivo de cebada (Hordeum vulgare L.) son las enfermedades fúngicas. Conocer la gravedad de las enfermedades es fundamental para un manejo fitosanitario racional. El monitoreo es la práctica utilizada para evaluar el estado sanitario de los cultivos. Esto es necesario para el diagnóstico y la cuantificación del nivel de ataque, así como para calcular el impacto causado por enfermedades. Este procedimiento suele llevarse a cabo mediante estimaciones visuales y, por lo tanto, suele ser subjetivo e impreciso. Las técnicas de teledetección surgen como una alternativa potencialmente útil para detectar focos de enfermedades y diferenciar áreas con distinta severidad. Los objetivos de este trabajo fueron los siguientes: obtener las firmas espectrales del cultivo sano y con enfermedades foliares, evaluar la factibilidad de diferenciarlas utilizando índices espectrales, obtener las bandas de mayor sensibilidad para diferenciarlas y comparar la estimación visual de la severidad con la obtenida mediante clasificación de imágenes. Para esto se utilizaron muestras de hojas sanas y con síntomas de cada una de las enfermedades foliares causadas por Drechslera teres, Rhynchosporium commune y Bipolaris sorokiniana. A partir de las firmas espectrales obtenidas en laboratorio, se calcularon 17 índices y el MDI. Los índices NDVI, CARI, NRI, OSAVI, RGR y MDI mostraron diferencias significativas entre hojas sanas y enfermas, pero no entre enfermedades, sólo mediante el GNDVI fue posible diferenciarlas. Las bandas de mayor sensibilidad identificadas por el MDI fueron 440-490 nm y 645-680 nm. En relación con la severidad, los resultados obtenidos presentan una gran dispersión en las estimaciones visuales y muestran la potencialidad de utilizar la clasificación de imágenes RGB para cuantificar la intensidad de los síntomas de las enfermedades. Estos resultados justifican futuras investigaciones a campo con el propósito de generar herramientas que contribuyan a mejorar los análisis fitosanitarios.
Palabras clave: teledetección, cultivos, fitopatología.
INTRODUCTION
Barley (Hordeum vulgare L.) is a widely spread crop, being the fourth most important cereal worldwide after rice, corn and wheat. Argentina is a leading producer and exporter, with barley being the second most significant winter cereal after wheat (FAO, 2022; INASE 2022; Miralles et al., 2011).
Diseases are one of the main causes of loss of yield and quality of production in all agricultural crops. Consequently, timely detection of symptoms is the key to select suitable control techniques and limit their propagation (Martinelli et al., 2015). Among the biotic factors that cause crop diseases, fungi are the most relevant barley pathogen (Kiehr et al., 2016). The main fungal diseases affecting barley in Argentina, which have markedly increased their importance in the last years, are net blotch (Drechslera teres [Sacc.] Shoemaker), leaf scald (Rhynchosporium commune Zaffarano, McDonald & Linde), and spot blotch (Bipolaris sorokiniana [Sacc.] Shoem.). It should be noted that, currently, in the Argentine market, there is a limited number of barley varieties and they are all susceptible to at least one of the main fungal diseases (Erreguerena et al., 2017).
Crops must be protected during their cycle in order to avoid significant losses in yield and production quality. No single practice has proven to be totally effective for disease control in extensive crops; therefore, integrated disease management (IDM) is the most appropriate approach to achieve damage reduction with the least possible environmental impact. The IDM is based on the combination of cultural, biological and chemical practices applied to disease control (Pereyra and German, 2012). The current approach of crop management assumes that diseases are distributed homogeneously in the field; however, this is not true. Heterogeneity appears due to site characteristics, such as the influence of neighboring crops, predecessor crops, inoculum sources, among others. Thus, diseases express themselves in a heterogeneous pattern, presenting foci, gradients or random distributions. This heterogeneity presents the possibility of reducing the use of phytosanitary products by carrying out a site-specific management of diseases, which allows the reduction of costs and environmental impacts, while reducing the risk of developing resistant biotypes (Martinelli et al., 2015).
Visual estimation of incidence and severity is the current most widely used technique for crop monitoring. With the aim to assist the evaluation of diseases through visual estimation, diagrammatic scales were developed. However, when surveying numerous samples, the lack of concentration of the evaluators due to fatigue leads to a loss of accuracy. In addition, there are variations both between evaluators (subjectivity) and within the same evaluator (repetitiveness), along with the need of evaluators for frequent training to maintain precision. Furthermore, the use of “coarse scales” (values such as 1, 5, 10, 25% are generally chosen), or their variations depending on the organ under study, also affect the results of the estimates. These inaccuracies in the estimates have harmful consequences for the environment (due to the unnecessary applications of phytosanitary products) and/or affect the producer’s profitability (due to large losses) (Bock et al., 2010, 2020; 2022).
A possible alternative to visual monitoring is the use of remote sensing techniques, which have proven to be useful tools to detect symptoms in the initial stages of disease development (Calderón et al., 2018). Sensors gather information on the properties of plants in different regions of the electromagnetic spectrum, including information beyond the visible range, allowing the detection of early changes in plant physiology due to stress (Bauriegel et al., 2011; Bravo et al., 2003; Kuska et al., 2015; Wahabzada et al., 2015). Some of the most promising techniques are those which use sensors that measure reflectance and create spectral indices, which had great development over the last 60 years, with promising results (Ashourloo et al., 2014; Mahlein et al., 2013, 2012; Huang et al., 2007). Indeed, remote sensing techniques are potentially useful for identifying disease foci and areas that differ in severity when used in combination with advanced data analysis methods; in addition, they can be used for specific pest management programs in sustainable crop production (Franke and Menz, 2007; Mahlein, 2016).
In this work, the feasibility of identifying the health status of barley leaves by processing their spectral signatures was evaluated. To do this, different vegetation indices were calculated and the outcomes were statistically compared. These results led us to work with RGB images of barley leaves (digital photographs), which were processed with classification techniques to digitally determine the severity levels. These values were then compared with the visual estimates of six agronomists. Due to the high spatial resolution of the RGB images, the results obtained have greater precision and accuracy than the visual estimates.
MATERIALS AND METHODS
Experimental site
The field trial was carried out at the experimental farm located in the Faculty of Agronomy of the National University of the Center of the Buenos Aires Province (FA-UNCPBA) (36°49′41.4′ S; 59°53′11.6′′ W).
Plots of the barley variety Andreia were sown with an experimental seeder (PowellTM Engineering) in 7 rows at 0.21 m, with a plot length of 10 m, performing 3 repetitions. Plants were grown in the absence of nutritional stress, applying insecticides and herbicides to control insects and weeds when necessary. The trial was conducted in 2019 under rainfed conditions, with no supplemental irrigation. A strip design was carried out with two fungicide applications for the healthy control treatments and without fungicide applications on the remaining ones to allow the development of diseases.
Sample collection
Three leaf samples were collected from asymptomatic barley plants and from plants exhibiting symptoms of each of the main foliar diseases affecting the crop: net blotch, leaf scald, and spot blotch. Each sample consisted of 8 leaves. To confirm the diagnosis, the symptomatic leaf samples were analyzed and cultured following the methodology proposed by Gilchrist et al. (2005) for each case. The characteristics of the mycelium, conidia, and conidiophores were examined using a stereoscopic magnifier and an Olympus BX-40 optical microscope. Subsequently, the fungi were identified using taxonomic keys.
Spectral signatures
The spectral signatures were obtained under controlled conditions at the Phytopathology Laboratory (FA-UNCPBA). For this purpose, a device with three 50 W halogen lamps was mounted because they have adequate light intensity in the spectrum region of interest. An Ocean Optics USB 650 spectrometer (25° FOV) was used in the range 440-860 nm with a bandwidth of 1 nm. The integration time was adjusted to cover the entire dynamic range of the spectrometer (12 bits). An average of three detections was set. A board (50 cm side) with three layers of Teflon tape was used as a reference (Janecek, 2012). The leaves were placed on a non-reflective black paper background to capture the spectrum. Three repetitions were performed for each type of symptom. The spectral signatures were smoothed by creating 5 nm bands, i.e., 440-444 nm, 445-449 nm and so on.
Calculation and analysis of spectral indices
Specific indices
From the spectral signatures, 17 spectral indices were calculated (table 1). Indices with at least one successful track record in detecting pests and diseases were selected. Furthermore, it was sought that these indices could be constructed with the bands of the MultiSpectral Instrument (MSI) sensor on board the Sentinel-2 satellite. This sensor has the potential to be used for crop monitoring because it has a high spatial resolution (up to 10 m in some bands), a short revisit time (five days in tandem) and free dissemination of its data.
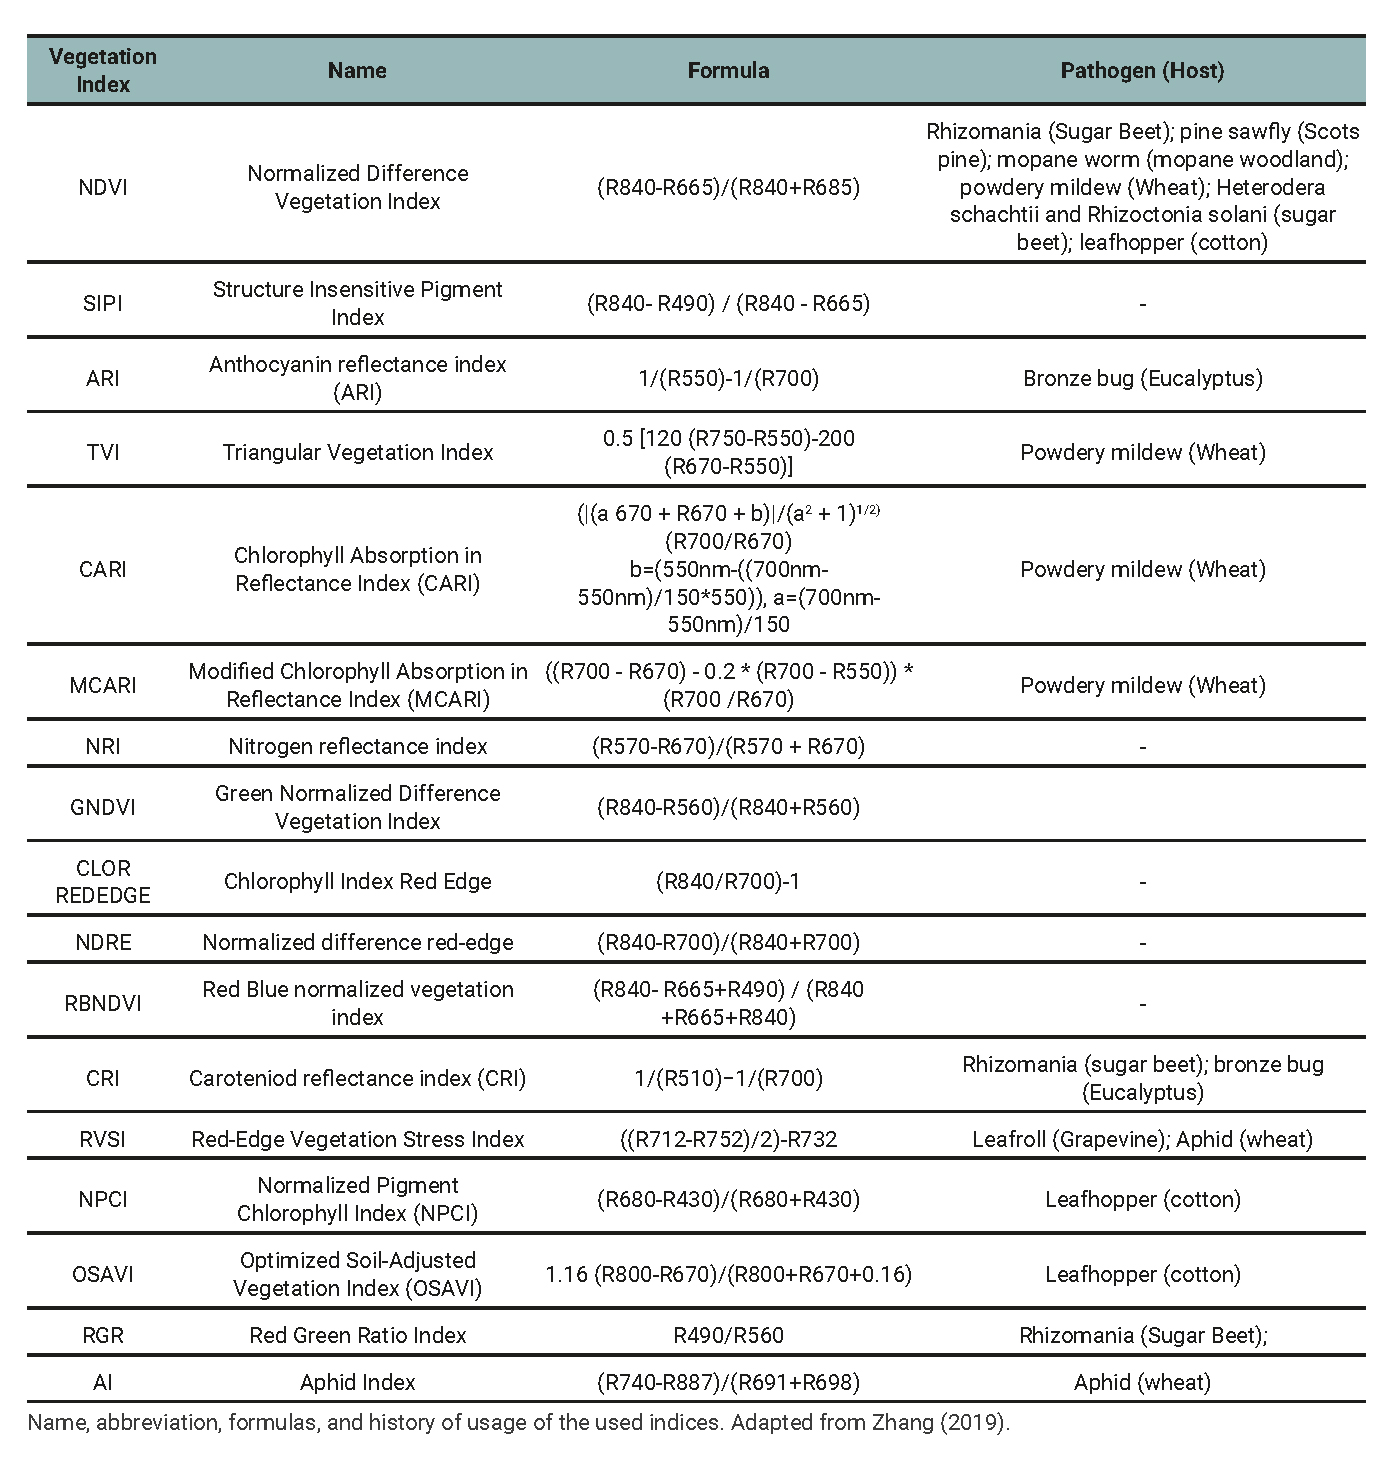
Table 1
Vegetation Index used for detecting or monitoring plant disease and pest.
A general purpose index
On the other hand, in order to select the most sensitive bands for the detection of diseases, the Maximum Discrimination Index (MDI), developed by Lencina and Weber (2020), was calculated. The MDI is a contrast index (like other widely used indices, e.g. NDVI) and it has the particular feature of not having pre-established wavelengths or bands; they are, however, determined from the values of the spectral signatures of the treatments to be discriminated. This index is represented by Equation (1)
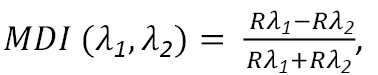
Equation (1)
being Rλ1 and Rλ2 the reflectance values in the bands of maximum discrimination. To determine these bands, the geometric mean of the squared differences of the MDI between treatments for all samples is maximized. In mathematical terms, this is expressed as follows

Equation (2)
where c1 and c2 are the treatments to be discriminated, k is the combinations of cases to be discriminated, m and n the number of repetitions for treatments c1 and c2 respectively, and , stand for the wavelengths or bands to be determined (Lencina and Weber, 2020).
This operator is based on carrying out an exhaustive comparison for all possible pairs of bands for each of the treatments, allowing the selection of the wavelengths where the differences are maximum. To execute this calculation, a script in the Python programming language was used (Lencina, 2021).
To detect differences between the treatments (healthy barley and barley with symptoms of each of the diseases) and, hence, to select those potentially useful indices in discriminating the health status of the crop, an analysis of variance and the Tukey test were applied (α = 0.05) for the comparison of means, using the Infostat statistical software (Di Rienzo et al., 2020).
RGB images
Using the same mounted device for the spectral signatures, photographs of the samples were taken with a mobile device (8 Mp). To reduce the brightness and irregularities of the background, preprocessing was carried out using GIMP (Kimball and Mattis, 2021). Then, through ENVI 4.7 software (Exelis visual information solutions, Boulder, Colorado), a supervised classification was performed with the maximum likelihood method. Three classes were considered: healthy, sick and background. Training areas were visually delimited, including necrotic and chlorotic areas. To evaluate the spectral separability of the training areas, the Jeffries-Matusita index was calculated, which estimates separability in three-dimensional space (Lillesand et al., 2015). Statistical values for each generated class were obtained from the classified images and the percentage of severity was calculated based on the pixel count. On the other hand, the RGB images were sent to six agronomists (previously trained in the use of symptoms scales), who estimated the severity using the visual method. The values obtained by both methods were then compared by calculating parameters such as range and average.
RESULTS
Spectral signatures
Figure 1 shows the average spectral signatures for each disease and the healthy control group. Note that all the signatures present characteristic vegetation patterns: absorption peaks at 400-500 nm (blue) and 650-700 nm (red) due to the high absorbance of chlorophylls in these ranges. For all the diseases, a decrease in absorbance was observed in the region of the visible spectrum 400-700 nm, which is expected, considering the decrease in activity as well as in the photosynthetic area, generated by the pathogens. In the Near Infrared Region (NIR), the differences are usually related to the variations in the moisture content of the leaves.
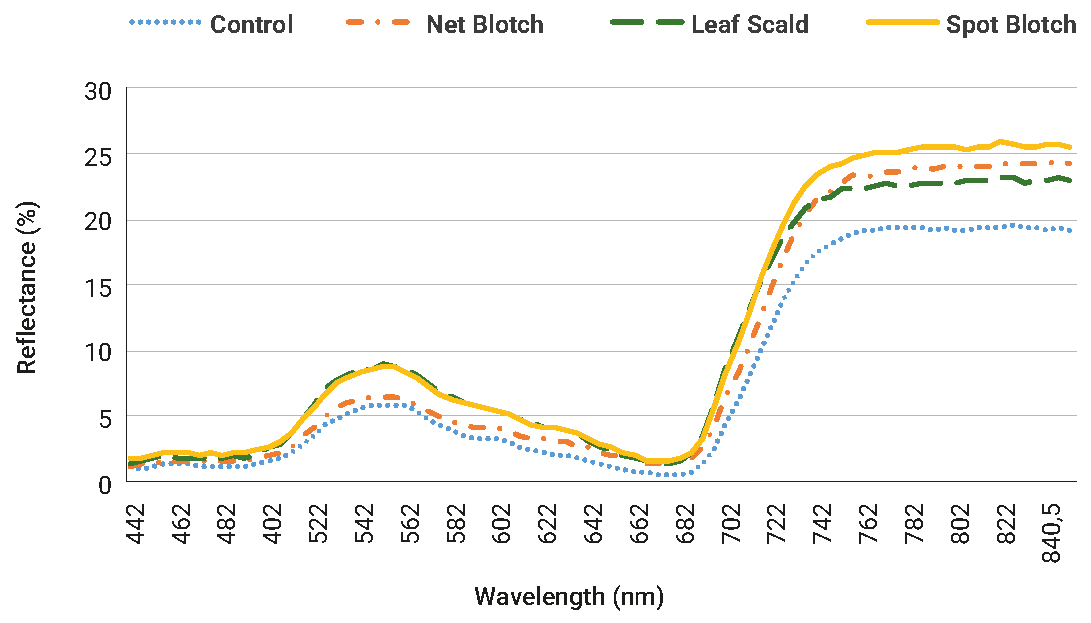
Figure 1
Average spectral signatures. Dot: control; Dot dashed: Net Blotch; Dashed: Leaf Scald; Continuous: Spot Blotch.
Maximum Discrimination Index (MDI)
Figure 2 shows the result of the calculation of the MDI for the spectral signatures (twelve spectra: three for each case). This result is a contour plot of Eq. (2) representing the discriminant capacity of the estimator as a function of the wavelengths. From the figure, it is observed that the spectral bands, which maximize the MDI, are 440-490 nm and 645-680 nm. These bands are the most sensitive to differentiate healthy plants from diseased ones based on the spectral signatures obtained in the laboratory.
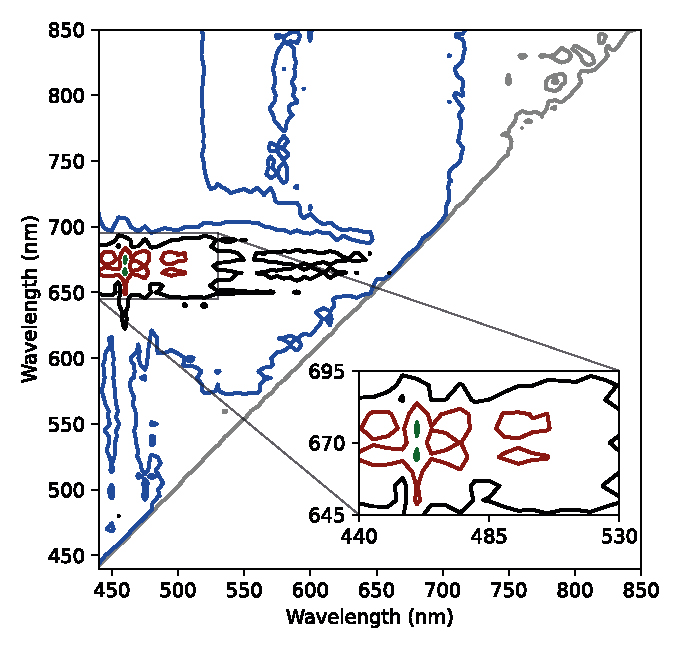
Figure 2
Isolines of discriminant capacity between healthy and diseased leaves as a function of the wavelength. Green (99%), red (95%), black (75%), blue (50%) and gray (25%).
Spectral indices
Figure 3 presents the average vegetation index values for healthy and diseased leaves. The same letter above the bars indicates that the averages are not significantly different (p > 0.05). The figure suggests that ARI, MCARI, RVSI and NPCI are not able to discriminate between treatments, whereas SIPI, TVI, CL-REDE, NDRE, RBNDVI, CRI and AI can only identify some of the diseases. On the other hand, NDVI, CARI, NRI, OSAVI, RGR and MDI are suitable to differentiate between healthy and diseased leaves but not between the different diseases. However, it should be noted that, for the present analysis, the aim of the calculation of the MDI was not to differentiate between diseases, but to find the bands where there is greater sensitivity to differentiate between healthy and diseased leaves. Finally, it is apparent that GNDVI is the only index capable of detecting differences between healthy and diseased vegetation as well as between all diseases.
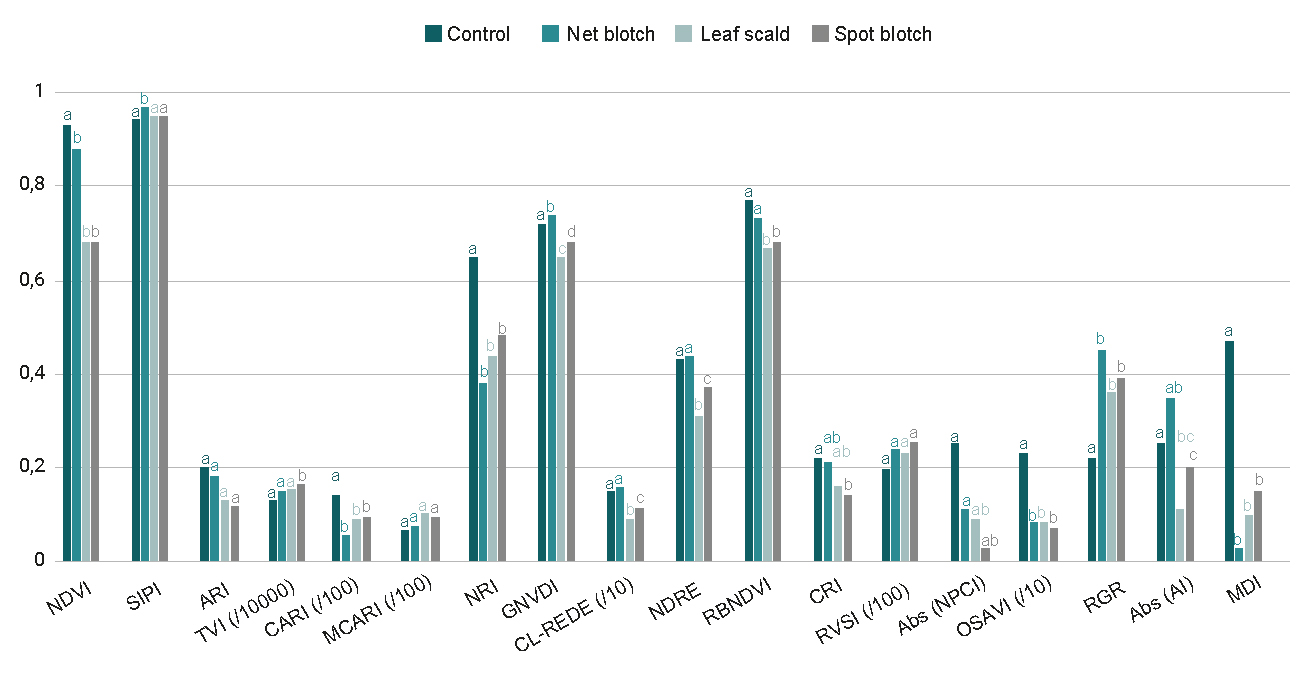
Figure 3
Mean comparison test for each treatment. Means with a common letter are not significantly different (p > 0.05).
Severity estimation and calculus
A typical RGB image of sick leaves is shown in figure 4 (left), where the disease is identified by its brown/red spot. Previously, to evaluate the spectral separability of the training areas, the Jeffries-Matusita index was calculated. This index computes the statistical measure of separability between two datasets based on probability distributions, ranging from 0 (indicating no separability) to 2 (indicating maximum separability). Values close to 2 were obtained, indicating that the classes are highly differentiable (Lillesand et al., 2015). The result of applying supervised classification to the RGB pixels is depicted in figure 4 (right). Three classes are identified: background (black), healthy (green), and sick (red). The quotient between the numbers of sick pixels and the sum of healthy and sick ones gives the digitally calculated severity.
The results for the visual estimation of the severity performed by the six agronomists and its calculation by image classification are presented in Figure 5. The red dots show the digitally calculated severity through image classification, whereas the bars depict the range of values returned by visual estimators and the dots within are the averages. For net blotch (figure 5a), the digitally calculated values of severity are between 6.9% and 16.0%, while for visual estimation, the range is 2-20%. In the case of leaf scald (figure 5b), the digital severity takes values between 3.2% and 7.1%, while the estimates of the six agronomists ranged from 3 to 16%. Finally, in the case of spot blotch, the digital severity varies between 1.9% and 5.0%, while for visual estimates, a range between 1-30% is observed.
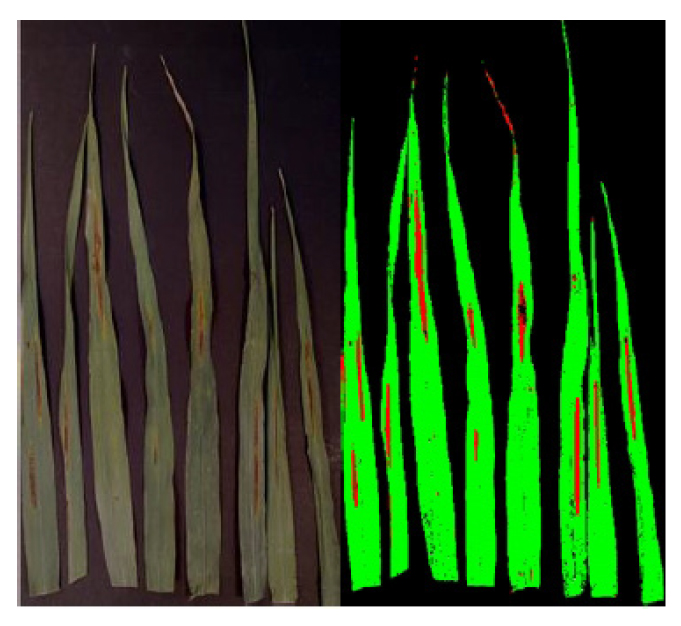
Figure 4
RGB image with net blotch symptoms (left) and image classification (right). Green healthy tissue, red diseased tissue and black background.
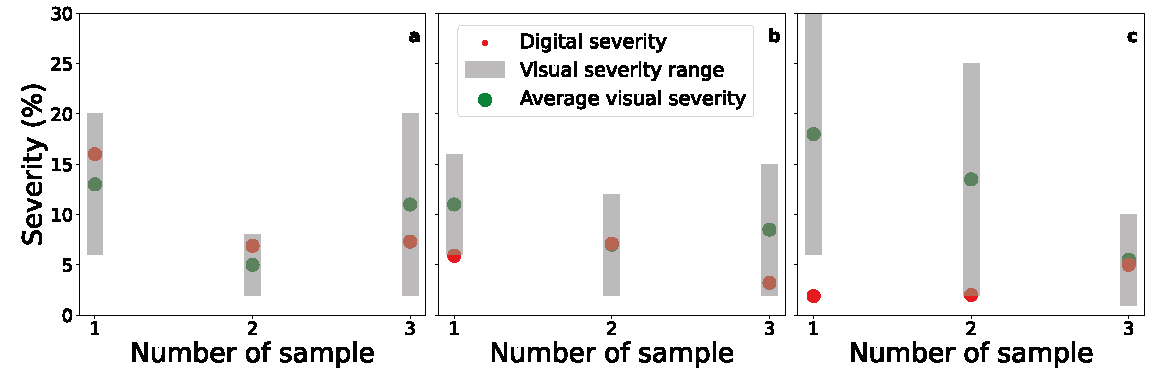
Figure 5
Digital severity (red dots) calculated by image classification and Average visual severity (green dots) estimated by agronomists. The bars depict the range of visual estimations. a) Net blotch, b) Leaf scald, c) Spot blotch.
DISCUSSION
Spectral signatures
The spectral signatures of the healthy barley crop and those with the three main foliar diseases were obtained. The signatures showed expected differences since a reduction in absorbance can be seen in the region of the visible spectrum (400-700 nm) due to a decrease in the content of photosynthetic pigments. These results are consistent with those found by Lorenzen and Jensen (1989) regarding barley leaves. Numerous antecedents indicate that the change in reflectance that occurs on diseased leaves is caused by the first stage of the decomposition of chlorophyll pigments and subsequently of carotenoids, anthocyanins and xanthophylls (Gamon et al., 1992; Penuelas et al., 1994; Devadas et al., 2009) along with the destruction of the cellular structure produced by pathogens in advanced stages. These processes can lead to changes in the reflectance values in the visible and near-infrared spectral regions, particularly around 470 nm and 670 nm (chlorophyll absorption), 550 nm (green peak) and 730 nm (red edge) (Sankaran et al., 2010; West et al., 2003). Apart from the typical features observed among healthy and sick leaves that originate during the pathogenic process, it should be noted that the contrast in the NIR region could have also been caused by the differences in the moisture content since the leaves were collected several hours before the spectra were taken (Rodríguez-Pérez et al., 2007). Although this piece of information does not invalidate the results and discussions of the present work, it does highlight the need to continue with these investigations in further field trials.
Spectral indices
Regarding the MDI, it was found that the bands with the greatest sensitivity to differentiate healthy leaves from diseased ones were of 440-490 nm and 645-680 nm (figure 2). As commented before, these regions are characterized by the absorption peaks of chlorophyll b and a, respectively. Furthermore, the blue region is also related to the absorption of carotenoids and xanthophylls. It is important to highlight that the bands identified by the MDI as those of “maximum discrimination” depend on the data set used for the calculation. For example, in the case of discrimination between wheat (crop) and ryegrass (weed), the results were 430-450 nm and 690-705 nm (Lencina and Weber, 2020).
Among the indices capable of identifying diseased leaves (figure 3), we can mention those that depend on reflectance in the NIR (humidity): NDVI and OSAVI. In different ways, each of them compares the moisture content with some of the characteristic pigments of the plant: chlorophyll a and b (NDVI) and chlorophyll a (OSAVI). The NDVI index has been widely used by numerous authors to estimate parameters such as the leaf area index since it is a good indicator of the nitrogen content, biomass and grain yield, and the water content of the plant (Jones et al., 2007, Bongiorno, 2021). The OSAVI index is characterized by having a correction factor to reduce the ground effect (Rondeaux et al., 1996). On the other hand, among the indices that depend on the NIR, there is also the GNDVI, which is a variant of the NDVI. This index discriminated between each of the diseases, with respect to healthy leaves (figure 3). The advantage of the GNDVI is that it is at least five times more sensitive to chlorophyll concentration than the NDVI and it is specifically useful for differentiating between stressed and senescent vegetation (Frampton et al., 2013, Bongiorno, 2021). Both the GNDVI and NDVI are widely used for the detection of diseases in crops. Yuan et al. (2014) and Zheng et al. (2018) successfully used these indices to detect yellow rust in wheat, while Isip et al. (2019) found the highest coefficient of determination for the detection of Gibberella moniliformis in onion. In all these cases, determination rates greater than 70% were obtained (Gomez Córdoba and Sandoval Morales, 2020). Although the results obtained with these indices are auspicious, it is possible that the discriminating capacity in this set of leaves is biased by the moisture content of the leaves, which, as mentioned above, were collected several hours in advance of the moment in which the spectral signatures were acquired.
Another index that identified diseases was the CARI, which nonlinearly combines the effects of anthocyanins, chlorophyll a, and red edge. The CARI index was developed by Kim et al. (1994) to minimize the effects of non-photosynthetic materials on remote estimates of absorbed photosynthetically active radiation (Daughtry et al., 2000). This index was identified as one of the best to detect Blumeria graminis in wheat by Zhang et al., (2012). This is because the most suitable spectral regions for studying the effects of pigment reduction by pathogens are those around 680 nm, which correspond to the absorption peak of chlorophyll a, and 550 nm, which coincide with the minimum absorption of chlorophyll in the visible domain. The choice of 700 nm is due to its location at the boundary between the region where the vegetation reflectance is dominated by pigment absorption and the beginning of the portion of the red edge where the structural characteristics of the vegetation have the most influence on the reflectance (Haboudane et al., 2002).
Finally, among the indices that could identify diseases, we can also find the NRI and the RGR. These indices capture the relationship between the contents of chlorophylls (red) and anthocyanins (green). In healthy leaves, or in senescent ones, anthocyanins have a shielding effect against excess sunlight (Feild et al., 2001). However, it has also been shown that there is a correlation between the presence of anthocyanins and infected plants, which is associated with a reduction in leaf cell death (Himeno et al., 2014; Pereira et al., 2019). Therefore, although anthocyanins are minor dyes in barley leaves, their presence could be a spectral indicator for the type of foliar diseases studied in this work.
The NRI and the RGR, as well as the calculated MDI, indicate that it would be possible to detect leaf spots in barley using sensors with bands in the visible spectrum region, for example, the RGB. This represents an advantage since it would allow the implementation of a technique for the detection of foliar diseases using sensors that are already in the market and that have a lower cost than infrared or thermal sensors, facilitating the adoption of this technology.
RGB images
The results obtained with the NRI, RGR and MDI spectral indices motivated the exploration of discrimination techniques based on RGB images. In this work, which is a first approach to the problem, the maximum likelihood algorithm was used (Sarkar et al., 2021; Asad and Bais, 2020; Mattupalli et al., 2018). For each image, the background was separated from the leaf and the affected regions were identified. The algorithm was able to identify the three diseases and quantify their severity by counting pixels. These values were contrasted with the visual estimates made by the six agronomists. From the results summarized in figure 5, it is observed that the averages of the visual estimates present dissimilar values with respect to digital severity. There are cases in which the differences are less than 1% (figure 5b, sample 2; figure 5c, sample 3), whereas in other cases they reach 15% (figure 5c, sample 1). Likewise, a great dispersion of values is observed in the visual estimation of severity among evaluators, with a minimum of 5% for Net blotch sample 2 (figure 5a) to almost 25% for Spot blotch sample 1 (figure 5c). Moreover, a single visual estimation of an agronomist may differ by more than 25% from the digital severity, as can be seen in the samples 1 and 2 of Spot blotch (figure 5c) from the difference between the top of the bars and the red dots. These discrepancies lead us to wonder what might happen in a field situation. It should be kept in mind that in visual estimates made in the production fields of a crop, only one agronomist conducts the survey; therefore, the difference between his estimate and the digitally calculated one could result in significant values, according to our previous discussion. Note that these largest differences occur in cases of very low severity. This is where digital estimation of severity can have the greatest impact, avoiding unnecessary applications of phytosanitary products or significant losses in profitability for the producer (Bock et al., 2010; 2020; 2022).
CONCLUSIONS
Some of the calculated spectral indices demonstrated to be useful tools for detecting disease symptoms, even at low levels of severity. This fact highlights the potential of using spectral indices to determine the health status of crops, since these levels of severity are usually the ones considered when setting the thresholds for the application of phytosanitary products. Our results suggest the potential of optical sensors to detect diseases, which represents a great advantage due to its wide diffusion and low cost.
The diagnosis and quantification of diseases are the basis of the sanitary management of crops. The results shown in this work on severity visual estimates coincide with those obtained by numerous authors and highlight the need to improve disease quantification methods. The inaccuracies generated when diseases are visually estimated have a direct and negative effect on management control decisions, with the result that producers may incur in large losses or unnecessary applications by underestimating or overestimating the level of damage. Likewise, in research works, these inaccuracies can mask the effects of the treatments being studied if the necessary precautions are not taken, such as frequent training of the staff or the use of diagrammatic scales.
Finally, it must be pointed out that the results obtained in this work are based on laboratory conditions. Therefore, it is necessary to validate them in the field by carrying out an evaluation of different genotypes, phenological stages and cultivation conditions, in order to test and calibrate the technique for its use in monitoring systems based on the use of remote sensors.
Acknowledgments
ACKNOWLEDGMENTS
E. D. thanks the Faculty de Agronomy of the National University of the Center of the Buenos Aires Province for the financial support. This work was partially financed by the Secretariat of University Policies of Argentina within the framework of the project “Diagnosis of Diseases in Winter Crops Using Remote Sensors: A Necessary Challenge for Sustainable Food Production” and the Scientific Investigations Committee of the Buenos Aires Province (CIC), project RIDEE-PBA “Detection and Diagnosis of Foliar Diseases in Winter Cereals: Estimation of Incidence and Severity Using RGB Images Acquired by Consumer Drones”.
REFERENCES
ASAD, M.H.; BAIS, A. 2020. Weed detection in canola fields using maximum likelihood classification and deep convolutional neural network. Information Processing in Agriculture, 7, 535-545. https://doi.org/10.1016/j.inpa.2019.12.002
ASHOURLOO, D.; MOBASHERI, M.; HUETE, A. 2014. Developing Two Spectral Disease Indices for Detection of Wheat Leaf Rust (Puccinia triticina). Remote Sensing, 6, 4723-4740. https://doi.org/10.3390/rs6064723
BAURIEGEL, E.; GIEBEL, A.; GEYER, M.; SCHMIDT, U.; HERPPICH, W.B. 2011. Early detection of Fusarium infection in wheat using hyper-spectral imaging. Computers and Electronics in Agriculture, 75, 304-312. https://doi.org/10.1016/j.compag.2010.12.006
BOCK, C.H.; BARBEDO, J.G.; DEL PONTE, E.M.; BOHNENKAMP, D.; MAHLEIN, A.K. 2020. From visual estimates to fully automated sensor-based measurements of plant disease severity: status and challenges for improving accuracy. Phytopathology Research, 2, 1-30.
BOCK, C.H.; CHIANG, K.S.; DEL PONTE, E.M. 2022. Plant disease severity estimated visually: A century of research, best practices, and opportunities for improving methods and practices to maximize accuracy. Tropical Plant Pathology, 47, 25-42. https://doi.org/10.1007/s40858-021-00439-z
BOCK, C.H.; POOLE, G.H.; PARKER, P.E.; GOTTWALD, T.R. 2010. Plant Disease Severity Estimated Visually, by Digital Photography and Image Analysis, and by Hyperspectral Imaging. Critical Reviews in Plant Sciences, 29, 59-107. https://doi.org/10.1080/07352681003617285
BONGIORNO, C.V. 2021. Uso de índices espectrales para detectar el efecto de la profundidad de tosca en el cultivo de maíz. (Tesis de Maestría, UNCPBA).
BRAVO, C.; MOSHOU, D.; WEST, J.; MCCARTNEY, A.; RAMON, H. 2003. Early Disease Detection in Wheat Fields using Spectral Reflectance. Biosystems Engineering, 84, 137-145. https://doi.org/10.1016/S1537-5110(02)00269-6
CALDERÓN, R.; ZARCO-TEJADA, P.J.; NAVAS CORTÉS, J.A.; LOPÉZ, M. 2018. Detección de enfermedades de cultivos mediante imágenes hiperespectrales y térmicas de alta resolución espacial. (Available at: https://www.interempresas.net/ Grandes-cultivos/Articulos/208145-Deteccion-enfermedadescultivos-mediante-imagenes-hiperespectrales-termicas-alta. html verified on May 10th, 2024).
DAUGHTRY, C.; WALTHALL, C.; KIM, M.S.; COLSTOUN, E.; MCMURTREY, J.E. 2000. Estimating Corn Leaf Chlorophyll Concentration from Leaf and Canopy Reflectance. Remote Sensing of Environment, 74, 229-239. https://doi.org/10.1016/S0034-4257(00)00113-9
DEVADAS, R.; LAMB, D.W.; SIMPFENDORFER, S.; BACKHOUSE, D. 2009. Evaluating ten spectral vegetation indices for identifying rust infection in individual wheat leaves. Precision Agriculture, 10, 459-470.
DI RIENZO, J.A.; CASANOVES, F.; BALZARINI, M.G.; GONZALEZ, L.; TABLADA, M.; ROBLEDO, C.W. 2020. InfoStat versión 2020. Centro de Transferencia InfoStat, FCA, Universidad Nacional de Córdoba, Argentina. (Available at: http://www.infostat.com.ar verified on May 10, 2024).
ERREGUERENA, I.; QUIROZ, F.; GIMENEZ, F. 2017. Red de Protección ante Enfermedades de Cebada. (Available at: https://inta.gob.ar/sites/default/files/inta_repec_informefinal_campana2016-2017.pdf verified on April 6, 2020).
FAO (FOOD AND AGRICULTURE ORGANIZATION OF THE UNITED NATIONS). 2022. FAOSTAT- Producción agrícola. (Available at: https://www.fao.org/faostat/es/#rankings/countries_by_commodity verified on May 10, 2024).
FEILD, T.S.; LEE, D.W.; HOLBROOK, N.M. 2001. Why leaves turn red in autumn. The role of anthocyanins in senescing leaves of red-osier dogwood. Plant Physiology, 127, 566-574.
FRAMPTON, W.J.; DASH, J.; WATMOUGH, G.; JAMES MILTON, E.J. 2013. Evaluating the capabilities of Sentinel-2 for quantitative estimation of biophysical variables in vegetation. ISPRS Journal of Photogrammetry and Remote Sensing, 82, 83-92.
FRANKE, J.; MENZ, G. 2007. Multi-temporal wheat disease detection by multi-spectral remote sensing. Precision Agriculture, 8, 161-172. https://doi.org/10.1007/s11119-007-9036-yGAMON, J.A.; PENUELAS, J.; FIELD, C.B. 1992. A narrow-waveband spectral index that tracks diurnal changes in photosynthetic efficiency. Remote Sensing of Environment, 41, 35-44. https://doi.org/10.1016/0034-4257(92)90059-S
GILCHRIST-SAAVEDRA, L.; FUENTES-DÁVILA, G.; MARTÍNEZ-CANO, C.; LÓPEZ-ATILANO, R.M.; DUVEILLER, E.; SINGH, R.P.; HENRY, M.; GARCÍA, I.A. 2005. Guía práctica para la identificación de algunas enfermedades de trigo y cebada. Segunda edición. CIMMYT. México, D. F.
GOMEZ CORDOVA, E.M.; SANDOVAL MORALES, E. 2020. Una revisión: Uso de imágenes satelitales para la detección de plagas y enfermedades en cultivos. https://hdl.handle.net/20.500.12692/53274
HABOUDANE, D.; MILLER, J.R.; TREMBLAY, N.; ZARCO-TEJADA, P.; DEXTRAZE, L. 2002. Integrated narrow-band vegetation indices for prediction of crop chlorophyll content for application to precision agriculture. Remote Sensing of Environment, 81, 416-426.
HIMENO, M.; KITAZAWA, Y.; YOSHIDA, T.; MAEJIMA, K.; YAMAJI, Y.; OSHIMA, K.; NAMBA, S. 2014. Purple top symptoms are associated with reduction of leaf cell death in phytoplasma-infected plants. Sci Rep 4, 4111. https://doi.org/10.1038/srep04111
HUANG, W.; LAMB, D.W.; NIU, Z.; ZHANG, Y.; LIU, L.; WANG, J. 2007. Identification of yellow rust in wheat using in-situ spectral reflectance measurements and airborne hyperspectral imaging. Precision Agriculture, 8, 187-197. https://doi.org/10.1007/s11119-007-9038-9
INASE (INSTITUTO NACIONAL DE SEMILLAS). 2022. Cebada 2021/2022. Sistema de Información Simplificado Agrícola. (Available at: https://www.argentina.gob.ar/sites/default/files/inase_if_sisa_cebada_2021_2022.pdf verified on May 10, 2024).
ISIP, M.F.; ALBERTO, R.T.; BIAGTAN, A.R. 2019. Exploring vegetation indices adequate in detecting twister disease of onion using Sentinel-2 imagery. Spatial Information Research, 28, 369-375.
JANECEK, M. 2012. Reflectivity spectra for commonly used reflectors. IEEE Transactions on Nuclear Science, 59, 490-497.
JONES, C.L.; WECKLER, P.R.; MANESS, N.O.; JAYASEKARA, R.; STONE, M.L.; CHRZ, D. 2007. Remote sensing to estimate chlorophyll concentration in spinach using multi-spectral plant reflectance. Transactions of the ASABE, 50, 2267-2273.
KIEHR, M.E.; WEHRHAHNE, L.N.; DADDARIO, J.F.F.; STORM, A.C.; DELHEY, R.R. 2016. Enfermedades de cebada en Argentina: diagnóstico y manejo. Ed: Centro Regional de Ingenieros Agrónomos de Tres Arroyos. 128 p.
KIM, M.S.; DAUGHTRY, C.S.; CHAPPELLE, E.W.; MCMURTREY, J.E.; WALTHALL, C. 1994. The use of high spectral resolution bands for estimating absorbed photosynthetically active radiation (A par). Proceedings of 6th International Symposium on Physical Measurements and Signatures in Remote Sensing; CNES, Phoenix, Ariz, USA. (Available at: https://ntrs.nasa.gov/citations/19950010604 verified on May 10, 2024).
KIMBALL, S.; MATTIS, P. 2021. GNU Image Manipulation Program (GIMP). (2.10.12) [Windows]. Free Software Foundation, Inc. (Available at: https://www.gimp.org verified on May 10, 2024).
KUSKA, M.; WAHABZADA, M.; LEUCKER, M.; DEHNE, H.-W.; KERSTING, K.; OERKE, E.-C.; STEINER, U.; MAHLEIN, A.-K. 2015. Hyperspectral phenotyping on the microscopic scale: Towards automated characterization of plant-pathogen interactions. Plant Methods, 11, 28. https://doi.org/10.1186/s13007-015-0073-7
LENCINA, A. 2021. Calculador del MDI (Ba). Replit. (Available at: ttps://replit.com/@AlbertoLencina/Calculador-del-MDI-Ba verified on May 10, 2024).
LENCINA, A.; WEBER, C. 2020. Maximum discrimination index: A tool for land cover identification. International Journal of Environmental Science and Technology, 17, 113-1122. https://doi.org/10.1007/s13762-019-02547-5
LILLESAND, T.M.; KIEFER, R.W.; CHIPMAN, J.W. 2015. Remote Sensing and Image Interpretation. 7th Edition, Wiley.
LORENZEN, B.; JENSEN, A. 1989. Changes in leaf spectral properties induced in barley by cereal powdery mildew. Remote Sensing of Environment, 27, 201-209.
MARTINELLI, F.; SCALENGHE, R.; DAVINO, S.; PANNO, S.; SCUDERI, G.; RUISI, P.; DANDEKAR, A. M. 2015. Advanced methods of plant disease detection. A review. Agronomy for Sustainable Development, 35, 1-25. https://doi.org/10.1007/s13593-014-0246-1
MAHLEIN, A.K. 2016. Plant disease detection by imaging sensors–parallels and specific demands for precision agriculture and plant phenotyping. Plant disease, 100, 241-251. https://apsjournals.apsnet.org/doi/10.1094/PDIS-03-15-0340-FE
MAHLEIN, A.K.; OERKE, E.-C.; STEINER, U.; DEHNE, H.-W. 2012. Recent advances in sensing plant diseases for precision crop protection. European Journal of Plant Pathology, 133, 197-209. https://doi.org/10.1007/s10658-011-9878-z
MAHLEIN, A.K.; RUMPF, T.; WELKE, P.; DEHNE, H.-W.; PLÜMER, L.; STEINER, U.; OERKE, E.-C. 2013. Development of spectral indices for detecting and identifying plant diseases. Remote Sensing of Environment, 128, 21-30. https://doi.org/10.1016/j.rse.2012.09.019
MATTUPALLI, C.; MOFFET, C.A.; SHAH, K.N.; YOUNG, C.A. 2018. Supervised Classification of RGB Aerial Imagery to Evaluate the Impact of a Root Rot Disease. Remote Sensing 10, 917. https://doi.org/10.3390/rs10060917
MIRALLES, D.; BENECH-ARNOLD, R. L.; ABELEDO, G. (Eds.). 2011. Cebada Cervecera. 1.a ed. Orientación Grafica Editora.
PENUELAS, J.; GAMON, J.A.; FREDEEN, A.L.; MERINO, J.; FIELD, C.B. 1994. Reflectance indices associated with physiological changes in nitrogen- and water-limited sunflower leaves. Remote Sensing of Environment, 48, 135-146. https://doi.org/10.1016/0034-4257(94)90136-8
PEREIRA, W.E.L.; FERREIRA, C.B.; CASERTA, R.; MELOTTO, M.; DE SOUZA, A.A. 2019. Xylella fastidiosa subsp. pauca and fastidiosa Colonize Arabidopsis Systemically and Induce Anthocyanin Accumulation in Infected Leaves. Phytopathology 109:2, 225-232.
PEREYRA, S.; GERMÁN, S. 2012. Manejo de enfermedades en trigo y cebada en un contexto de márgenes reducidos. Jornada Cultivos de Invierno, Mercedes, Soriano, (UY). La Estanzuela, INIA Serie Actividades de Difusión, 677, 15-25.
RODRÍGUEZ-PÉREZ, J.; RIAÑO, D.; CARLISLE, E.; USTIN, S. SMART, D. 2007. Evaluation of Hyperspectral Reflectance Indexes to Detect Grapevine Water Status in Vineyards. American Journal of Enology and Viticulture, 58, 302-317. https://doi.org/10.5344/ajev.2007.58.3.302
RONDEAUX, G.; STEVEN, M.; BARET, F. 1996. Optimization of soil-adjusted vegetation indices. Remote Sensing of Environment, 55, 95-107.
SANKARAN, S.; MISHRA, A.; EHSANI, R.; DAVIS, C. 2010. A review of advanced techniques for detecting plant diseases. Computers and Electronics in Agriculture, 72, 1-13. https://doi.org/10.1016/j.compag.2010.02.007
SARKAR, S.; RAMSEY, A.F.; CAZENAVE, A.B.; BALOTA, M. 2021. Peanut leaf wilting estimation from RGB color indices and logistic models. Frontiers in Plant Science, 12, Article 658621.
WAHABZADA, M.; MAHLEIN, A.-K.; BAUCKHAGE, C.; STEINER, U.; OERKE, E.-C.; KERSTING, K. 2015. Metro Maps of Plant Disease Dynamics—Automated Mining of Differences Using Hyperspectral Images. PLOS ONE, 10, Article e0116902. https://doi.org/10.1371/journal.pone.0116902
WEST, J.S.; BRAVO, C.; OBERTI, R.; LEMAIRE, D.; MOSHOU, D.; MCCARTNEY, H.A. 2003. The potential of optical canopy measurement for targeted control of field crop diseases. Annual Review of Phytopathology, 41, 593-614. https://doi.org/10.1146/annurev.phyto.41.121702.103726
YUAN, L.; HUANG, Y.; LORAAMM, R.W.; NIE, C.; WANG, J.; ZHANG, J. 2014. Spectral analysis of winter wheat leaves for detection and differentiation of diseases and insects. Field Crops Research, 156, 199-207. https://doi.org/10.1016/j.fcr.2013.11.012
ZHANG, J.; HUANG, Y.; PU, R.; GONZALEZ-MORENO, P.; YUAN, L.; WU, K.; HUANG, W. 2019. Monitoring plant diseases and pests through remote sensing technology: A review. Computers and Electronics in Agriculture, 165, Article 104943. https://doi.org/10.1016/j.compag.2019.104943
ZHANG, J.; YUAN, L.; WANG, J.; HUANG, W.; CHEN, L.; ZHANG, D. 2012. Spectroscopic leaf level detection of powdery mildew for winter wheat using continuous wavelet analysis. Journal of Integrative Agriculture 11, 1474-1484.
ZHENG, Q.; HUANG, W.; CUI, X.; SHI, Y.; LIU, L. 2018. New spectral index for detecting wheat yellow rust using Sentinel-2 multispectral imagery. Sensors, 18(3), 868.
