Artículos originales
Energy-Economic Evaluation in the Production of Canned Tuna in Ecuadorian Industry
Evaluación energético-económica en la producción de atún en conservas en la industria ecuatoriana
Energy-Economic Evaluation in the Production of Canned Tuna in Ecuadorian Industry
Revista Ciencias Técnicas Agropecuarias, vol. 26, núm. 3, 2017
Universidad Agraria de La Habana Fructuoso Rodríguez Pérez
Recepción: 30 Enero 2017
Aprobación: 15 Junio 2017
Abstract: The lack of indicators for the energetic - economic evaluation of the canned tuna canning process motivated the present work aimed at establishing those indicators that contribute to the establishment of benchmarking that serve as reference for the evaluation of this process. The methodology used combined, from the literature consulted, a method to determine the energetic efficiency of a pyrotubular steam generator with a procedure to calculate the cost of saturated steam generated by the system, and finally adapts the proposal of key indicators of performance for the improvement of an industry performance, establishing the indicators for the energetic - economic evaluation of the process under study. The main results showed that the consumption of specific steam was 1,142 t of steam/t of raw material, with a specific cost of 27,074 USD/t of raw material, concentrating 72.67% of steam consumption in cooking and sterilization processes. The implementation of the proposed indicators corroborated the relevance.
Keywords: tuna, steam, cooking, sterilization, energetic-economic indicators.
Resumen: La carencia de indicadores para la evaluación energético-económica del proceso de elaboración de conservas de atún en latas, motivó el presente trabajo dirigido a establecer indicadores energético - económicos que contribuyan al establecimiento de benchmarking que sirvan de referencia para la evaluación de dicho proceso. La metodología utilizada combinó, a partir de la literatura consultada, un método para determinar la eficiencia energética de un generador de vapor pirotubular con un procedimiento para el cálculo del costo del vapor saturado generado por el sistema, y finalmente adapta la propuesta de indicadores claves de desempeño para la mejora del rendimiento de una industria, estableciendo los indicadores para la evaluación energético - económica del proceso objeto de estudio. Los principales resultados arrojaron que el consumo de vapor específico fue de 1 142 t de vapor/ton de materia prima, con un costo específico de 27,074 $/t de materia prima, concentrándose el 72,67% del consumo de vapor en los procesos de cocinado y esterilizado. La implementación de los indicadores propuestos corroboró su pertinencia.
Palabras clave: atún, vapor, cocinado, esterilizado, indicadores energético-económicos.
INTRODUCTION
The fishing sector is particularly important in developing countries, as it represents the livelihood of 8% of the world’s population (Avadí and Fréon, 2013). It is estimated that 56.6 million people were employed in the primary sector of capture fisheries and aquaculture in 2014, of which 36% were full time, 23% part-time and the rest were occasional fishermen or unspecified situation (FAO, 2016).
Fisheries and aquaculture sector accounted for 12% of Ecuador’s exports, becoming the second exportable product after oil in the country (Avadí et al., 2015). Ecuador is among the top ten countries in the world in catch of tuna, and is the second largest tuna processor, after Thailand, with almost 12% of annual global production. From 2014, 27 tuna processing plants operate in the country according to the Vice Ministry of Aquaculture and Fisheries (Pacheco, 2013), located in two provinces of the coast: 81% in Manabí, specifically in the city of Manta and 19% in Guayas, in the cities of Guayaquil and Posorja, a number that has increased since in 2008 there were only 18 plants (Avadí et al., 2015).
In the canning process of canned tuna, steam is the most suitable means of transporting heat demanded by different processes, such as cooking, packaging, sterilizing, labeling and packaging, to convert tuna into a finished product (Avadí et al., 2015). Factors such as the efficiency and productivity of the equipment and machines that generate and consume it, will directly determine the cost of the ton of steam produced and the ton of raw material processed (Jimenez et al., 2016).
In the literature reviewed, different researches have been carried out which show the importance of the energetic-economic evaluation of the machinery used in agricultural processes (De las Cuevas et al., 2010; García de la Figal et al., 2012; Pereira et al., 2015), however, about the process of canning tuna, no studies were found that define or present values of steam consumption/t of total processed tuna, nor in each stage of the process, which is indispensable in studies of optimization, design and control of this type of industrial processes, not only for the reduction of the use of energy carriers, but also for emissions of polluting gases, which today represents a problem that worries humankind.
For this reason, the objective of this work is to establish a set of energetic - economic indicators for the tuna canning process, which contributes to the establishment of benchmarking to serve as a reference for their energetic - economic evaluation with a view to continuous improvement thereof. This work is part of a project financed by the Ecuadorian government through its scholarship program of the National Secretariat of Science and Technology and Innovation (SENESCYT), and was carried out in one of the most important transnational canned tuna processing companies in the Republic of Ecuador.
METHODS
The study was carried out in one of the largest canned tuna processing companies in the Republic of Ecuador, which has a production capacity of 12,000 boxes and exports its products to more than 30 countries in South America and Europe. Figure 1 shows the process map for the preparation of canned tuna of this company, in which the subsystems that integrate the system are clearly differentiated: steam generation and production process.
Figure 1
Map of Tuna Canning Processes of the Company Object of Study.
The experimental data were taken in September 2015 for 15 days. For the determination of a set of energetic - economic indicators with a view to the establishment of benchmarking that allow the evaluation of the tuna canning process for its continuous improvement, a methodology was applied that consists of three main stages.
In the first stage, the thermal parameters are determined applying the method used by Jiménez et al. (2016), the energetic efficiency of the Cleaver Brooks pyrotubular steam generator is evaluated, and the economic operating costs are established, which in their integration allow obtaining the cost of the saturated steam generated by the system using an adaptation of the methodology used by Silveira et al. (2012).
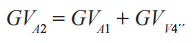
Thermal Parameters of the Steam Generation System By means of a mass balance to the water supply tank of the pyrotubular boiler, the quantity of water leaving the tank was determined GVA2 , using equation (1):
 (1)
(1)Where:
GVA1 = entrance to the water supply tank (kg/h)
GVV4´´= steam inlet to water supply tank (kg/h)
To determine GVA1 a volumetric multi-flow meter, model GMDX90°C of 2” of diameter was installed at the inlet of the water supply tank of the boiler.
The parameters that define the thermodynamic state of GVV4’’ were obtained by means of the calculation of the losses of pressure and heat by convection and radiation in the steam pipe of the water supply tank, applying the fundamental equations of fluid mechanics and heat transfer presented by Levenspiel (2014), and applied to the methodology described by Vega and González (2002). By performing an energy balance to the boiler water supply tank, the amount of condensate formed by the heating of the boiler feed water was determined. It was calculated according to equation (2).
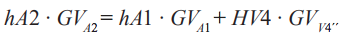 (2)
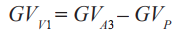
(2)The quantity of steam generated in the boiler pyrotubular, was determined according to the equation (3), defining it as the difference between the water that enters to the boiler and the quantity that goes out of it for concept of the purges.
 (3)
(3)Where:
GVV1 = steam generated by the pyrotubular boiler (kg/h)
GVA2= GVA3= outlet of the water supply tank (kg/h)
GVP = water from level and bottom purges (kg/h)
To determine the amount of water leaving the boiler (GVP) due to the purging, a metal container was placed at the outlet of the purge tank, which was duly cubed, where the volume extracted per hour of the boiler was measured. On the basis of the measurements realized and applying the procedure proposed by Spirax Sarco (2004), this parameter was calculated according to equation (4).
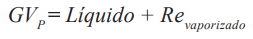 (4)
(4)Where:
Liquid = Liquid collected in metal tank (kg/h)
Revaporized= flash steam of condensate discharge kg/h)
The vapor generated by the system was determined according to equation (5), where the difference between the vapor generated by the pyrotubular boiler and the summation of all consumptions of the components of the steam generation system, is represented.
 (5)
(5)Where:
GVV2´´= heating steam of daily fuel tank (kg/h)
GVV3´´= heating steam of fuel storage tank (kg/h)
GVV4´´= heating steam of boiler feed water tank (kg/h)
GVV5´´= heating steam of fuel heater (kg/h)
GVV6 = steam to canning process (kg/h).
For the determination of the aforementioned components, tanks were constructed and installed for the collection and quantification of condensate, proceeding in a manner analogous to the collection of condensate from the boiler purges.
The fuel flow (GVF1) entering the fuel storage tank (TAF) was obtained by statistical analysis in the Statgraphic software of the fuel information that monthly entered the steam generation system during the year 2015. The fuel consumed by the boiler (GVF8) is calculated by equation 6.
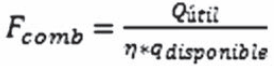 (6)
(6)Where:
Fcomb = fuel fl ow to the boiler (kJ/h)
Quseful = heat absorbed by the water in the boiler (kJ/h)
Qavailable= heat of fuel (kJ/kg comb.)
The fuel fl ow that drives the boiler feed pump (GVF5) was determined by the manufacturer’s technical specifi cations.
The measurements of the chemical composition of the exhaust gases of the pyrotubular boiler were determined by the Testo brand, model 350 series 02555648 exhaust gas measurement equipment owned by ELICROM Company.
In order to obtain the elemental chemical composition of fuel oil No. 6, distributed by Petrocomercial for the entire Ecuadorian industrial sector, and which is the analyzed company supplier, a sample was sent to the company “SertinLab”. It is a company that performs analysis of fuels and lubricants, accredited by Ecuadorian State.
Evaluation of Energetic Efficiency of Pyrotubular Steam Generator, Brand Cleaver Brooks
Once measurements of all operation parameters of the steam generation system have been made, its energy effi ciency is determined, by indirect and direct methods, by applying equations (7) and (8) as expressed by Jiménez et al. (2016).
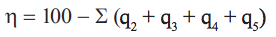 (7)
(7)Where:
q2 = exhaust gas loss (%)
q3 = loss due to incomplete chemical combustion (%)
q4 = loss due to incomplete mechanical combustion (%)
q5 = loss of heat transfer through walls (%)
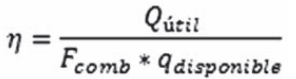 (8)
(8)Where:
Fcomb = fuel fl ow to the boiler (KJ/h)
Qútil = heat absorbed by the water in the boiler (KJ/h)
Qdisponible= fuel heat (kJ/kg comb.)
Saturated Steam Cost Generated by the System The cost of the ton of steam generated by the industry’s steam generation system was obtained according to equation (9) proposed by Silveira et al. (2012).
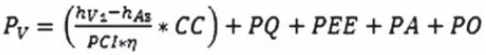 (9)
(9)Where:
PV = cost of steam ($/kg of steam)
hV1= saturated steam enthalpy at the outlet of the boiler (kJ/kg)
hA3 = water enthalpy at the inlet of the boiler (kJ/kg)
PCI = lower heating value of fuel #6 (kJ/kg)
CC = fuel price (0,252 $/kg of fuel)
PQ = chemicals cost (0,00097 $/kg of steam)
PA= cost of water consumption (0,0022 $/kg of steam)
PEE = cost of electric power consumption (0,0000337 $/kg of steam)
PO = cost of operation and maintenance (0,00174 $/kg of steam)
In the second stage, the key processes of tuna canning, in accordance with the technological requirements of the company object of study,are established using the process map of tuna processing proposed by Avadí et al. (2015), as well as the daily consumption of raw material and steam per stage of the process. That latest parameter was obtained by applying the procedure proposed by Spirax Sarco (2004), used in the first stage, and calculates the cost of the steam per day for each of the stages of the process according to equation (10).
 (10)
(10)Finally, in the third stage, the indicators for the energetic-economic evaluation of the process of tuna canning are established, adapting the proposal of key performance indicators for the performance improvement of an industry proposed by Lindberg et al. (2015).
RESULTS AND DISCUSSION
First Stage Results
The values of thermal parameters of the steam generation system, determined from measurements made in situ and calculated by applying the equations proposed in the methods, are shown in Table 1.
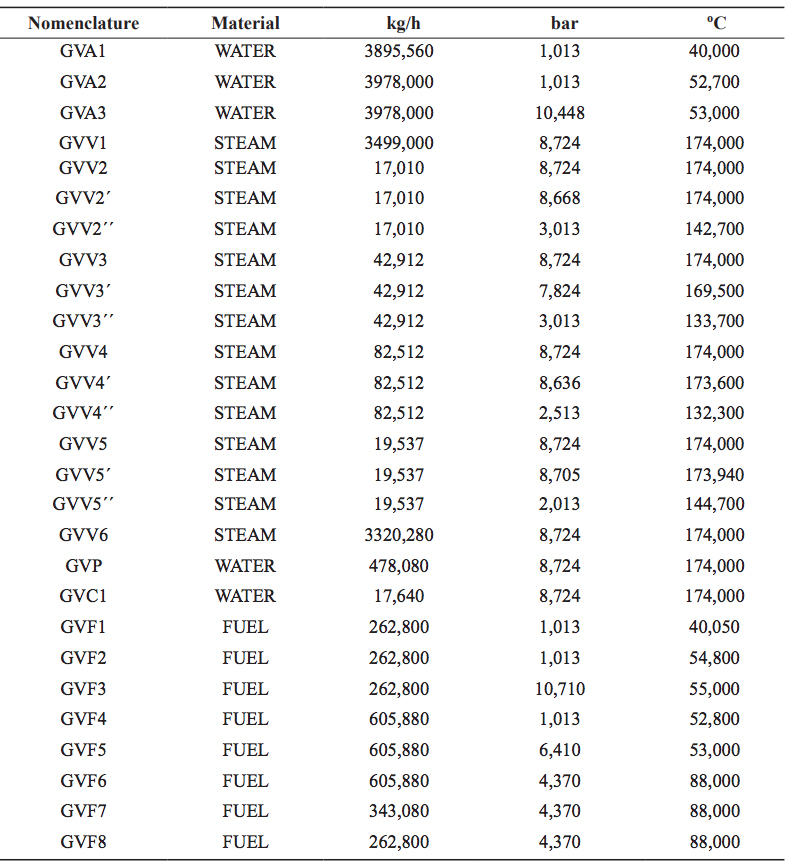
According to Jiménez et al. (2016), the energetic efficiency of the pyrotubular steam generator was evaluated, resulting in 84.91% by the indirect method and 83.82% by the direct method, which corresponds to the values predetermined by Nieuwlaar et al. (2015). Finally, the cost of the ton of steam generated by the company’s system under study, based on its operation and maintenance input costs, was 23.7 $/t of steam.
Second Stage Results
The parameters values of daily consumption of raw material and steam, as well as the cost of steam per day for each stage of the tuna canned elaboration process, were determined on the basis of measurements made in situ and the application of the equations in the methods, (Table 2).
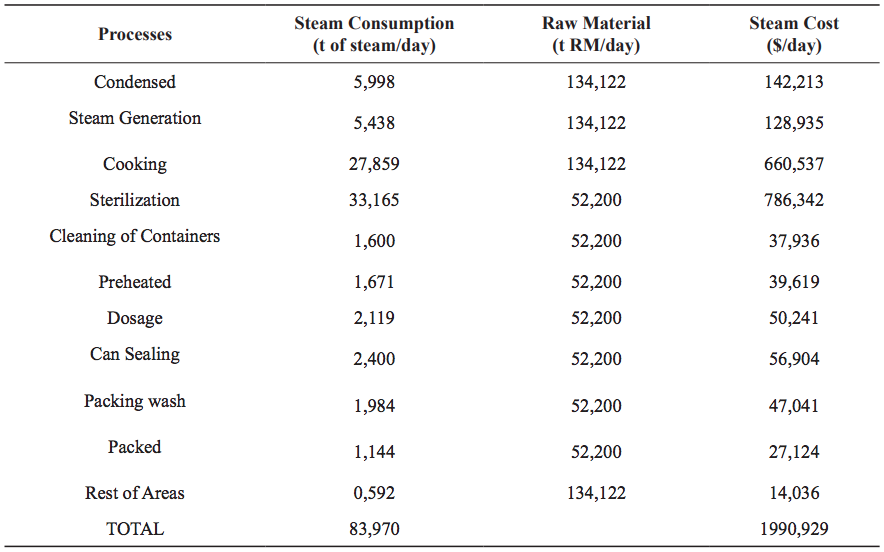
The results presented above allow inferring that daily yield of the tuna elaboration process in the company under study is 39%, which is considered acceptable, nevertheless, they must work to increase it since, according to Zagarramurdi et al. (1999), it should be in the range of 38-40% and Taboada et al. (2016) places it at 41%. In addition, the results show that 72.67% of the steam consumption is concentrated in the cooking and sterilization processes, reaffi rming what is presented by Avadí et al. (2015), where these processes are considered as steam consumers in the elaboration of canned tuna.
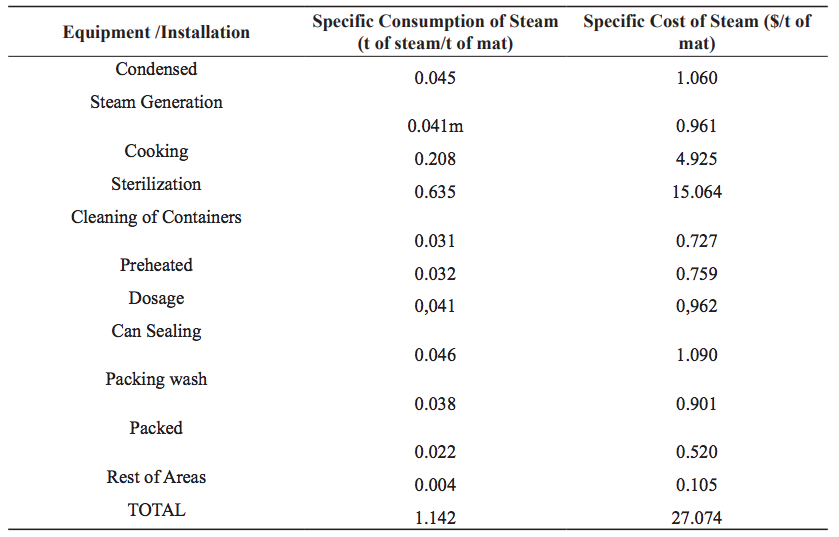
Third stage results
The proposal of key performance indicators for performance improvement of an industry by Lindberg et al. (2015) is adapted, establishing two fundamental indicators for the energetic - economic evaluation of each stage of the tuna canning process: specifi c consumption (Conev) and specifi c cost of steam (Cosev), which are calculated applying equations (11) and (12). The results obtained in the company under study are shown in Table 3.
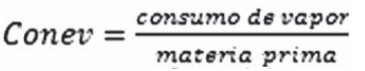 (11)
(11)
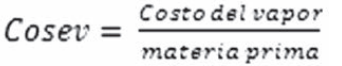 (12)
(12)CONCLUSIONS
-
The indicators for energetic-economic evaluation of each stage of tuna canning process in order to establish benchmarking, that serve as a reference for continuous improvement, were specific consumption and specific cost of steam.
-
The relevance of the indicators proposed was corroborated with their implementation in the company under study.
REFERENCES
AVADÍ, A.; BOLAÑOS, C.; SANDOVAL, I.; YCAZA, C.: “Life cycle assessment of Ecuadorian processed tuna”, The International Journal of Life Cycle Assessment, 20(10): 1415-1428, octubre de 2015, ISSN: 0948-3349, 1614-7502, DOI: 10.1007/s11367-015-0943-2.
AVADÍ, A.; FRÉON, P.: “Life cycle assessment of fisheries: A review for fisheries scientists and managers”, Fisheries Research, 143: 21-38, junio de 2013, ISSN: 0165-7836, DOI: 10.1016/j.fishres.2013.01.006.
DE LAS CUEVAS, M.H.R.; DÍAZ, Á.M.; PANEQUE, R.P.: “Software para el cálculo de indicadores energéticos, de explotación y económicos del sistema de distribución de humus de lombriz”, Revista Ciencias Técnicas Agropecuarias, 19(2): 65-70, junio de 2010, ISSN: 2071-0054.
FAO: State of world fisheries and aquaculture 2016 (spanish), [en línea], Ed. FAO, Rome, Italy, 213 p., 2016, ISBN: 978-92-5-309185-0, Disponible en: http://www.fao.org/3/a-i5555s.pdf, [Consulta: 1 de septiembre de 2016].
GARCÍA DE LA FIGAL, C.A.E.; VALDÉS, L.Y.; VARGAS, H.J.: “Evaluación de los gastos de explotación, económicos y energéticos en la labor de cultivo del frijol, tomate y papa comparando el tractor YUMZ-6M con yunta de bueyes”, Revista Ciencias Técnicas Agropecuarias, 21(3): 62-68, septiembre de 2012, ISSN: 2071-0054.
JIMÉNEZ, R.; MADRIGAL, J.A.; LAPIDO, M.J.; VIDAL, D.A.: “Método para la evaluación de la eficiencia e impacto ambiental de un generador de vapor”, Ingeniería Energética, 37(2): 135-143, agosto de 2016, ISSN: 1815-5901.
LEVENSPIEL, O.: Engineering Flow and Heat Exchange, [en línea], Ed. Springer, 3.. ed., 397 p., Google-Books-ID: f_CbBQAAQBAJ, 26 de noviembre de 2014, ISBN: 978-1-4899-7454-9, Disponible en: https://books.google.es/books?id=f_CbBQAAQBAJ, [Consulta: 1 de septiembre de 2016].
LINDBERG, C.-F.; TAN, S.; YAN, J.; STARFELT, F.: “Key Performance Indicators Improve Industrial Performance”, Energy Procedia, 75: 1785-1790, agosto de 2015, ISSN: 1876-6102, DOI: 10.1016/j.egypro.2015.07.474.
NIEUWLAAR, E.; ROES, A.L.; PATEL, M.K.: “Final Energy Requirements of Steam for Use in Environmental Life Cycle Assessment”, Journal of Industrial Ecology, 20(4): 828-836, 1 de agosto de 2016, ISSN: 1530-9290, DOI: 10.1111/jiec.12300.
PACHECO, B.J.L.: Aspectos Biológicos y Pesqueros de las Capturas de Atún Registrada por la Flota Atunera Cerquera Ecuatoriana Período 2000–2013, [en línea], Ed. Instituto Nacional de Pesca, Guayaquil, Ecuador, 13 p., 2013, Disponible en: http://www.institutopesca.gob.ec/wp-content/uploads/2014/08/1-Aspectos-Biol%C3%B3gicos-y-Pesqueros-de-las-Capturas-de-At%C3%BAn-Registradas-por-La-Flota-Atunera-Cerquera-2000-2013.pdf, [Consulta: 29 de mayo de 2017].
PEREIRA, C.A.; PÉREZ, A.; MARÍN, D.; GONZÁLEZ, O.: “ExploMaq, software para la evaluación energética y económica de la maquinaria agrícola”, Revista Ciencias Técnicas Agropecuarias, 24(1): 72-76, marzo de 2015, ISSN: 2071-0054.
SILVEIRA, J.L.; LAMAS, W. de Q.; TUNA, C.E.; VILLELA, I.A. de C.; MIRO, L.S.: “Ecological efficiency and thermoeconomic analysis of a cogeneration system at a hospital”, Renewable and Sustainable Energy Reviews, 16(5): 2894-2906, junio de 2012, ISSN: 1364-0321, DOI: 10.1016/j.rser.2012.02.007.
SPIRAX SARCO, INC.: Design of Fluid Systems. Steam utilization, [en línea], Ed. Spirax Sarco, Inc., Maryland, USA, 66 p., 2011, Disponible en: http://www.spiraxsarco.com/global/us/Training/Documents/Design_of_Fluid_Systems_Steam_Utilization.pdf, [Consulta: 30 de mayo de 2017].
TABOADA, M.C.; MAGÁN, A.; TORRES, R.; BELLO, P.M.: “Towards sustainable systems configurations: application to an existing fish and seafood canning industry”, Journal of Cleaner Production, 129: 374-383, 15 de agosto de 2016, ISSN: 0959-6526, DOI: 10.1016/j.jclepro.2016.04.047.
VEGA, P.L.E.; RODRÍGUEZ, G.L.E.: “Perdidas de presión en tuberías de vapor”, Ciencias Holguín, 13(3): 1–10, 2007, ISSN: 1027-2127.
ZUGARRAMURDI, A.; PARÍN, M.A.; LUPIN, H.M.: Ingeniería económica aplicada a la indústria pesquera, [en línea], ser. Documento Técnico de Pesca, no. ser. 351, Ed. FAO, Roma, Italia, 268 p., Google-Books-ID: Q_eoohQZ9PIC, 1999, ISBN: 978-92-5-303738-4, Disponible en: https://books.google.es/books?id=Q_eoohQZ9PIC, [Consulta: 30 de mayo de 2017].
Notes