ORIGINAL ARTICLE
Diesel engine emissions off road. Case Volskwagen ADG 1.9 L SDI
Emisiones de los motores diésel fuera de carretera. Caso Volskwagen ADG 1.9 L SDI
Diesel engine emissions off road. Case Volskwagen ADG 1.9 L SDI
Revista Ciencias Técnicas Agropecuarias, vol. 29, no. 2, 2020
Universidad Agraria de La Habana
Received: 28 November 2019
Accepted: 13 March 2020
ABSTRACT: Exhaust gas emissions tests of internal combustion engines and the permissible limit values for each component are standardized. This work shows the results of the tests carried out on the Volkswagen 1.9 SDI engine in the Armfield CM12 stationary test bench and the Launch X-431 pro scanner performed in the diesel engine laboratory of the Department of Agricultural Mechanical Engineering (DIMA) of Chapingo Autonomous University (UACh). The methodology of SAE J1995 and ISO 8178 Standards were used to obtain the values of HC, NOx, CO, CO2 and O2. In addition, the variation of lambda λ index was obtained. The characteristics of each component were constructed based on the load (power) and the lambda index. The concentrations were 30.25 g kW-1h-1 for HC + NOx and 0.47 g kW-1h-1 for CO which is below the established limits.
Keywords: engine tests, exhaust emissions.
RESUMEN: Las pruebas de emisiones de gases de escape de los motores de combustión interna se encuentran estandarizadas, así como los valores límites permisibles para cada componente. En el presente trabajo se muestran los resultados de las pruebas realizadas al motor Volkswagen 1.9 SDI en el banco de pruebas estacionario Armfield CM12 y el escáner Launch X-431 pro realizadas en el laboratorio de motores diésel del Departamento de Ingeniería Mecánica Agrícola (DIMA) de la Universidad Autónoma Chapingo (UACh). Se utilizó la metodología de las Normas SAE J1995 e ISO 8178 para obtener los valores de los componentes del escape. Se construyeron las características de cada componente en función de la carga (potencia) y del índice lambda. Las concentraciones de HC + NOx fueron de 30.25 g kW-1h-1 y del CO de 0.47 g kW-1 h-1 está por debajo de los límites establecidos.
Palabras clave: pruebas de motores, emisiones de escape.
INTRODUCTION
The unstoppable increase in the number of diesel engines in operation in the world contributes to the increasing deterioration of atmospheric air quality, to the point that the control of pollutant gases emissions they generate is a primary factor in the development of new designs.
Diesel engine exhaust gases consist of 99% of carbon dioxide (CO2), water vapor (H2O) and free nitrogen (N2), and a remaining 1% of solid and gaseous by-products that are harmful to the atmospheric air and living beings. They are grouped into compounds regulated by government regulations and unregulated compounds. Among the regulated compounds are solid carbon particles (soot) that are referred to as particulate material (PM) or diesel particulate material (DPM), carbon moNOxide (CO) nitrogen oxides (NOx), and unburned, or partially burned, hydrocarbons, which are expressed as total hydrocarbons (THC) or total hydrocarbons other than methane (NMHC). Unregulated compounds comprise polycyclic aromatic hydrocarbons (PAH), the soluble organic fraction (SOF) consisting of hydrocarbons adsorbed on the particulate material, aldehydes derived from fuel hydrocarbons, sulfur dioxide (SO2) that is formed with sulfur from fuel and lubrication oil that burns during combustion, nitrous oxide (N2O), and different metal oxides formed from the additives incorporated to the lubrication oil (González et al., 2015; Mantilla et al., 2015; Suarez et al., 2015; Lodice et al., 2016; Puente & Remache, 2017; Tipanluisa et al., 2017; Hernández et al., 2018; Pérez, 2018).
Currently, different methods are used to optimize the engine process in terms of polluting emissions, specific fuel consumption and combustion noise. Table 1 shows these methods (Bosch, 2014).
New fuel injection systems with electronic control have been introduced, such as injector unit systems (UIS), the pump unit system (UPS) and the common rail system with the aim of increasing the pressure and precision of fuel injection. The turbocharger of variable geometry (TGV) and the supercharger are fundamentally used for air supercharging in order to increase the density and, therefore, the amount of air entering the engine cylinders. Other post-treatment systems for exhaust gases are being introduced in order to reduce pollutant gases: oxidation catalysts for diesel engines (DOC), particulate filter (DPF), low NOx catalysts (LNC), traps NOx (LNT), selective reducing catalysts (SCR) and ammonia slip catalyst (ASC), among others (Bosch, 2014).
METHODS
The tests to obtain the engine parameters were carried out in the Diesel engine laboratory of the Department of Agricultural Mechanical Engineering, belonging to Chapingo Autonomous University. The test conditions were: atmospheric temperature of 297.15 K (24 °C), altitude of 2 250 m with atmospheric pressure of 78 kPa and relative humidity of 38%, obtained from Chapingo Meteorological Observatory (CEPRAE Universidad Autonoma Chapingo, 2019).
To perform the measurements of the parameters that allow the construction of the characteristic motor curves, the following equipment and instruments were used (Soca et al., 2019):
-
Volkswagen ADG SDI 1.9 L engine.
-
Armfield diesel CM12 engine test bench.
-
Launch X-431 pro scanner.
-
Computer with program to operate the test bench.
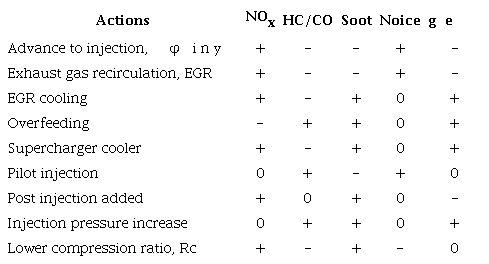
Symbols: +: reduction; -: increase; 0: no changes.
During the engine tests, the SAE J1995 standard was used, which establishes the methodology to obtain the engine parameters, when the air filter, the fan, the cooling system, the alternator and the exhaust pipe are disconnected, among others. To obtain the values of the exhaust emissions with the Launch X-431 pro scanner, the ISO 8178 standard was used. The stationary test referred in the Tier directives is the one designated as C1 in the standards ISO 8178-4:07: (2007) for off-road and industrial vehicles. Eight points are taken into account (see Table 2), each of which is defined by an engine speed and a certain load condition, together with a weighting factor to calculate the average value of escape gas emissions The engine runs at each point for at least 10 minutes and the emissions are determined over 3 minutes, but only those obtained in the last minute are counted.
To transform the values of the exhaust components obtained in the Launch X-431 pro equipment, expressed in parts per million (ppm) and percent (%) ag g∙kW-1h-1for analysis and comparison with the limit values established in the Tier and Stage legislation, the following methodology was used considering diesel fuel without sulfur (≤10 ppm of S) with a density of = 830 kg at 15 °C (Heseding & Daskalopoulos, 2006; Asociación Alemana de Fabricantes de Maquinaria (VDMA), 2011).
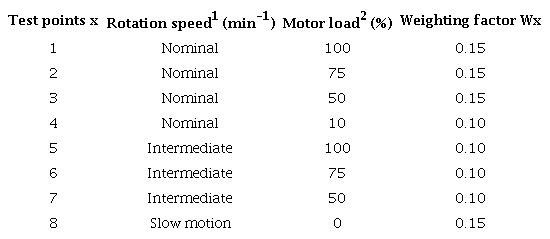
1 Nominal speed is that of the nominal motor power. Intermediate regime is the one that corresponds to the maximum torque of the engine if it is between 60% and 75% of the nominal. If the maximum torque is reached below 60% of the nominal regime, the intermediate regime corresponds to this percentage; and if it reaches above 75% of the nominal, the intermediate regime is the one corresponding to this percentage. 2 Refers to the torque expressed as a percentage of the maximum torque corresponding to each speed.
The following equations are used to convert these units (Heseding & Daskalopoulos, 2006; Asociación Alemana de Fabricantes de Maquinaria (VDMA), 2011):
Where:
- mass of the contaminant i, corresponding to the output power Ne, (g∙kW-1h-1).- value of exhaust emission on dry base of component i, volume (ppm).- value of exhaust emission on wet base of component i, volume (ppm).- molecular mass of component i, (g∙mol-1).- molecular mass of dry base exhaust gases, (g∙mol-1).- molecular mass of the wet base exhaust gases, (g∙mol-1).- dry mass exhaust flow (kg∙h-1).- wet mass exhaust flow, (kg∙h-1).- output power (effective) of the motor corresponding to the measuring point, (kW).- specific fuel consumption corresponding to the measurement point, (g∙kW-1h-1).The general conversion of the concentration of exhaust gases (ppm or%) to specific consumption (g∙kW-1h-1) for heavy vehicles is expressed as follows (Heseding & Daskalopoulos, 2006; Asociación Alemana de Fabricantes de Maquinaria (VDMA), 2011):
The EPA and EURO international standards for vehicle emissions for light and passenger vehicles are generally reported in g∙km-1. The following empirical equations are used for conversion (VDMA, 2011).
The average values obtained in g kW-1h-1 or g∙km-1 for each exhaust component i analyzed at the x points of the cycle test corresponding to mode C1 (with j = 8 total points) in Table 2, with their corresponding weighted Wx values for each point, are calculated using the following equation.
RESULTS
The variation of NOx nitrogen oxides as a function of the charge in the regulator zone is shown in Figure 1. It is observed that NOx concentrations are higher for lower speed regimes. This is due to the fact that in that area of work of the engine, the lower the turning speed, the better the combustion process. It is also observed that the higher the load for the same speed regime, the greater the concentration of NOx due to a greater amount of fuel injected.
The variation of oxygen concentration O2 as a function of the load for different engine rotation regimes is represented in Figure 2. It is observed that the higher the concentration of oxygen increases at a higher speed, while when the load increases the same speed regime, the concentration of this component decreases. The above is related to the air / fuel ratio, that is, the lambda λ index for each work regime.
The variation of the HC hydrocarbon content of the exhaust gases as a function of the power for different constant engine speeds in the regulation zone is shown in Figure 3. It is observed that for the same speed regime, as the power, the concentration of HC decreases and that for the same load (fuel supply) as the speed increases, the concentration of HC also increases. The above has as main factor the quality of the combustion process: as the speed increases, the duration of combustion (in each cycle) increases, because the phase of rapid combustion increases or at a constant volume. Also, at a lower load less fuel injected and lower HC content in the exhaust gases.

FIGURE 1
Variation of NOx content in the exhaust as a function of the load for different speed regimes (100, 75, 50 and 25%).

FIGURE 2
Variation of O2 content in the exhaust as a function of the load for different speed regimes (100, 75, 50 and 25%).
The variation of CO2 hydrocarbon content of the exhaust gases as a function of the power for different constant engine speeds in the regulation zone is shown in Figure 4. It is observed that at a lower speed regime for the same load, the concentration carbon dioxide increases; while for the same speed regime, the CO2 concentration increases with increasing load.

FIGURE 3
Variation of HC content in the exhaust as a function of the load for different speed regimes (100, 75, 50 and 25%).

FIGURE 4
Variation of CO2 content in the exhaust as a function of the load for different speed regimes (100, 75, 50 and 25%).
The concentrations of the exhaust gases analyzed as a function of the lambda λ index for two constant loads (100 and 75%) are shown in Figures 5 and 6. In these graphs, at constant loads, the concentrations of CO2, O2, HC and NOx vary depending on the lambda index and the corresponding rotation speeds. From λ≈2 to 5.8, the motor operates in the regulation zone (Figure 5).
It is observed that the poorest mixtures (highest lambda value) are obtained at the maximum speed and the least poor in the area near the maximum torque. The NOx and CO2 contents decrease while the mixtures are poorer, while those of O2 and HC increase.

FIGURE 5
Variation of the O2, CO2, HC and NOx contents in the exhaust as a function of the lambda index or air coefficient λ for 100% load.

FIGURE 6
Variation of the O2, CO2, HC and NOx contents in the exhaust as a function of the lambda index or air coefficient λ for 75% load.
Equations (2 - 5) are used to determine the value of each exhaust gas component defined by ISO 8178-4:07: (2007). Table 3 shows the average values obtained for each component in the regimes (points) established by mode C1. The weighted average value was determined by substituting the corresponding values from the table, applying equation (10).
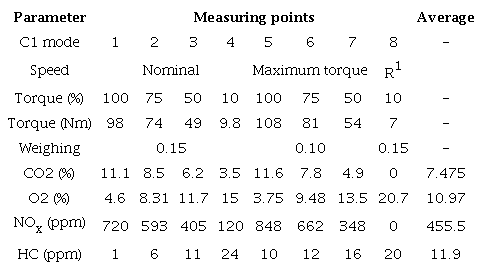
R1 - slow motion.
Substituting for their corresponding values from Table 3 in the equations:
When comparing these values obtained for this engine, under the test conditions, with the limit values established in the Stage standards it is concluded that the concentrations of HC + NOx limits of 4.7 g kW-1 h-1, are much lower than 30.25 g kW-1 h-1 obtained. The CO2 component is not regulated, although it is known to be an important GHG. The CO content = 0.47 g kW-1 h-1 is below the limit, characteristic for diesel engines that work with poor mixtures.
CONCLUSIONS
The following statements for the exhaust gases of a diesel engine are generalized from the analysis of the results obtained:
-
The NOx concentrations increase with the decrease in the speed of rotation of the engines because the conditions for a better-quality combustion improve. The NOx concentration increases with increasing engine load, keeping the engine speed constant, due to the greater amount of fuel injected.
-
The oxygen concentration O2 increases when the engine speed is increased while keeping the load constant because the combustion quality worsens. The O2 concentration decreases when the load grows for the same engine speed because the mixture formed is less poor (the lambda λ index decreases).
-
The concentration of HC decreases when the load increases keeping the speed regime constant, because the mixture will be less poor, the combustion speed increases and its quality. The concentration of HC hydrocarbons increases as the engine speed increases while maintaining the constant load, because the duration of combustion increases (in each cycle), because the phase of rapid or constant volume combustion increases and the combustion quality.
-
The CO2 concentration increases when the engine speed for the same load decreases, because the combustion process is shorter, and its quality improves. The concentration of CO2 increases when the load grows for the same speed regime, because more fuel is injected, the mixture is less poor, and the fuel is better burned.
-
In the working area of the engine as the torque increases, the concentrations of NOx and CO2 decrease, due to better combustion because the volumetric efficiency is increased. The opposite occurs in the regulation zone with the increase in the speed of rotation. The opposite happens with O2 and HC.
-
The values obtained from exhaust gas emissions do not meet the established limits of the current Stage, Tier, EPA or Euro standards, because the engine gas treatment system installed in the test bench does not meet current requirements.
REFERENCES
ASOCIACIÓN ALEMANA DE FABRICANTES DE MAQUINARIA (VDMA): Exhaust emission legislation Diesel and gas engines, Inst. Asociación Alemana de Fabricantes de Maquinaria (VDMA), Frankfurt am Main, Germany, 2011.
BOSCH: Diesel Engine Management. Systems and Components, Duale HochschuBaden-Württemberg Friedrichshafen, Ed. Springer, K. Rief ed., Germany, 2014, ISBN: 978-3-658-03980-6.
CEPRAE UNIVERSIDAD AUTÓNOMA CHAPINGO: Centro de Percepción Remota & Análisis Espacial, CEPRAE Universidad Autónoma Chapingo Km 38.5, [en línea], Inst. Universidad Autónoma Chapingo, Texcoco, Chapingo CP 56230 Edo. México, 2019, Disponible en: ldiakited@taurus.chapingo.mx.
GONZÁLEZ, M.J.M.; ALVARADO, D.A. l; URUEÑA, C.H.G.: “Multivariate analysis of performance and emissions for internal combustion engines running with gasoline-ethanol blends”, Ingeniería Energética, 36(3): 232-242, 2015, ISSN: 1815-5901.
HERNÁNDEZ, A.H.D.; MATEO, A.D.; JIMÉNEZ, C.G.; MANTILLA, J.M.: “Comparación de las emisiones en motores que utilizan combustible e0 y e10 en régimen transitorio”, Ingeniería Energética, 39(1): 3-12, 2018, ISSN: 1815-5901.
HESEDING, M.; DASKALOPOULOS, P.: “Exhaust emission legislation-diesel-and gas engines”, VDMA, Frankfurt am Main, 2006.
ISO 8178-4:07: Reciprocating internal combustion engines - Exhaust emission measurement. Part 4 - Steady - state test cicles for different engines applications, Vig de 2007.
LODICE, P.; SENATORE, A.; LANGELLA, G.; AMORESANO, A.: “Effect of ethanol-gasoline blends on CO and HC emissions in last generation SI engines within the cold-start transient: An experimental investigation”, Applied energy, 179: 182-190, 2016, ISSN: 0306-2619.
MANTILLA, G.J.M.; GARZÓN, R.J.; GALEANO, U.C.H.: “Desempeño y emisiones de un motor de combustión interna con combustible dual Diesel-Gas natural”, Ingeniería Energética, 36(1): 27-37, 2015, ISSN: 1815-5901.
PÉREZ, D.D.G.: “Estudio de emisiones contaminantes utilizando combustibles locales”, INNOVA Research Journal, : 23-34, 2018, ISSN: 2477-9024.
PUENTE, E.; REMACHE, A.: “Análisis de las curvas características y la opacidad de un motor JO5ETC16173 con la implementación de un turbocargador”, INNOVA Research Journal, 2(10.1): 97-108, 2017, ISSN: 2477-9024.
SOCA, C.J.R.; CHAVARRÍA, I.S.; MARTÍNEZ, R.M.: “Curvas características de velocidad y carga del motor Volkswagen 1.9 SDi”, Revista Ciencias Técnicas Agropecuarias, 28(2): 88-100, 2019, ISSN: 1010-2760, e-ISSN: 2071-0054.
SUAREZ, B.R.; ZARDINI, A.; KEUKEN, H.; ASTORGA, C.: “Impact of ethanol containing gasoline blends on emissions from a flex-fuel vehicle tested over the Worldwide Harmonized Light duty Test Cycle (WLTC)”, Fuel, 143: 173-182, 2015, ISSN: 0016-2361.
TIPANLUISA, L.E.; REMACHE, A.P.; AYABACA, C.R.; REINA, S.W.: “Emisiones Contaminantes de un Motor de Gasolina Funcionando a dos Cotas con Combustibles de dos Calidades”, Información tecnológica, 28(1): 03-12, 2017, ISSN: 0718-0764.
Notes
Author notes
Author for correspondence: José Ramón Soca-Cabrera, e-mail: jsoca@yahoo.com
Conflict of interest declaration