Engenharia Agrícola

This work is licensed under Creative Commons Attribution-NonCommercial-NoDerivs 3.0 International.
Received: 27 July 2015
Accepted: 05 February 2016
Abstract: The use of energy contained in biogas is an interesting alternative to reconcile renewable electric power generation to environmental sanitation. Among the technologies used for recovering energy from biomass, the anaerobic digestion demonstrates ability to treat solid waste and effluents. This research work aims to analyze the influence of physical and chemical factors on the performance of anaerobic digestion reactors and to perform the characterization of biogas in order to assess their quality. The substrate evaluated is the mixture of liquid waste coming from different industrial processes and poultry manure. The characterization of CH4, CO2, H2S and O2 was performed daily in two reactors, R1 and R2, for a period of three months, and the physical and chemical parameters were analyzed biweekly. The parameters analyzed are carbon (C), nitrogen (N), biochemical oxygen demand (BOD), pH, total (TS), volatiles (VS) and fixed solids (FS). Among the results, stands out an average removal of 76% in relation to BOD and H2S concentration of 156.01 for R1, and of 91.64 ppm for R2, and the CH4:CO2 inverse relationship of 3.15 for R1 and 2.98 for R2, during the monitoring period.
Keywords: renewable energy, waste, gases, sludge, poultry manure.
Resumo: O uso da energia contida no biogás é uma alternativa interessante para conciliar a geração de energia elétrica renovável ao saneamento ambiental. Entre as tecnologias utilizadas para a recuperação de energia, a partir de biomassa, a digestão anaeróbia demonstra a capacidade de tratamento dos resíduos sólidos e efluentes. Este trabalho de pesquisa tem como objetivo analisar a influência de fatores físico-químicos sobre o desempenho de reatores anaeróbios e realizar a caracterização do biogás, a fim de avaliar a sua qualidade. O substrato avaliado é uma mistura de resíduos líquidos provenientes de diferentes processos industriais e dejetos gerados por aves poedeiras. A caracterização dos gases CH4, CO2, H2S e O2 foi realizada diariamente em dois reatores (R1 e R2) por um período de três meses, e os parâmetros físico-químicos foram analisados quinzenalmente. Os parâmetros físico-químicos analisados foram carbono (C), nitrogênio (N), demanda bioquímica de oxigênio (DBO), pH, sólidos totais (ST), voláteis (VS) e fixos (FS). Entre os resultados destacam-se a remoção média de 76% em relação a DBO, concentração de H2S de 156.01 para o R1 e de 91,64 ppm para o R2 e relação inversa entre CH4:CO2, sendo esta de 3,15 para R1 e 2,98 para R2.
Palavras-chave: energia renovável, resíduos, gases, lodos, dejeto de aves poedeiras.
Introduction
Until recently, biogas was considered simply as a by-product obtained from the anaerobic decomposition of animal waste and sludge from treatment plants of domestic wastewater. However, the accelerated economic development in recent years and the increase in prices of conventional fuels have encouraged researches into the energy production from alternative and economically attractive sources (Goldemberg & Paletta, 2012).
The sources for the biogas generation cover various raw materials types, such as wastes from households and agriculture, sewage sludge and
wastewater (Kapdi, Vijay, Rajesh, & Prasad, 2005). In the composition of biogas, methane (CH4) has an aggression potential to the environment around 20 times that of carbon dioxide (CO2), being then characterized as the main responsible for the increase in the concentration of greenhouse gases (Sanquetta, Balbinot, & Ziliotto, 2004).
The CH4 produced by degradation of organic matter could be channeled and burned in power generators engines, in order to minimize environmental impacts, and enhance the biogas. The advantages of the use of biogas can be considered in the electric power generation as well as being a possible solution in the treatment of waste.
Biogas is a colorless, odorless and highly flammable gas that produces no soot and, therefore, has atmospheric pollution potential lower than that of the butane present in the cooking gas (Oliveira & Higarashi, 2006). Biogas is composed by different gases such as CH4 (60-70%), CO2 (30-40%), N2 (< 1%) and H2 (10-2000 ppm). CH4 represents the calorific power value contained in the gas equal to 37781.6 kJ m-3 and power generation capacity of 5 kW hour m-3 (Torres & Osorio, 2009).
Biogas can be used in its original composition, but depending on the application, it is necessary to remove CO2 and sulphidric acid (H2S), as humidity and high pressure (Dìaz, Ramos and Polanco, 2015). H2S is responsible for toxicity and corrosion in most devices, when concentrations exceed 50 ppm. The toxicity affects human health, causing headaches, nausea and eye irritation, and, in addition, the combustion of this gas generates emissions of sulfur dioxide (SO2), with negative environmental effects (Busca & Pistarino, 2003; Greenpro, 2004). Currently, there are various methods of treating for effluent gases, which may be used to minimize these emissions (Pagliuoso & Regattieri, 2008).
All production of biogas from the anaerobic degradation using the upflow anaerobic sludge blanket (UASB) technology is enough to sanitize the entire sludge production from a wastewater treatment plant (WWTP). The pathogenic microorganisms found in the sludge, when not disposed of properly, can be harmful to public health (Borges & Chernicharo, 2009). In this context, it was considered the use of the energy contained in biogas as an interesting alternative to reconcile renewable electricity generation to environmental sanitation.
Among the technologies used for energy recovery from biomass, anaerobic digestion has been used in many applications, demonstrating ability to treat solid waste and effluents, also allowing nutrient recycling and energy recovery (Metcalf & Eddy Inc., 2003; Alvaréz & Lidén, 2008). This process occurs through distinct stages, and the initial stage of the degradation is the hydrolysis. During the hydrolysis, there is the transformation of polymers (starch, proteins, and carbohydrates) into monomers, such as amino acids and sugars, by enzymes produced by bacteria. These monomers, in the acidogenic phase, are transformed into volatile fatty acids (VFA) such as butyric, valeric and propionic acids. In the acetogenic stage, these volatile fatty acids are converted into acetic acid, carbon dioxide and gaseous hydrogen, which produce methane by cleavage of acetic acid (acetoclastic methanogenic) and from the reduction of carbon dioxide to molecular hydrogen (hydrogenotrophic methanogens) (Parker, 2005).
It is important to learn about the characteristics and the quantity of biogas produced, since this allows the identification of the constituent gases of biogas in order to optimize the further use of biogas for energy purposes.
The aim of this study was to analyze the physical and chemical factors on the performance of anaerobic digestion of the ‘blend’, a mix between WWTP sludge and poultry manure, and, further, to perform the characterization of the biogas in order to evaluate its quality.
Regarding the egg poultry manure, these materials are constituted by complex substrates containing particulate and dissolved organic matter as, for example, polysaccharides, lipids, proteins, volatile fatty acids, a high number of inorganic components and high concentrations of pathogenic organisms (Steil, Lucas Junior, & Oliveira, 2002). In a study performed by Minho et al. (2012), the authors evaluated the potential of biogas generation of this slurry mixed with sludge from wastewater treatment (WWTP) and obtained, at the end of 28 days, about 60% of CH4. Atuanya and Aigbirior (2002) evaluated the feasibility of the UASB reactor for wastewater treatment from poultry and obtained an average content of CH4 of 57%, whereas in the study of Kalyuzhnyi, Fedorovich, and Nozhevnikova (1998) the CH4 concentration was about 80%.
Material and methods
The reading of gases and collection of material were performed in a biogas plant located in the metropolitan area of Porto Alegre, State of Rio Grande do Sul, Brazil. The blend samples were sent to the Laboratory of Bioreactors at the University Center Univates for physical and chemical analysis.
Initially the blend is produced, a mixture of liquid waste arising from various industrial processes and wastes from poultry manure. The blend is conducted to a container in order to achieve a minimum of 8% of total solids (TS). It is subsequently sieved to eliminate materials that may compromise the subsequent stages of the process, and then led through a pipe to three storage tanks, with capacity of 15 m³ each.
At the considered biogas plant, the feeding is performed through a continuous stream comprising a storage tank, a piston flow type reactor (R1) with 450, and a vertical upflow reactor (R2) with 900 m3 (Figure 1), plus two gasometers with 1,000 and 1,200 m³ and a reservoir at the end of the process which is intended to the biofertilizer. For the pumping of the input material to the first reactor (R1) there is a timer system that sends blend parcels every 10 min, operating a total of 40 m3 day-1 in both R1 and R2 reactors.
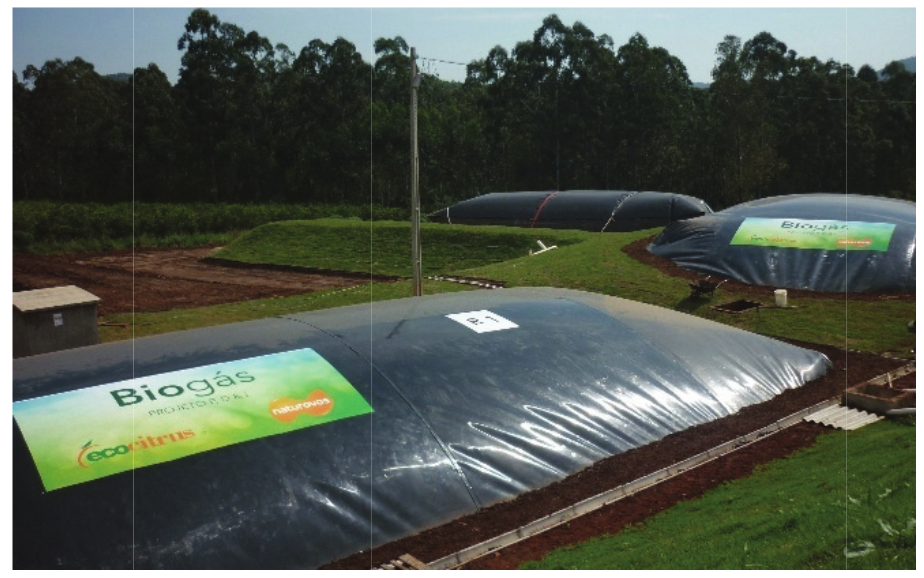
Figure 1
The reactors: on the left is the plug flow reactor R1 (PFR) with 450 m3; and on the right is the vertical upflow reactor R2 (VUR) with 900 m3
The total hydraulic retention time is 30 days (R1: 10 days and R2: 20 days). R1 has agitation system divided into three zones (surface, middle and bottom) and R2 suffers agitation only when matter is supplied to it. Both are kept at 36°C through a piping system with heat generated from the combustion of surplus biogas.
The characterization of gases was performed daily in both reactors (R1 and R2) for a period of three months, using a gas analyzer Oriun Plus®, manufactured by MSA AER GmBH Company, which determined the percentage of CH4, CO2, H2S and O2 present in the biogas.
The collection points in the biogas plant are outlined in Figure 2, where R1 is the Reactor 1 and R2 is the Reactor 2. The sampling points are 1 (at the input of R1), 2 (between the output of R1 and the input of R2) and 3 (at the output of R2). The symbols: a*, b* and c* indicate the effectiveness of treatment demonstrated by the removal of the organic load, wherein: a* is the value for the analysis of the sample at the R1 input (1) in relation to the R2 input (2), b* is this value for analysis at the R2 output (3) in relation to the input (2), and c* is the value for the analysis of the sample at the R1 input (1) in relation to R2 output (3).
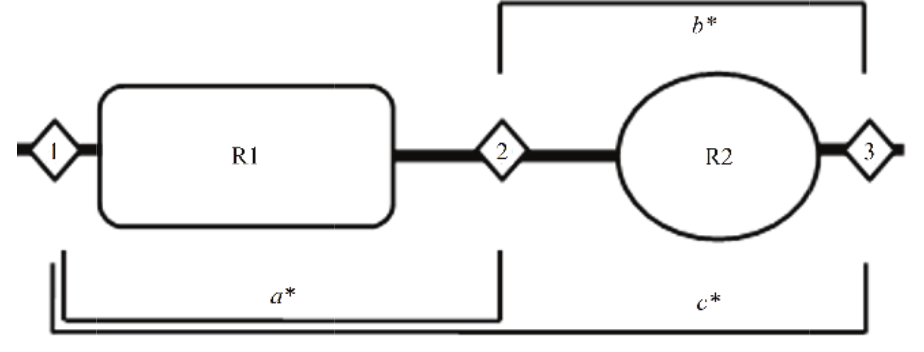
Figure 2
Process flow diagram with the collection points at the biogas plant
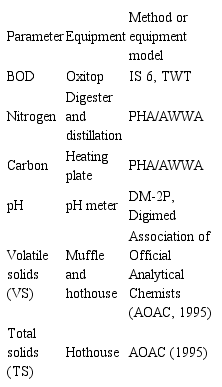
The physical-chemical parameters analyzed were: carbon (C), nitrogen (N), biochemical oxygen demand (BOD), pH, total (TS), volatile (VS) and fixed solids (FS). Samples were collected biweekly at three points: the input of material (point 1) and the outputs of the reactors R1 (point 2) and R2 (point 3). The equipment and method used for each parameter is presented in Table 1.
List of parameters and their methods or models of equipment
Results and discussion
Physical and chemical analyses
Table 2 presents the values given as average and standard deviation (SD) of BOD, C, N, C:N, FS, TS, VS and pH values of the sample points: 1 , 2, 3. The values of the removal for BOD and reductions of C, N, C:N, FS, TS, VS in a*, b* and c* are also shown in this table.
Average and standard deviation for the analyzed physical and chemical parameters
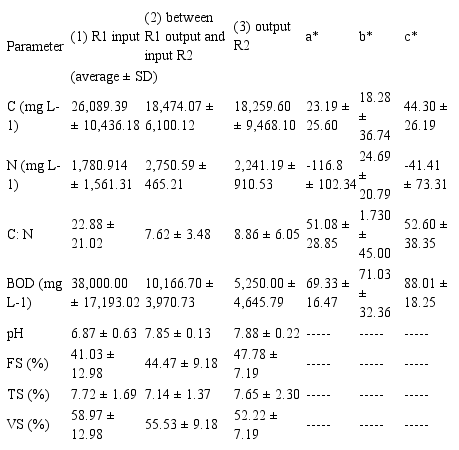
The average removal of samples BODa*, BODb* and BODc* were 69.34, 71.03 and 88.01% respectively. It was also obtained a BODc* removal with efficiency equal to 98% at the end of the process (point 3) in a punctual analysis. The favorable removal obtained from sludge purification is due to R2, which is a reactor of upward flow type. However, it can be seen that R1 has achieved a considerable percentage of removal too. Analyzing the complete system, it was visualized a BOD removal efficiency that was even more satisfactory. In the study performed by Campos, Mochizuki, Damasceno, and Botelho (2005) about the treatment of wastewater from pig manure using the same type of reactor, the efficiency of this parameter was of 75%.
The effluent from the input (point 1) presented a concentration of 26,089.39 ± 10,436.18 mg L-1 of C and 1,780.91 ± 1,561.31 mg L-1 of N. The reduction obtained in Ca* was of 23.19 ± 25.60%, showing that in some analyzes it was obtained an increase of carbon, as well as in Cc*, which presented 18.28 ± 36.74% of reduction. The best carbon reduction was obtained at the end of the process Cb* (44.30 ± 26.19%). Concerning nitrogen, there was a better reduction in the second sampling point, after treatment in R1, with value of 24.69 ± 20.79. Subsequently there was an increase for this parameter in the middle.
The concentrations of carbon and nitrogen determine the performance of the anaerobic digestion process. The carbon is the source of energy for microorganisms and nitrogen stimulates microbial growth; therefore, so the process has optimum operation, the C: N should be 30: 1 (Igoni, Ayotamuno, Eze, Ogaji, & Probert, 2008). The C: N ratio of the sampling points 1, 2 and 3 were 22.88:1 ± 21.01:1; 7.62:1 ± 3,48:1 and 8.86: 1 ± 6.05:1; respectively. There was a normal process of anaerobic degradation, with initial and final values for C: N ratio close to optimum value. The C: N ratio was higher at point 3; we infer that the increase of carbon in the medium may have favored the microbial inhibition, reducing the ability of degradation of organic matter (Sgorlon, Rizk, Bergamasco, & Tavares, 2011). The input material presented C:N ratio in the range recommended Luna, Leite, Lopes, Silva, and Silva (2008), between 20: 1 and 30: 1, which is favorable to the biostabilization process. A satisfactory C: N ratio was also obtained at the end of the process, in accordance with Rao and Singh (2004), who explain that the C: N ratio of the stabilized waste varies between 10: 1 and 13: 1.
The average values of TS in the samples 2 and 3 were 7.14 and 7.65%, respectively. The input material contained about 7.72% of TS, which exceeded the level of 5% obtained by Felizola, Leite, and Prasad (2006) in the anaerobic treatment of organic waste.
The content of the VS of the sample points 1, 2 and 3 were 58.97, 55.53 and 52.22%, respectively. The higher the concentration of volatile solids in the daily diet of the digester (m3 kg-1), the higher will be the biogas generation (Oliveira & Otsubo, 2002).
The FS at the sampling points 1, 2 and 3 were equal to 41.03, 44.47 and 47.78%, respectively. These values were consistent with a process of anaerobic degradation where an increasing trend of FS occurs over the time by volatilization of a portion of the total solids, which is in agreement with Nielsen (2011), who describes the increase that occurs on the fixed solids concentration with the passage of time due to the buildup of deposits and recalcitrant compounds in the system.
The average pH of the sample point 1 was 6.87 ± 0.63, whereas for the sample point 2 it was 7.85 ± 0.13 and, for the sample point 3, 7.88 ± 0.22. Even though there have been no significant changes in pH, this increase is associated with the buffering effect provided by biostabilization process of organic solid waste (Bouallagui, Cheikh, Marouani, & Hamdi, 2003). According to Gerardi (2003), at pH values between 6.8 and 7.2, methanogenic bacteria present a better performance, occurring the converting from volatile acids into CH4 and CO2. The autor Gerardi (2003) explains that the pH of an anaerobic system is significantly affected by the presence of CO2 in the biogas and pH values from below 6 to above 8 limit the methanogenic activity by presenting a toxic environment.
Characterization of the biogas
The average values and standard deviation of CH4, CO2, H2S and O2 present in R1 and R2 are shown in Table 3.
Average values and standard deviations for the parameters of the gases present in reactors 1 and 2
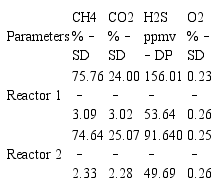
During the three months of monitoring, it was observed that the percentage of CH4 in R1 was higher than the percentage of this gas in R2, which may be explained by a higher concentration of volatile fatty acids in R1, also confirmed by Felizola et al. (2006).
The percentage of CH4 and CO2 in R1 was of 75.76 and 24%; in R2 this percentage was of 74.64 and 25.07%, respectively. These values are similar to those obtained by Balde et al. (2016) the balance of CH4:CO2 in the digestate storage was 74:26% by volume, which is similar to the 66% CH4 content in the biogas produced in the digester.
The energy potential of biogas varies depending on the presence of CH4 in its composition. Its quality for energy uses is directly proportional to the amount of methane it has. Regarding the inferior calorific power value (ICP) of the biogas, this depends on the ratio between CO2 and CH4 and, when the CH4 concentration is high, the calorific power will have a high value too (Lima, 2005). According to Lima (2005), biogas with an ICP between 4,300 and 6,850 kcal kg-1 is a very good primary source of energy. As mentioned by Leonzio (2016), biogas is composed approximately of 55-70% of CH4 and 30-45% of CO2, has the ICP equal to 6,253 kcal kg-1. Based on this, the biogas generated in this study fits in these recommended values, showing that the considered biogas plant has satisfactory energy potential and renewable purposes.
The average values of H2S ranged from 156.01 in R1 to 91.64 ppmv in R2. Considering the minimum and maximum values obtained in the present study, it can be stressed that they are in accordance with Nghiem, Manassa, Dawson and Fitzgerald (2014).
The amounts of O2 in both reactors were very similar, resulting in an average of 0.23 in R1 and 0.25% in R2. It is important to note that the O2 concentration was above 1% in both readings in R1 and in one reading in R2 during the first month of monitoring. High levels of O2 in the biogas present risk of explosion inside the digester. Such situation can arise at the beginning of the operation, due to the input of the first charge of organic matter (Prati, 2010).
Table 4 depicts the Pearson correlation for the values of the main gases that constitute the biogas. In R1 there was only a significant positive correlation between the production CH4 and H2S CO2 presented a significant negative correlation with H2S and CH4 In R2, the percentage of CH4 was inversely proportional to the volume of CO2, presenting a significant negative correlation between both.
CH4 and CO2 generation data can be observed in the graphical representation of Figure 3, which shows the percentage of CH4 and its inverse proportion to CO2 production in both reactors. The relative proportions in which CO2 and CH4 are produced from the original organic matter depend on the presence of sufficient inorganic oxidants, as nitrate, Mn, Fe or sulfate, which generate competition for organic matter to produce CO2 or CH4 (Yao & Conrad, 2000; Krüger, Frenzel, & Conrad, 2001).
Indexes of the Pearson correlation (r2%) and the difference (p < 0.05) of the constituent parameters of biogas between them even in reactors 1 and 2 (R1 and R2)
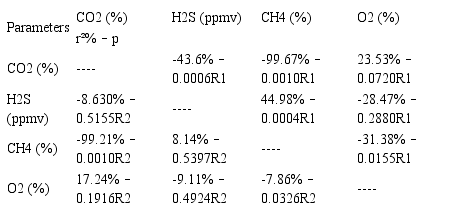
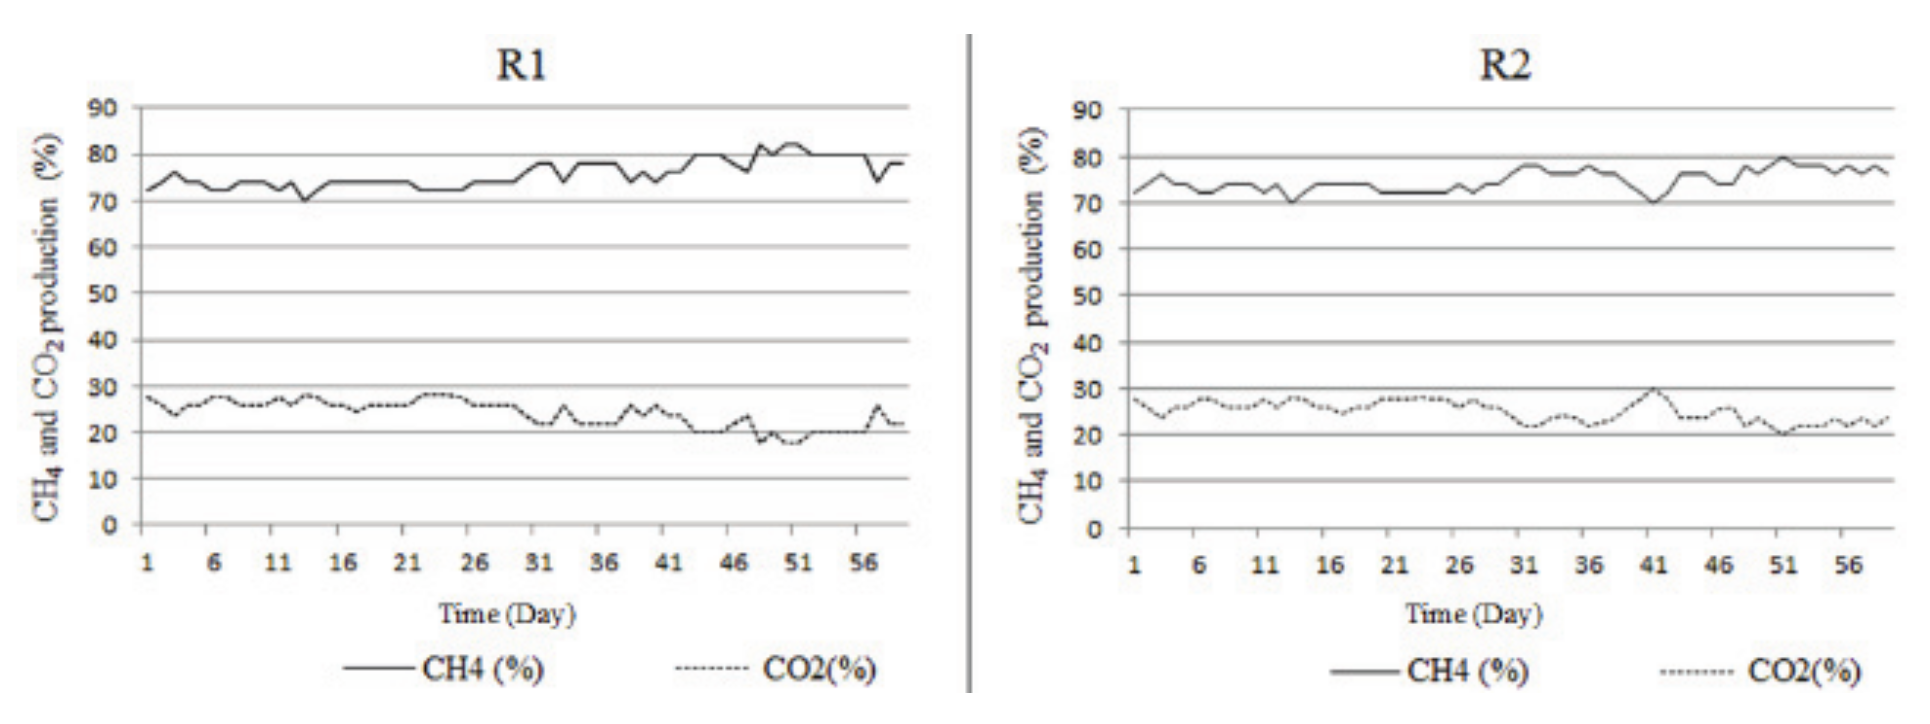
Figure 3
CH4 and CO2 production in reactors R1 and R2
Luque and Balu (2013), when the ratio between CH4 and CO2 reaches an average value of 1.5, the anaerobic treatment process reaches a steady state, that is, conditions under which the biogas produced by the process of anaerobic biostabilization of the organic matter contains, in average, 60 of CH4 and 40% of CO2. In this study, the biogas produced in R1 provided a CH4:CO2 ratio equal to 3.15, and equal to 2.98 in R2. The biogas obtained was mainly formed by two gases, CH4 and CO2, presenting an inversely proportional concentration of one over the other and still leaving traces of other gases characterized in this study (H2S and O2).
Conclusion
This research demonstrated that the blends of agro-industrial wastes treated in the studied biogas plant has a significant energy potential, presenting average values for the concentration of methane in the generated biogas of about 75%. The flow of waste from agro-industrial activities can present environmental and health hazard; however, by converting this waste into energy, the health and environment problems are solved, while the energy generated contributes to the sustainable development of society.
The generation of CH4 is inversely proportional to CO2 generation. During the monitoring period, the CH4: CO2 ratio was of 3.15 for R1 and 2.98 for R2. Other parameters were assessed from the generated biogas. Concentration of O2 presented values of 0.23 for R1 and 0.25 for R2, while for H2S, the values were equal to 156.01 in R1 and 91.64 ppmv in R2.
Concerning the evaluations of physical and chemical parameters, results obtained for the removal of BOD were satisfactory, presenting values of 69.34, 71.03 and 88.01% of removal in the analyzed sample points, whereas for the other parameters (C, N, pH, TS, FS and VS), the obtained values were consistent with the anaerobic degradation. The C: N ratio in the sampling points was equal to 22.88:1, 7.62:1 and 8.86:1, while the best reductions of C and N were found in the sampling points 2 and 3, with a reduction of 44.30 and 24.69%, respectively. The values of pH varied between 6.87 and 7.88, and the content of TS, VS and FS ranged from 7.14 to 7.72%, 52.22 to 58.97% and 41.03 to 47.78%, respectively.
Acknowledgements
The authors thank the University Center Univates, CNPq (National Council for Scientific and Technological Development of Brazil), Fapergs (Foundation for Support to Research of the State of Rio Grande do Sul), and the companies Naturovos and Ecocitrus for supporting the implementation of this research work.
References
Alvaréz, R., & Lidén, G. (2008). Semi-continuos co-digestion of solid slaughterhouse waste manure, and fruit and vegetable waste. Renewable Energy, 33(4), 726-734.
AOAC International. (1995). Official methods of analysis of AOAC International (16th ed., 2 vols). Arlington, VA: Association of Analytical Communities.
Atuanya, E. I., & Aigbirior, M. (2002). Mesophilic biomethanation and treatment of poultry wastewater using pilot scale UASB reactor. Environmental Monitoring and Assessment, 77(2), 139-147.
Baldé, H., Vanderzaag, A. C., Burtt, S. D., Wagner-riddle, C., Crolla, A., Desjardins, R. L., & Macdonald, D. J. (2016). Methane emissions from digestate at an agricultural biogas plant. Bioresource Technology, 216(9), 914–922.
Borges, E. S. M., & Chernicharo, C. A. L. (2009). Efeito do tratamento térmico de lodo anaeróbio sobre as características de biodegradabilidade da fração orgânica. Engenharia Sanitária e Ambiental, 14(4),
Bouallagui, H., Ben Cheikh, R., Marouani, L. E., & Hamdi, M. (2003). Mesophilic biogas production from fruit and vegetable waste in a tubular digester. Bioresource Technology, 86(1), 85-89.
Busca, G., & Pistarino, C. (2003). Technologies for the abatement of sulphide compounds from gaseous streams: a comparative overview. Journal of Loss Prevention in the Process Industries, 16(5), 363-371.
Campos, C. M. M., Mochizuki, E. T., Damasceno, L. H. S., & Botelho, C. G. (2005). Avaliação do potencial de produção de biogás e da eficiência de tratamento do reator anaeróbio de manta de lodo (UASB) alimentado com dejetos de suínos. Ciência e Agrotecnologia, 29(4), 848-856.
Díaz, I., Ramos, I., & Polanco, M. (2015). Economic analysis of microaerobic removal of H2S from biogas in full-scale sludge digesters. Bioresource Technology, 192, 280-286.
Felizola, C. S., Leite, V. D., & Prasad, S. (2006). Estudo do processo de digestão anaeróbia de resíduos. Agropecuária Técnica, 27(1), 132-187.
Gerardi, M. H. (2003). The microbiology of anaerobic digesters. New Jersey, NJ: John Wiley & Sons.
Goldemberg, J., & Paletta, F. C. (2012). Energias renováveis. São Paulo, SP: Edgar Blucher.
Greenpro. (2004). Manual sobre tecnologias, projeto e instalação. Retrieved from http://www.greenpro.de/po/bioenergia.pdf
Igoni, A. H., Ayotamuno, M. J., Eze, C. L., Ogaji, S., & Probert, S. D. (2008). Designs of anaerobic digesters for producing biogas from municipal solid-waste. Applied Energy, 85(6), 430-438.
Kalyuzhnyi, S., Fedorovich, V., & Nozhevnikova, A. (1998). Anaerobic treatment of liquid fraction of hen manure in UASB reactors. Bioresource Technology, 65(3), 221-225.
Kapdi, S. S., Vijay, V. K., Rajesh, S. K., & Prasad, R. (2005). Biogas scrubbing, compression and storage: perspective and prospectus in Indian context. Renewable Energy, 30(8), 1195-1202.
Krüger, M., Frenzel, P., & Conrad, R. (2001). Microbial processes influencing methane emission from rice fields. Global Change Biology, 7(1), 49-63.
Leonzio, G. (2016). Upgrading of biogas to bio-methane with chemical absorption process: simulation and environmental impact. Journal of Cleaner Production, 131(10 ), 364-375
Luque, R., & Balu, A. M. (Ed.). (2013). Producing fuels and fine chemicals from biomass using nanomaterials. Boca Raton, FL: CRC Press.
Lima, F. P. (2005). Energia no tratamento de esgoto: análise tecnológica e institucional para conservação de energia e uso do biogás. São Paulo, SP: USP.
Luna, M. L. D., Leite, V. D. L., Lopes, W. S., Silva, A. S., & Silva, J. V. N. (2008). Tratamento anaeróbio de resíduos sólidos orgânicos para pequenas comunidades. Agropecuária Técnica, 29(1-2), 21-34.
Metcalf & Eddy Inc. (2003). Wastewater engineering treatment disposal reuse (4th ed.). New York City, NK: McGraw - Hill Book.
Minho, C. V., Konrad, O., Koch, F. F., Kleinschmitt, A. B., Casaril, C., & Lumi, M. (2012). Uso da glicerina residual na geração de biogás a partir do lodo de estação de tratamento de efluentes e dejetos de aves poedeiras. Engenharia Ambiental - Espírito Santo do Pinhal, 9(3), 41-50.
Nghiem, L., Manassa, P., Dawson, M., & Fitzgerald, S. K. (2014). Oxidation reduction potential as a parameter to regulate micro-oxygen injection into anaerobic digester for reducing hydrogen sulphide concentration in biogas. Bioresource Technology, 173, 443-447.
Nielsen, S. (2011). Sludge treatment reed bed facilities – organic load and operation problems. Water Science Technology, 63(5), 942-948.
Oliveira, P. A. V., & Higarashi, M. M. (2006). Geração e utilização de biogás em unidades de produção de suínos. Concórdia, SC: Embrapa Suínos e Aves.
Oliveira, P. A. V., & Otsubo, C. S. (2002). Sistema simples para a produção de biogás com o uso de resíduos de suínos e aves. Gerenciamento Ambiental, 4(19), 12-15.
Pagliuso, J. D., & Regattieri, R. C. (2008). Estudo do aproveitamento da energia do biogás proveniente da incineração do chorume para a geração de eletricidade. Revista Brasileira de Ciências Ambientais, 16, 32-38.
Parker, W. J. (2005). Application of the ADM1 model to advanced anaerobic digestion. Bioresource Technology, 96(16), 1832-1842.
Prati, L. (2010). Geração de energia elétrica a partir de biogás gerado por biodigestores (TCC). Universidade Federal do Paraná, Curitiba.
Rao, M. S., & Singh, S. P. (2004). Bioenergy conversion studies of organic fraction of MSW: kinetic studies and gas yield–organic loading relationships for process optimization. Bioresource Technology, 95(2), 173-185.
Sanquetta, C. R., Balbinot, R., & Ziliotto, M. A. B. (2004). Fixação de carbono: atualidades, projetos e pesquisas. Curitiba, PR: AM Impressos.
Sgorlon, J. G., Rizk, M. C., Bergamasco, R., & Tavares, C. R. G. (2011). Avaliação da DQO e da relação C/N obtidas no tratamento anaeróbio de resíduos fruti-hortículas. Acta Scientiarum Technology, 33(4), 421-424.
Steil, L., Lucas Junior, J., & Oliveira, R. A. (2002). Avaliação do uso de inóculo na digestão anaeróbia de resíduos de aves de postura, frangos de corte e suínos. Engenharia Agrícola, 22(2), 146-149.
Torres, J. C., & Osorio, F. (2009). Biogas purification from anaerobic digestion in a wastewater treatment plant for biofuel production. Renewable Energy, 34(10), 2164-2171.
Yao, H., & Conrad, R. (2000). Electron balance during steady-state production de CH4 and CO2 in anoxic rice soil. European Journal Soil Science, 51(3), 369-378.
Author notes
okonrad@univates.br
