Statistics

Esta obra está bajo una Licencia Creative Commons Atribución 4.0 Internacional.
Recepción: 30 Agosto 2018
Aprobación: 17 Julio 2019
DOI: https://doi.org/10.4025/actascitechnol.v42i1.44378
Abstract: This work uses non-hierarchical grouping methods to evaluate the quality of the groups formed by plate cisterns according to some water quality variables. These methods use the cluster validation criterion to determine the optimal partition, which provides the most homogeneous groups possible. The methods were tested on a sample of 100 cisterns located in the Pajeú region. However, the non-hierarchical clustering method of ‘K-medoid’ formed more homogeneous groups, and thus the best performance according to the Silhouette [s (i) = 0.64] statistics.
Keywords: water, groups, silhouette statistics.
Introduction
The question heere is to verify if a cluster analysis that used water quality variables is able to classify cisterns of plaques according to these variables. The term clustering analysis encompasses a number of algorithms and methods for grouping objects, so that the degree of similarity of two objects or cisterns is maximal if they belong to the same group and minimum if they belong to different groups. Two non-hierarchical grouping methods were used in this study in a sample of water from plate cisterns in the municipality of Serra Talhada in the Pajeu, Pernambucano Region (Oliveira, Cruz, & Cunha Filho, 2016). This region, like the other semi-arid regions of the world, recorded great periods of drought (Cherwin & Knapp, 2012), culminating in a lack of good quality water and water for human consumption (Cruz, Oliveira, Cruz, & Cunha Filho, 2016).
Two issues of fundamental importance can be addressed in clustering analysis which is to estimate the number of clusters and to evaluate clustering algorithms (Tan, Steinbach, & Kumar, 2005). This work focuses on the first question that is to obtain the proper groupings of plate tanks located in the Pajeú region.
Cluster analysis is an unsupervised learning approach, which organizes cisterns considering water quality variables in groups that have high similarity. Researchers from various fields of scientific research as in (Ajayi & Syed, 2014) have used various methods or clustering algorithms to determine the number of groups in masses of data Marriott (1971), Hartigan (1975), Milligan and Cooper (1985), Krzanowski and Lai (1988), Kaufman and Rousseeuw (1990), Tibshirani, Walther, and Hastie (2001),Dudoit and Fridlyand (2002), Sugar and James (2003).
One drawback of using clustering algorithms is to determine the best number of clusters to properly represent natural partitions. In this way, the validation of the clusters is necessary to ensure that the cluster structures obtained do not happen by chance (Oliveira et al., 2016). To overcome this deficiency several algorithms have been proposed, aiming at determining the optional number of clusters automatically as agglomerative methods of fusion (Frigui & Krishnapuram, 1996).
Some cluster validation indexes have been proposed Milligan and Cooper (1985), Kim and Ramakrishna (2005) and Bouguessa, Wang, and Sun (2006). They are generally based on an analysis of variance and on the comparison of intra and inter cluster variability. In this work, the statistic of the silhouette proposed by (Rousseeuw, 1987), was used as the validation index to estimate the optimal number of groups in the dataset of plate cisterns (Lin, Liu, Chao, & Chen, 2013). Most indexes are based on average values and center of the cluster, as in non-hierarchical methods.
In this study, we attempt to discover patterns of water quality characteristics of plate cisterns in the semi-arid region using ‘K-means’ (Joshua, Mu, John, & Paul, 2012) and ‘K-medoid’ algorithms, these two popular methods of data partitioning and widely used in many fields, including mining data recognition, pattern recognition, decision support, machine learning, and image segmentation (Mushtaq et al., 2018). These algorithms are considered by the data mining and machine learning community as an unsupervised learning technique because they search for patterns between input variables without using a result variable to enforce how the pattern is formed (Borysov, Hannig, & Marron, 2014).
Due to the fact that the number of groups was established before analysis, an interactive process was used to explore a range of (2-6) possible cluster solutions.
The objective of this study is to evaluate the effectiveness of the validation measure of plate tanks grouping according to the water quality variables in the determination of optimal partitions provided by non-hierarchical grouping methods.
Material and methods
The study area is located in the communities of Serra Grande: Poço do Serrote, Poldrinho, Catolé and Três Irmão, close to the Lagartixa mountain range, belonging to the municipal boundary between the cities of Serra Talhada (Figure 1) and Floresta, region of upper Sertão of Pajeú, semiarid environment of the State of Pernambuco with geographical coordinates of 38° 2355.51" longitude West and 8° 0706.72" South latitude.
The climate of the region, according to the Köppen classification (Alvares, Stape, Sentelhas, Gonçalves, & Sparovek, 2014), is in the type Bwh, denominated semi-arid, hot and dry, with summer rains in autumn with average annual rainfall of 647 mm, for the period from 1912 to 1991 (Alvares et al., 2014) and average annual temperature above 25oC.
In water resources management, the quantity and quality aspects can not be disintegrated, which reinforces the importance of assessing the water availability in qualitative terms of surface water. The main parameters that indicate pollution in water resources are: Hydrogen ionic potential (pH), electrical conductivity, total dissolved solids and total and fecal coliforms.
The conductivity parameter (cations and anions) is of fundamental importance in the study of water quality, however, it does not specifically determine which ions are present in a given water sample, but may contribute to possible environmental impacts that occur in the water reservoir caused by releases of industrial waste, mining debris, sewage, etc. pH is an important feature due to its influence on the biological processes that occur in the aquatic environment. The waters have a pH between 4 and 9 associated with the dissolution of CO2, when the pH approaches 9 occur absorption of carbon dioxide collaborates for the process of photosynthesis (Zuim, Ioriatti, & Matheus, 2009).
The concentration of total dissolved solids (S.D.T.) is a major problem because, in excess of S.D.T., water is unfit for human consumption, as it has unpleasant taste and pipe corrosion problems, besides its consumption can cause the accumulation of salts in the bloodstream and, consequently, kidney stones. Total coliforms include all bacteria in the form of gram-negative rods, not sporogenic. Fecal coliform rates are used as indicators of fecal contamination only (Junior, Bonifácio, & Tavares, 2013).
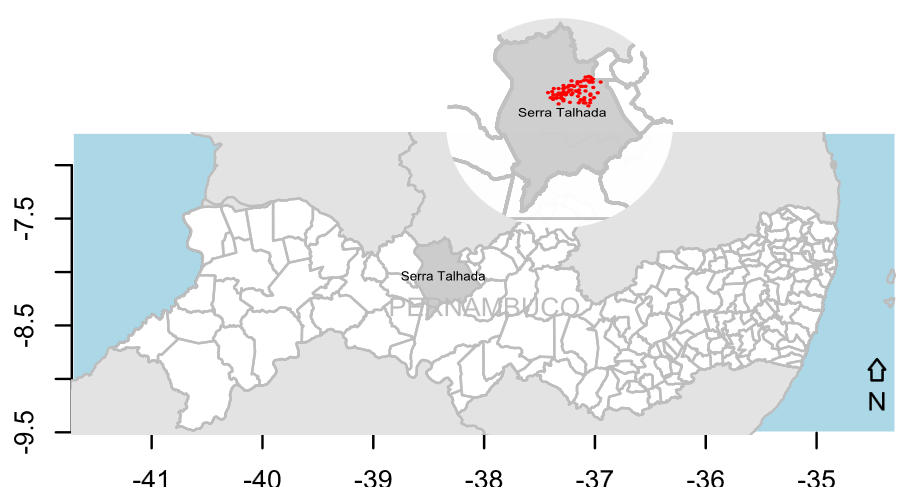
Figure 1.
Geographical location of the municipality of Serra Talhada, state Pernambuco.
‘K-means’ method
The ‘K-means’ method consists of grouping the objects or cisterns into k mutually exclusive or distinct groups. In order to find these groups, the algorithm uses an interactive process with the objective of minimizing the sum of the distances of each cistern in relation to the centroid of each group that will be the most representative cistern of the respective group. As in other methods by partitioning, the main difference between this method and others by partition is that the centroid of each group is given by their mean.
To group the tanks into groups using the ‘K-means’ method, the following steps must be followedas Figure 2 schematically shows the algorithm.
According to (Joshua et al., 2012), the solution obtained by the method of ‘K-means’, in general, depends on the starting point, since the algorithm finds a local minimum, as it happens in several minimization problems. This method is practical and computationally powerful, but it is sensitive to outliers and is also not suitable for non-convex clusters. It is indicated its use in continuous data.
Some characteristics of the K - means are:
- Sensitivity to noise, since an element with an extremely high value can distort the data distribution;
- Tendency to form spherical groups;
- The number of groups is the same throughout the process;
- Inadequate to discover groups with non-convex shapes or very different sizes.
‘K-medoid’ method (PAM)
Use the following notation to describe the PAM algorithm. Let X = Seja X= {x1, x2, x3, …, xn} be the set of n data points to be grouped, where each data point consists of d real-valued attributes. Let M={m1, m2, m3, …, mk} is a set of K medoids such that M ⊂ X, where K is the number of clusters such that K ≪ N.D∶ X × M → R is a distance metric, usually an array of Euclidean distances of each object xi to its closest medoid mj. In each iteration of the algorithm, a pair of fearless object mj. andnon-medoid object xi is selected which produces the best grouping when its functions are changed. The objective function used is the sum of the distances of each object with the closest medóid (Mushtaq et al., 2018):
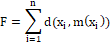
(1)
where:
n is the total number of objects or cisterns in the data set, xi is the i-th cistern of the data set, m (xi) is the closest to the cistern xi ed [xi, m (xi)] is dissimilarity between xi in (xi).
The PAM algorithm proceeds as follows:
- In the first phase, an initial grouping is obtained by the successive selection of Kmedoids. The first medoid is the one for which the sum of the distances for all non-fearful objects is minimal. This is actually the most central data point in the X-set. Subsequently, at each step, another object is selected as a medoid, for which the objective function is minimal. The process continues until the K medoids are found.
- In the second phase of the algorithm, we try to improve the set M of medoids and, therefore, the grouping obtained by this set. The algorithm passes through each pair of objects (m_j, x_h), where m_jé a medoid and x_h is non-medoid object and x_h belongs to cluster j. The effect on the objective function is determined when an exchange is performed for example, when the object x_h is considered as a medoid instead of object m_j. For each cluster j, the object x_h is selected as its new medióide for which the objective function is minimized and, therefore, the set M is updated. This process is iterated until no further reduction in the value of the objective function is possible or, in other words, there is no update in the set M between two consecutive iterations.
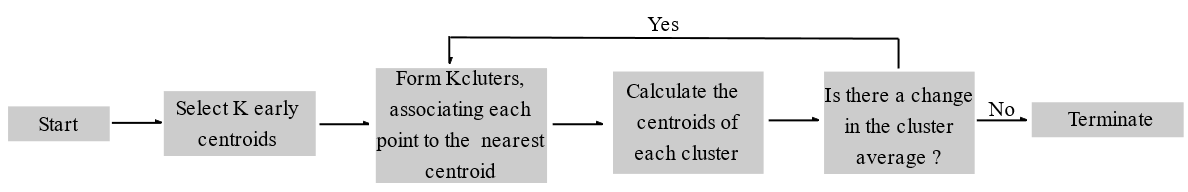
Figure 2.
Algorithm ‘K-means’.
As we discussed earlier, WFP consists of two phases called (1) Construction Phase and (2) Change Phase. The complete flowchart of the Partitioning Around Medoids algorithm in terms of this is shown in Figure 3.
Exchanging objects between ‘medoids’
In this step, it is sought to improve the set of ‘medoids’ exchanging the objects or cisterns between them. Thus, if there is a minimization of the objective function, the exchange is maintained, otherwise it is undone.
The result sought is measured by the Mean Final Distance (DMF) given by the following Equation 2:
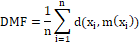
(2)
where:
n is the total number of objects or cisterns in the data set, xi is the i-th cistern of the data set, m (xi) is the closest to the cistern xi ed [xi, m (xi)] is dissimilarity between xi in (xi). The k - medoid, proposed by (Vinod, 1969), was implemented in the PAM algorithm.
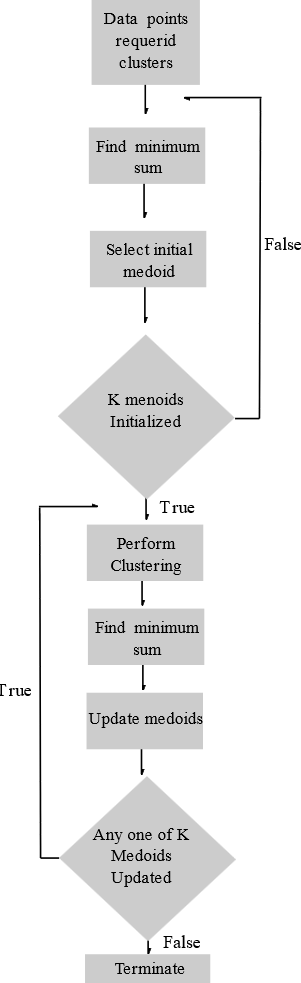
Figure 3.
Sequential flowchart of the PAM algorithm.
Some features of K-medoid are:
- Regardless of the order, the results will be the same;
- Tendency to find spherical groups;
- Processing more costly than ‘K-means’;
- Not applicable to large databases, because the cost of processing is high;
- More robust than ‘K-means’ in the presence of noise because the medóide is less influenced by the noises than the average.
Silhouette index
The index or statistics of the silhouette was proposed by (Rousseeuw, 1987), with the intention of evaluating partitioning methods. In this case, each object (cistern) is represented by a value s (i) called a silhouette, which is based on the comparison of homogeneity and the ‘separation’ of each group. Thus, for an object i, the value of the silhouette is given by Equation 3:
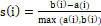
(3)
where:
a (i) is the average distance from object i to objects in its group;
b (i) is the average distance from object i to objects of other groups.
Negative values of s (i) suggest that individual i is similar to individuals of other classes. Values of s (i) in the neighborhood of 1 give indications that i is well graded.
Results and discussion
‘K-means’
The non-hierarchical methods based on partition are the most used, being the method of K-averagesor (‘K-means’) one of the methods obtained by partition that became consecrated in the last decades. The non-hierarchical grouping technique seeks to partition the objects or cisterns with their respective water quality variables into k groups (G1, G2, ..., Gk), where Gi denotes the groups of cisterns in k groups, minimizing some numerical criteria that, resulting in low values, gives indications of good results.
The most common implementation of the non-hierarchical K-means clustering method is one that searches for a partition of the hundred cisterns in k groups as observed in (Joshua et al., 2012), minimizing the sum of the squares of the deviations within the groups. A simple and clear way to use the ‘K-mean’ method is observed in Figure 4, in the data of the cisterns as a whole, that is, when each of the variables is plotted against the others.
Initially we will observe the dispersion of the data in the Scatterplot shown in Figure 4. The Scatterplot suggests that at least one of the cisterns is considered different from the others in relation to its quality of water, especially the rate of fecal coliforms. Tanks are easily identified, ie cisterns (C64, C65, C66, C71, C79, C100) have ‘high’ rates of fecal coliforms. It was also verified that the other variables of water quality presented high rates in these six cisterns. And it was clearly observed that these tanks have high rates in relation to most water quality variables.
Since the data were standardized for the measurement scale correction of the variables, their variances are very similar, and so we proceed in the grouping process. First, the sum of squared within the groups, which ranges from one to six groups, will be used to indicate the most plausible number of groups. This solution is shown in Figure 5, and the most significant heights in the curve of Figure 5 occurs when going from 2 to 3 groups, from which it can be concluded that optimal clustering occurs in the formation of three groups in accordance with the study of (Kassomenos et al., 2010).
It is observed the existence of three groups, which were obtained by the method of non-hierarchical grouping of ‘K-means’. Groups 1, 2 and 3, as observed in (Table 1), were formed with the respective cisterns.
In this method, the number of groups was not initially known, so the indication of the optimal number of groups was suggested by the sum of squares within the groups or by the fusion coefficient, according to the studies of (Kassomenos et al., 2010). A good allocation of cisterns in the three groups is also observed by the ‘K-mean’ method.
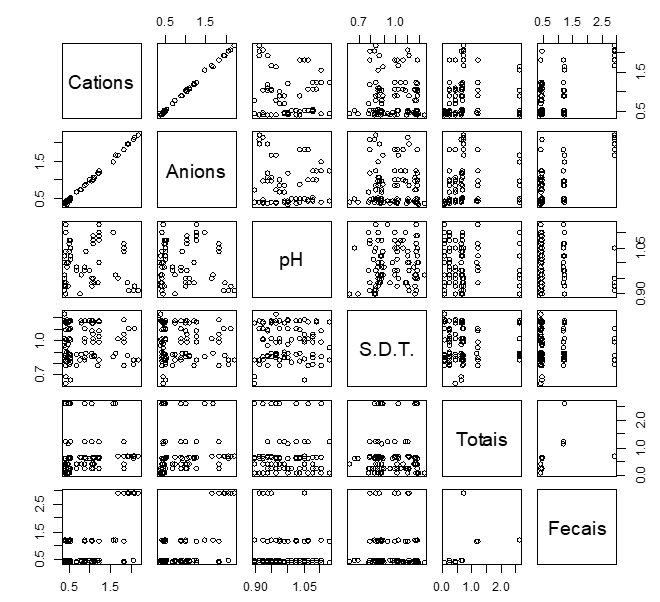
Figure 4.
‘Scatterplot’ of the data matrix of plate cisterns from the Pajeú region.
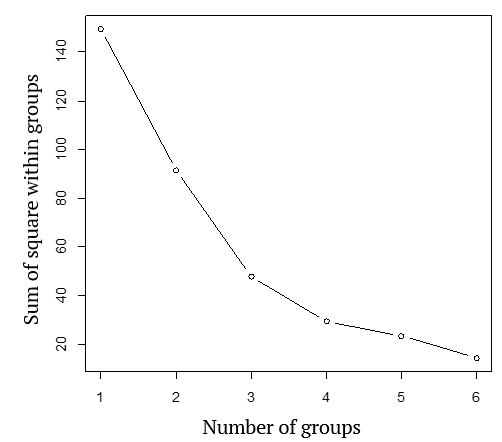
Figure 5.
Sum of squares within the groups for different groups, using the ‘K-means’ method for the data of plate cisterns in the Pajeú, state Pernambuco.
Number of groups
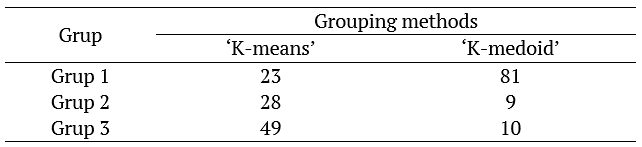
Table 1.
Number of cisterns grouped by non-hierarchical groupings of ‘K-mean’ and ‘K-medoid’.
The silhouette statistics of groups 1, 2 and 3 were 0.12, 0.43 and 0.52, respectively, while the mean silhouette statistic was 0.40, as observed in Figure 6. These values give strong indications of that regular groupings of cisterns were obtained according to the similarity or similarity in their water qualities. The measure of the silhouette statistics obtained for each group represents the quality of the groups found. The higher this value, the better the quality of the clusters found by the method.
This method, being interactive, leads us to believe that these three groups should have approximately the same number of cisterns, that is, 33 or 34 cisterns in each group. As this did not happen, evidently the method of ‘K-means’ grouped in the most pertinent way that the characteristics of each cistern could resemble within the same group and different from the other two groups. This can be observed in the Scatterplot shown in Figure 7, in which the groups appear in different colors for each water quality variable measured in the cisterns under study.
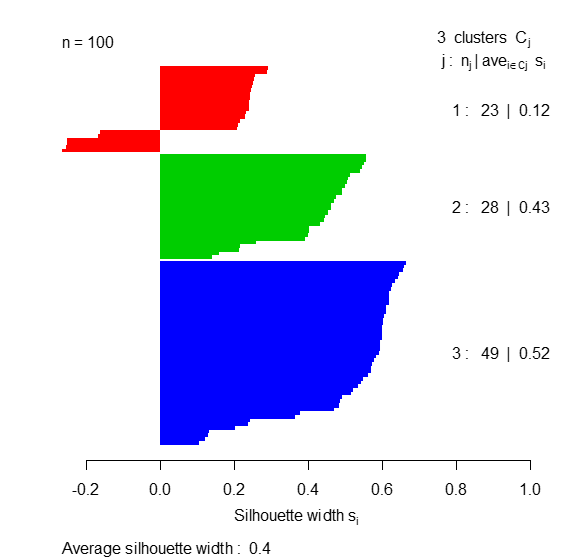
Figure 6.
Silhouette graphic and statistics obtained by the ‘K-mean’ method.
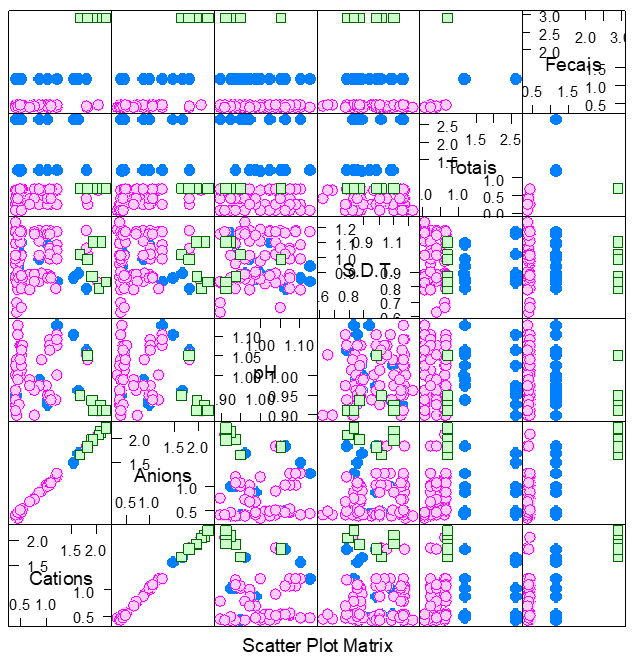
Figure 7.
Scatterplot of the plate tanks data matrix of the Pajeú, state Pernambuco, with the clusters obtained by the ‘K-mean’ method with 10 initial simulations.
This classification was performed by the ‘K-medium’ method, respecting the similarity of each cistern to the groups, and it is not really known a way that best assigns each cistern to each group. Therefore, the non-hierarchical method of clustering of ‘K-means’ performed a grouping of the cisterns that did not generate any group with few cisterns or outliers, giving indications of a parsimonious classification, from the point of view of similarity or homogeneity of cisterns that are in the same group and of dissimilarity of the cisterns that are in the other groups. That is, the water quality of these cisterns attendthree scales of different measures, according to the variables being considered for this study.
‘K-medoid’
The method of non-hierarchical clustering of ‘K-means’ to perform the task for which it is intended, that is, to group, needs access to the data matrix and use of Euclidean distance. However, in the case of non-hierarchical grouping methods, there is another method similar to ‘K-means’, differentiating only by using one element of the group that represents the others, being a point of reference. This method is known as the ‘K-medoid’ criterion proposed by (Vinod, 1969).
The number of groups suggested by the sum of squares within the groups for different groups (Figure 5) are three groups, and for each of these groups a representative or cistern element was obtained which was the reference point of each of the groups, which is the average or medoid of the groups. Thus considering k = 3 groups, as indicated in Figure 5, the pam algorithm suggests as initial ‘medoids’ or center of the groups the cisterns (C75, C64, C53), for groups 1, 2 and 3, respectively.
It was verified as observed in Table 1 that eighty-one cisterns are allocated in group 1, since they are closer to the C75 ‘medoid’, group 2, in turn, allocated nine cisterns that are closer to the C64 ‘medoid’, while the group 3 ranked ten cisterns that are close to the C53 ‘medoid’ and therefore not to the other two groups because they are distant from their ‘medoids’.
The measure of the silhouette statistics calculated for each group represents the quality of the groups found. The higher this value, the better the quality of the clusters, as proposed by (Albalate, Suendermann, & Minker, 2011). Then the silhouette statistics of groups 1, 2 and 3 were 0.63, 0.62 and 0.67, respectively, while the mean silhouette statistic was 0.64, as observed in Figure 8. These values give strong indications from which good groupings of cisterns were obtained, according to the similarity or similarity in their water qualities.
According to (Kaufman & Rousseeuw, 1990), PAM-Partioning Around Medoids differs from the ‘K-average’ or ‘K-means’ method with respect to the choice of the k representatives of each group and the function to be minimized. The k representatives of the groups are chosen from the individuals observed. Figure 9 shows the graphical representation of the pam algorithm used by the ‘K-medoid’ method to obtain three groups formed by the plate tanks of the Pajeú, state Pernambuco.
It is observed the formation of three groups - 1, 2 and 3 - represented by the colors red, blue and green, respectively. However, as shown in Figure 9, tank C90, for example, is in group 3, being near next to group 2, so it appears in the blue color and border of group 3. Also cistern C100 is in group 2, more with a considerable neighborhood belonging to group 3, and so on, as observed by (Docampo, Collado, Escaramiís, Carbonell, & Rivera, 2013), in a Principal Component Analysis. Thus, the cisterns that are in their proper groups and with the original colors of the group would be candidates for fear of this group, but not strong enough to represent the group as the cisterns that represented them, as previously mentioned.
Therefore, the water quality of the cisterns in group 1 should represent a water quality standard of the cisterns of the Pajeú - State Pernambuco, since eighty one cisterns or 81% of that sample are of similar water quality because they are in the same group. In relation to groups 2 and 3, the possibility of representing the water quality of this region is not ruled out, considering that the quality of the grouping of these groups is quite satisfactory, when considered as a criterion of their validations the silhouette statistics.
The ‘K-means’ method showed some differences in relation to the ‘K-medoid’ method, one of them being that group 1 grouped twenty - three cisterns, that is, a much lower number in relation to the same group obtained by the grouping method of Kas the group 2 was left with twenty-eight cisterns according to the ‘K-means’ method, and by the ‘K-medoid’ method this group allocated 9 cisterns. Similar observation is verified in group 3 where the ‘K-means’ method allocated 49 cisterns and the ‘K-medoid’ method only 10 cisterns, that is, in groups 2 and 3 the ‘K-means’ method allocated a larger number of cisterns ‘K-medoid’ method. In general, the ‘K-means’ method classified the cisterns in the three groups in a more parsimonious manner, that is, there were no groups with a high number of cisterns and so few groups with few observations.
The ‘K-medoid’ method presented peculiar characteristics in relation to the ‘K-means’ method. These characteristics were also notable in the graph and in the silhouette statistics observed in Figure 4 and 6, where the group that obtained statistic of the highest silhouette with value of 0.67 was group 3, corresponding to the ‘K-medoid’ method while the groups 1, 2, obtained statistics of the silhouette 0.63 and 0.62, respectively, giving indications of good classification of the cisterns in their respective groups, even with values of silhouette statistics not so high but all around 0.65. The mean silhouette statistic obtained by the ‘K-medoid’ method was 0.64, a value that does not cause suspicion that this method did not adequately classify the cisterns in the respective groups.
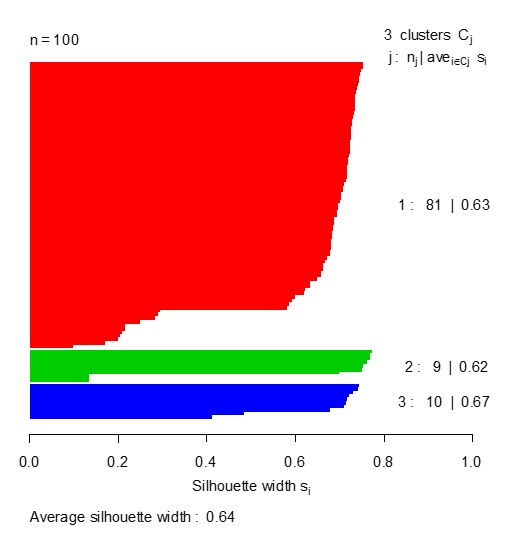
Figure 8.
Graph and silhouette statistics obtained by the ‘K-medoid’ method.
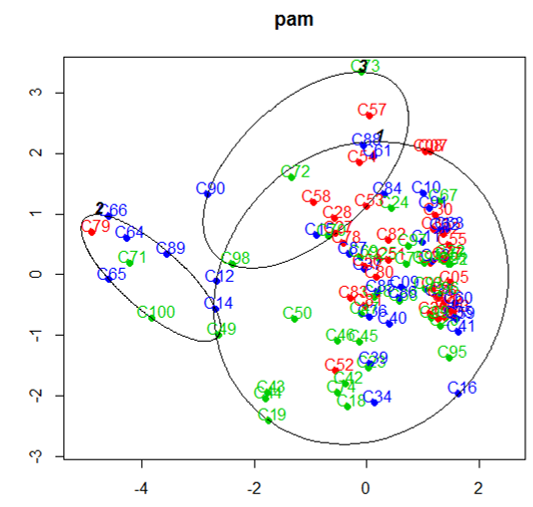
Figure 9.
Groupings obtained by the ‘K-medoid’ method using ‘pam’.
Conclusion
The non-hierarchical method of ‘K-medoid’ formed more homogeneous groupings of plate cisterns in the Pajeú region. The non-hierarchical ‘K-means’ method was also used in the cluster analysis of the plate cisterns in their respective groups. After the analysis, it was observed that the non-hierarchical method of ‘K-medoid’ obtained the best performance for both the group with the largest number of cisterns and the groups that allocated a low number of cisterns. Therefore, the non-hierarchical ‘K-medoid’ grouping method seemed to form more homogeneous clusters, and in this way the one that obtained the best performance according to the Silhouette 's statistics.
References
Ajayi, A. A., & Syed, M. (2014). Links between patterns of racial socialization and discrimination experiences and psychological adjustment: a cluster analysis. Journal of Adolescence, 37(1), 1011-1020. doi: 10.1016/j.adolescence.2014.07.006
Albalate, A., Suendermann, D., & Minker, W. (2011). On cluster validation for detecting the number of clusters in a data set. International Journal on Artificial Intelligence Tools, 20(5), 941-953. doi: 10.1142/s0218213011000334
Alvares, C. A., Stape, J. L., Sentelhas, P. C., Gonçalves, J. L. M., & Sparovek, G. (2014). Koppen’s climate classification map for Brazil. Meteorologische Zeitschrift, 22(6), 711-728. doi: 10.1127/0941-2948/2013/0507
Borysov, P., Hannig, J., & Marron, J. S. (2014). Asymptotics of hierarchical clustering for growing dimension. Journal of Multivariate Analysis, 124(1), 465-479. doi: 10.1016/j.jmva.2013.11.010
Bouguessa, M., Wang, S., & Sun, H. (2006). An objective approach o cluster validation. Pattern Recognition Lett, 27(13), 1419-1430. doi: 10.1016/j.patrec.2006.01.015
Cherwin, K., & Knapp, A. (2012). Unexpected patterns of sensitivity to drought in three semi-arid grasslands. Global Change Ecology - Original Research, 169(3), 845-852. doi: 10.1007/s00442-011-2235-2
Cruz, D. V., Oliveira, M. R. G., Cruz, D. V., & Cunha Filho, M. (2016). Monitoring pH with quality control based on Geostatistics Methodology. IEEE Latin America Transactions, 14(10), 4787-4791. doi: 10.1109/tla.2016.7817012
Docampo, E., Collado, A., Escaramiís, G., Carbonell, J., & Rivera, J. (2013). Cluster analysis of clinical data identifies fibromyalgia subgroups. PLoS ONE, 8(9), e74873. doi: 10.1371/journal.pone.0074873
Dudoit, S., & Fridlyand, J. (2002). A prediction-based resampling method for estimating the number of clusters in a data set. Genome Biology, 3(7), 1-21. doi: 10.1186/gb-2002-3-7-research0036
Frigui, H., & Krishnapuram, R. (1996). A robust algorithm for automatic extraction of an unknown number of clusters from noisy data. Pattern Recognition Lett, 17(12), 1223-1232. doi: 10.1016/0167-8655(96)00080-3
Hartigan, J. A. (1975). Clustering algorithms. Lansing, MI: Wiley.
Joshua, J. A., Mu, Z., John, P. H., & Paul, S. (2012). K-means cluster analysis of rehabilitation service users in the home health care system of ontario: examining the heterogeneity of a complex geriatric population. Archives of Physical Medicine and Rehabilitation, 93(2), 198-205. doi: 10.1016/j.apmr.2012.05.026
Junior, O. T., Bonifácio, C. M., & Tavares, C. R. G. (2013). Monitoramento da qualidade da água nas bacias do Paranapanema III e IV: parâmetros físicos. Periódico Eletrônico, 9(2), 378-391. doi: 10.17271/19800827922013653
Kassomenos, P., Vardoulakis, S., Borge, R., Lumbreras, J., Papaloukas, C., & Karakitsios, S. (2010). Comparison of statistical clustering techniques for the classification of modelled atmospheric trajectories. Theoretical and Applied Climatology, 102, 1-12. doi: 10.1007/s00704-009-0233-7
Kaufman, L., & Rousseeuw, P. (1990). Finding groups in data: an introduction to cluster analysis. New York, NY: Wiley.
Kim, M., & Ramakrishna, R. S. (2005). New indices for cluster validity assessment. Pattern Recognition Lett, 26(15), 2353-2363. doi: 10.1016/j.patrec.2005.04.007
Krzanowski, W. J., & Lai, Y. T. (1988). A criterion for determining the number of groups in a data set using sum of squares clustering. Biometrics, 44(1), 23-34. doi: 10.2307/2531893
Lin, T. C., Liu, R. S., Chao, Y. T., & Chen, S. Y. (2013). Classifying subtypes of acute lymphoblastic leukemia using silhouette statistics and genetic algorithms. Gene, 518(1), 159-163. doi: 10.1016/j.gene.2012.11.046
Marriott, F. H. C. (1971). Practical problems in a method of cluster analysis. Biometrics, 27(3), 501-514. doi: 10.2307/2528592
Milligan, G. W., & Cooper, C. (1985). An examination of procedures for determining the number of clusters in a data set. Psychometrika, 50(1), 159-179. doi: 10.1007/bf02294245
Mushtaq, H., Khawaja, S. G., Akram, M. U., Yasin, A., Muzammal, M., Khalid, S., & Khan, S. A. (2018). A parallel architecture for the partitioning around medoids (PAM) algorithm for scalable multi-core processor implementation with applications in healthcare. Sensors, 18(12), 1-17. doi: 10.3390/s18124129
Oliveira, M. R. G., Cruz, D. V., & Cunha Filho, M. (2016). Mapping plaques cisterns by fuzzy grouping analysis. IEEE Latin America Transactions, 14(10), 4367-4372. doi: 10.1109/tla.2016.7786317
Rousseeuw, P. J. (1987). Silhouettes: a graphical aid to the interpretation and validation of cluster analysis. Journal Computational Applied Mathematics, 20, 53-65. doi: 10.1016/0377-0427(87)90125-7
Sugar, C. A., & James, G. M. (2003). Finding the number of clusters in a data set: an information theoretic approach. Journal of the American Statistical Association, 98(46), 750-763. doi: 10.1198/016214503000000666
Tan, P.-N., Steinbach, M., & Kumar, V. (2005). Introduction to data mining. Boston, MA: Addison Wesley.
Tibshirani, R., Walther, G., & Hastie, T. (2001). Estimating the number of clusters in a data set via the gap statistic. Journal of the Royal Statistical Society, Series B, 63(2), 411-423. doi: 10.1111/1467-9868.00293
Vinod, H. (1969). Integer programming and the theory of grouping. Journal of the American Statistical Association, 64(326), 506-517. doi: 10.2307/2283635
Zuim, V. G., Ioriatti, M. C. S., & Matheus, C. (2009). O emprego de parâmetros físicos e químicos para avaliação da qualidade das águas naturais: uma proposta para educação química e ambiental na perspectiva CTSA. Química e Sociedade, 31(1), 3-7.
Notas de autor
rivelino_gomes@hotmail.com
