Abstract: Respiration of cut mango (Mangifera Indica L.) cv. Tommy Atkins was studied using the closed system method at three temperatures (4, 20 and 35 °C). Two models were used to estimate the gas concentration, which were adjusted through non-lineal regression algorisms using Matlab R2011a software. Three mathematic models, a model based on Michaelis-Menten's enzymatic kinetics, and two models based on regression analysis, in one of which a saturation equation was included as a new proposal in this field, were set to predict the substrate respiration rate. Results made evident the positive effect of temperature on mango respiration rate. The model with the best adjustment to mango respiration rate was Michaelis-Menten's with an adjusted correlation coefficient of 0.9811 and 0.9747 for CO. and O. respectively, with a relative mean error lower than 10%.
Keywords:Shelf lifeShelf life,RipenessRipeness,Respiratory processRespiratory process.
Resumen: Se estudió la respiración del mango cortado (Mangifera Indica L.), cv. Tommy Atkins, utilizando el método de sistema cerrado, a tres temperaturas (4, 20 y 35 °C). Se usaron dos modelos para estimar la concentración de gas, los cuales se ajustaron a través de algoritmos de regresión no lineal usando el software Matlab R2011a. Se ajustaron tres modelos matemáticos para predecir la tasa de respiración del sustrato. Un modelo basado en la cinética enzimática de Michaelis-Menten, y dos modelos basados en análisis de regresión, en uno de los cuales se incluyó una ecuación de saturación como una nueva propuesta en este campo. Los resultados evidenciaron el efecto positivo que tiene la temperatura sobre la tasa de respiración del mango. El modelo que mejor ajuste entregó para la velocidad de respiración del mango fue el modelo de Michaelis-Menten con un coeficiente de correlación ajustado de 0.9811 y 0.9747 para CO. y O., respectivamente, con un error medio relativo inferior al 10%.
Palabras clave: Vida útil, Madurez, Proceso respiratorio.
Respiration kinetic of mango (Mangifera indica L.) as function of storage temperature
Cinética de respiración de mango (Mangifera indica L.) como función de la temperatura de almacenamiento
Universidad Nacional de Colombia

This work is licensed under Creative Commons Attribution 4.0 International.
Received: March , 07, 2016
Accepted: July , 13, 2016
Mango (Mangifera indica L.) fruits cv. Tommy Atkins in physiological ripe state determined by Colombian technical norm NTC 5210 (ICONTEC, 2003) were used. These were bought in Central Minorista in the city of Medellín, to which they were brought from the southwest of the department of Antioquia. They were washed with alkaline detergent and disinfected with a solution at 100 ppm of sodium hypochlorite (Ngarmsak et al., 2005). They were cut in 0.5 cm edge cubes, leaving seed and epidermis aside, samples were taken to determine pH (ICONTEC, 1991), soluble solids (ICONTEC,1999), and acidity contents expressed as citric acid percentage (ICONTEC, 1991).
Respiration experimental calculation
Respiration rate was determined to the mango in a closed system (Ravindra and Goswami, 2008), which consisted in subjecting 150 g of the product deposited in a 4,000 mL capacity airtight recipient to atmospheric conditions of 20.94 % O., 78.08 % N., and 0.03 % CO..
Three temperatures were set out in 4, 20 and 35 °C using an oven with temperature control (Binder, Germany). O. consumption and CO. production were measured by a PBI Dansensor Check Point O./CO. analyzer (Dansensor, Denmark). Each assay was performed twice.
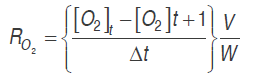
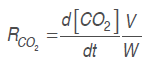
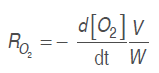
Expressions (.) and (.) were used to calculate respiration rate, these had already been used in products such as pepper (Artés-Hernández et al., 2010), mango (Ravindra and Goswami, 2008), and banana (Bhande et al., 2008).
 (1)
(1)
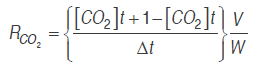 (2)
(2)Where RO2 and RCO2 are the respiration rates (mL kg-1 h-1), [O.] and [CO.] are oxygen and carbon dioxide concentrations, . is time (h), Δ. is the time between the two measures of the respective gas, . is the free volume in the respiration chamber (mL), and . is the cut fruit mass (kg).
Models for the gas behavior
The following models were used to estimate the gas concentration by a regression made with Matlab R2011a software, finding the model coefficients for all treatments.
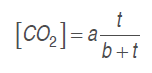
Model 1. A model is proposed to estimate the experimental data of the O. and CO. concentrations by a growing reason expression or saturation equation (Chapra and Canale, 2007), as indicated in equations (.) and (.), adjusting them to CO. kinetic production and O. consumption, respectively.
 (3)
(3)
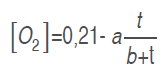 (4)
(4)Where . and . are model parameters, and t is time (h).
Model 2. The model used by Bhande et al. (2008) in banana, and Ravindra and Goswami (2008) in mango cv. Amrapali, was also assessed. Equations (.) and (.) are used in this one adjusting O. and CO. concentrations in time function.
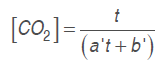 (5)
(5)
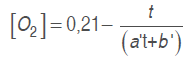 (6)
(6)Where a' and b' are model parameters and t is time (h).
Respiration models
Respiration rate for CO. (.CO2) and O. (.O2) was calculated by three different methodologies:
Equations (.), (4), (.) and (6) were derived, as derivatives of model 1and model 2, respectively.
Respiration rate was calculated with model 1 and model 2 derivatives, replacing them in equations (7) and (8), as follows:
 (7)
(7)
 (8)
(8)To obtain the cut mango respiration rate in the described conditions, a model based on Michaelis-Menten's kinetic equation was used, using enzymatic kinetic noncompetitive inhibition principles, where CO. is supposed to react to an enzyme-substrate complex (Artés-Hernández et al., 2010;Ravindra and Goswami, 2008; Bhande et al., 2008). Equation (9) expresses this mechanism for the respiration process in terms of O. consumption and CO. production rate. This kind of model presented a significant adjustment in the calculation of mango (Ravindra and Goswami, 2008), banana (Bhande et al., 2008), pepper (Artés-Hernández et al., 2010) and other fruit (Fonseca et al., 2002) respiratory activity.
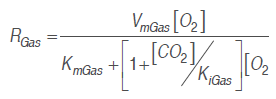 (9)
(9)
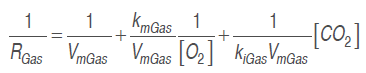 (10)
(10)Arrhenius's equation
Temperature effect on O. consumption and CO. production rate was assessed by Arrhenius's equation (Iqbal et al., 2009;Waghmare et al., 2013).
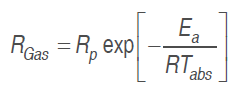 (11)
(11)Where .Gas is O. consumption and CO. production rate (mL kg-1h-1), .p is respiration pre-exponential factor,.a is the activation energy (J mol-1), . is the gas universal constant (8,314 J mol-1 K-1), and .abs is the absolute temperature in K.
Relative standard deviation
Respiration rates predicted from the different models were contrasted with the experimental respiration rate, equations (.) and (.) by relative standard deviation, equation (12).
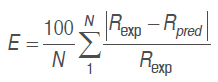 (12)
(12)Where . is the relative standard deviation module (%), . is the respiration data point number, .exp is the experimental respiration rate (mL kg-1 h-1), and .pred is the predicted respiration rate (mL kg-1 h-1). A good adjustment is defined with .<10 % (Ravindra and Goswami, 2008).
The physicochemical parameters to fresh mango were pH 3.4, °Bx 9.5 and acidity 1.05% as citric acid. Experimental data of the O. consumption and CO. production at different temperatures are shown in figure 1. The nonlinear drop on O. concentration in the conditions of the current work matches the pattern expected from other climacteric products kept in sealed containers (Ravindra and Goswami, 2008;Hagger et al., 1992;Jacxsens et al., 1999; Guevara et al., 2006) and agrees with the hypothesis of saturation equation (model 1), as this type of equations start assuming that the system is saturated with CO. and O. consumed until exhaustion (Chapra and Canale, 2007). It is observed that a rise in temperature also raises the gradient of the graph for the gas behavior, consequently the respiration rate increases as it happens with the papaya (Zapata et al., 2004), banana (Bhande et al., 2008), and mango cv. Amrapali (Ravindra and Goswami, 2008). This is due to that the rate of the enzymatic reactions grows exponentially with the rise of the temperature (Lee et al., 1996). Low temperatures reduce respiration rate, O. consumption, CO. and ethylene production. As the tissues react to the latter (Mendoza et al., 2016), in order for maturity to occur, the needs of ethylene and the time of exposure are higher at low temperatures (Kader, 1994).
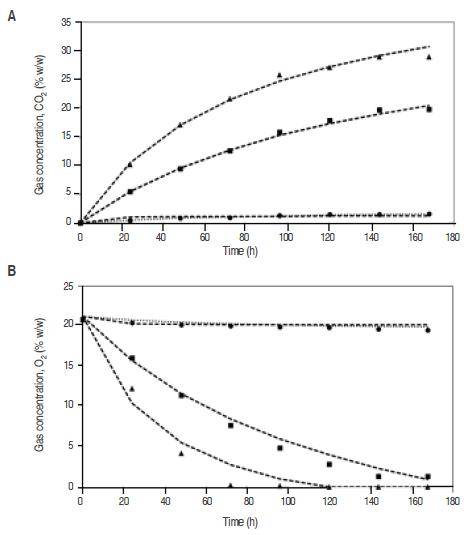
Figure 1
Experimental data of CO2 consumption (A) and O2 production (B) at different temperatures: ● 4 °C ■ 20 °C y ▲ 35 °C and using the Model 1: ·· and Model 2: - - - to predict the gas concentration.
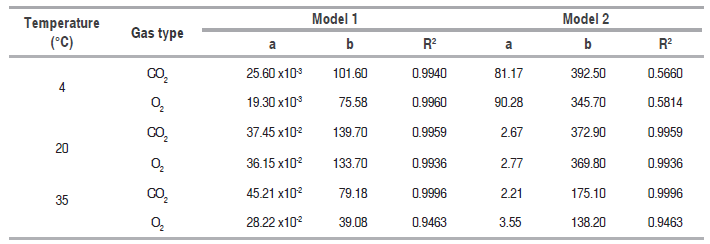
Models 1 and 2 parameters
Table 1 shows the values of the coefficients . and . for equations (.), (.), (.) and (.) with their respective correlation coefficients (.2), obtained for the three temperatures assessed in the closed system. Model 1 presented an excellent adjustment to the data in the three assessed temperatures, while model 2 had a very poor adjustment to the data at 4 °C. Model 2 coefficients presented a high variability with temperature compared with model 1; it can be seen that parameter . is more influenced with temperature than coefficient . in both.
Values of adjusted coefficients to predict gas concentration.
Respiration kinetics
Table 2 presents Michaelis-Menten's model parameters, with their corresponding adjusted correlation coefficient (R2). A good adjustment of the experimental data with such model for RCO2 and RO2 is observed.
Parameters for the expression of the respiration rate in the noncompetitive inhibition model of Michaelis-Menten, at different temperatures.
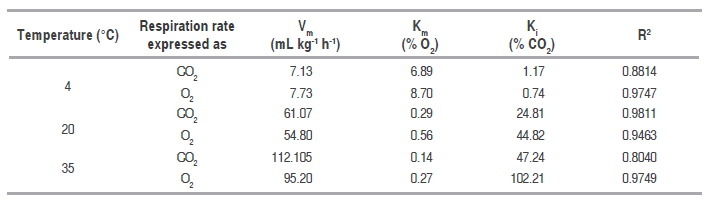
Table 2 data analysis based on the form of equation (.), allows to observe the effect gases have on the rate of CO. production and O. consumption. These effects are more noticeable at low CO. and high O. concentrations, at 20 and 35 °C. Km and Ki values indicate CO. production rate is more sensible to the concentration of both gases than O. consumption rate, due to both constants are lower for the CO. production than O. consumption expressions. On the other hand, low Km values indicate the significant effect of O. concentration on respiration rates in terms of CO. as well as O.. While relatively high Ki values indicate that CO. concentration does not have such as significant effect on respiration rates. Nevertheless, the effect this gas has on respiration rate, given the adjust the model shows, cannot be denied. Besides, it is known that very high CO. and very low O. concentrations may cause respiration to change from aerobic to anaerobic, causing the creation of fermentation products such as acetaldehyde and ethanol (Angós et al., 2008).
Figure 2 shows that CO. experimental consumption rate (RCO2) has a starting value at 4 °C of 5.09 mL kg-1 h-1, compared to the same gas experimental rate at 20 °C of 59.21 mL kg-1 h-1, and at 35 °C it is of 110.76 mL kg-1 h-1. This difference is due to reduction of temperature becomes into a reduction of the rate at which parameter such as respiration, texture and microbial growth change; this is why the organoleptic and physiological characteristics of mango stored at 4 °C did not present significant change in odor, texture and flavor.
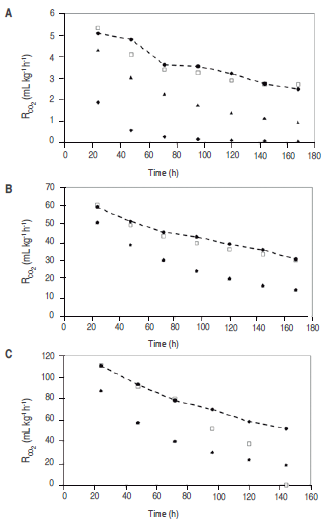
Figure 2
CO2 production rate (RCO2) for cut mango stored at 4 °C (A) 20 °C (B) and 30 °C (C); -●- Experimental consumption rate; ▲ consumption rate calculated with Model 1 (proposed); ♦ consumption rate calculated with Model 2; □ consumption rate predicted with Michaelis-Menten's equation.
Reduction of temperature not only reduces ethylene production, but also the response rate of tissues to such gas; therefore, the more the temperature drops, the higher exposure time required by the metabolic cycle to start at a certain ethylene concentration is (Mendoza et al., 2016). Associated to this the temperature affect RO2, as can be seen in figure 3.
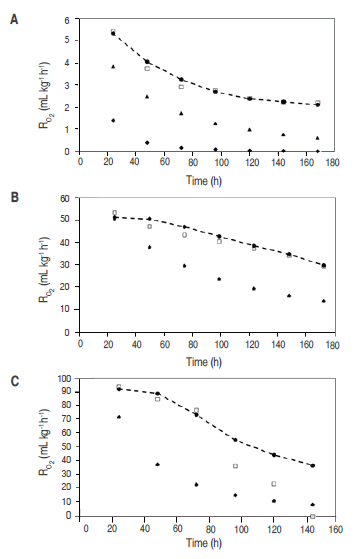
Figure 3
O2 consumption rate (RO2) for cut mango stored at 4 °C (A). 20 °C (B) and 30 °C (C); -●- Experimental consumption rate; ▲ consumption rate calculated with Model 1 (proposed); ♦ consumption rate calculated with Model 2; □ consumption rate predicted with Michaelis-Menten's equation
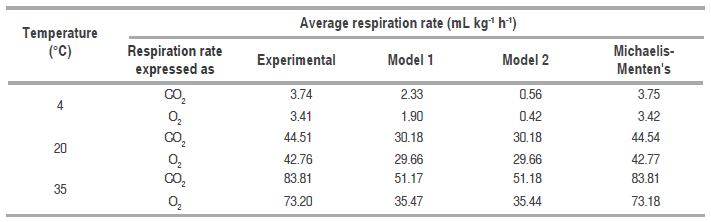
Table 3 shows the RCO2 and RO2 average value predicted for the three temperatures with Michaelis-Menten's equation, models 1 and 2, being noncompetitive inhibition Michaelis-Menten's equation the best model. Figures 2 and 3 show graphic behavior of experimental respiration and the one predicted by the models in terms of RCO2 and RO2.
Average respiration rate of the different models for the three temperatures.
The model proposed (Model 1) is the second that best adjusts to O. consumption and CO. production, and also to the prediction of RCO2 and RO2, being relevant at 4 °C (Figure 2 (A) for CO. and Figure 3 (A) for O.); while at 20 °C and 35 °C the proposed model and the one in the literature present the same values predicted of RCO2 and RO2. A cell change due to the incapacity of the enzymes associated to mitochondrial membranes to metabolize glycolysis products may happen at these low temperatures (Kader, 1994) therefore, model 2 may not give a good adjustment.
Relative standard deviation values of each one of the models are shown in table 4. Michaelis-Menten's kinetic model obtained an excellent adjustment for the experimental value with E<10% in the different temperatures, while the model reported in literature had the least fitting, except for RCO2 and RO2 in refrigeration temperature; this is due to this model adjustment expressed in the R2 in table 1 is not adequate for this condition. Model 2, reported by Bhande et al. (2008) and Ravindra and Goswami (2008), could be useful in temperatures higher to 4 °C, but does not present good adjustment.
Relative standard deviation for the models developed for the three storage temperatures.
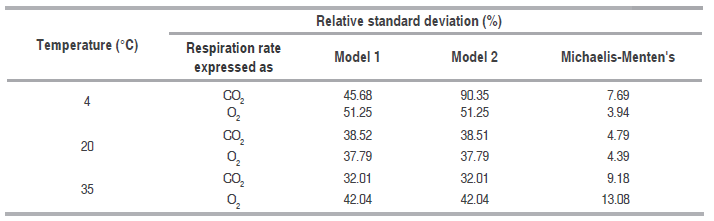
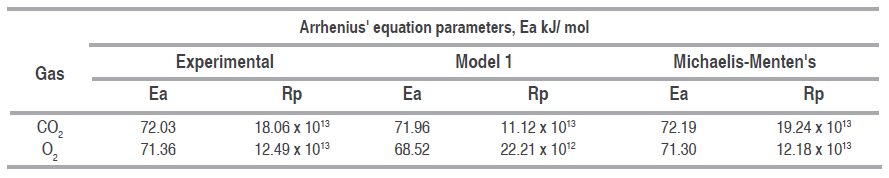
Table 5 shows Arrhenius type equation parameters, activation energy and pre-exponential factor for O. consumption and CO. production rates of the experimental data, proposed model 1 and Michaelis-Menten's equation. Activation energy values of each gas are very alike between experimental data and Michaelis-Menten's, evidencing a good adjustment of this equation to the sensitivity of the reaction to temperature; besides, activation energy values are between normal values, from 29 to 93 kJ mol-1 for fruit (Benítez et al., 2012). Certain effects could be observed in some cut mango pieces due to cold sensitive reactions generating a brown color, beginning around the vascular bundles, because of the polyphenol-oxidase action on the phenolics released out of the vacuole after freezing (Lee et al., 1996;Blanco-Díaz et al., 2016).
Activation energy and pre-exponential factor of Arrhenius type equation for the experimental data, Model 1 and Michaelis-Menten's equation.
The descending form of the gradient in figures 2 and 3 indicates an inverse relationship between respiration rate and shelf life, which is due to O. reduces and CO. increases in an airtight container, consequently with what is observed in figure 1. It is also known that respiration rate decreases with CO. rising and O. dropping due to the first is a product of the reaction and the second is a reactive in it, as can be seen in the general reaction for respiration (Devanesan et al., 2011):
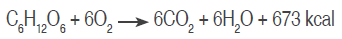
Consequently and accordingly to Le Chatelier's principle, when increasing the concentration of a product or reducing the concentration of a reactive, the chemical reaction rate reduces.
Noncompetitive inhibition Michaelis-Menten's kinetic equation presented better results in the prediction of the respiration rate in contrast with others two models.
Models 1 and 2 are useful to predict gas concentration but do not predict the respiration rates.
Temperature was an influencing factor in O2 consumption and CO2 production of the cut mango determining a better preservation at 4 °C.
The authors of the current work thank the Comité para el Desarrollo de la Investigación (CODI) in the Universidad de Antioquia, for the financial support through the Estrategia de Sostenibilidad 2014-2015. Also to the Fundación INTAL for lending its facilities.
Figure 1
Experimental data of CO2 consumption (A) and O2 production (B) at different temperatures: ● 4 °C ■ 20 °C y ▲ 35 °C and using the Model 1: ·· and Model 2: - - - to predict the gas concentration.
Values of adjusted coefficients to predict gas concentration.
Parameters for the expression of the respiration rate in the noncompetitive inhibition model of Michaelis-Menten, at different temperatures.
Figure 2
CO2 production rate (RCO2) for cut mango stored at 4 °C (A) 20 °C (B) and 30 °C (C); -●- Experimental consumption rate; ▲ consumption rate calculated with Model 1 (proposed); ♦ consumption rate calculated with Model 2; □ consumption rate predicted with Michaelis-Menten's equation.
Figure 3
O2 consumption rate (RO2) for cut mango stored at 4 °C (A). 20 °C (B) and 30 °C (C); -●- Experimental consumption rate; ▲ consumption rate calculated with Model 1 (proposed); ♦ consumption rate calculated with Model 2; □ consumption rate predicted with Michaelis-Menten's equation
Average respiration rate of the different models for the three temperatures.
Relative standard deviation for the models developed for the three storage temperatures.
Activation energy and pre-exponential factor of Arrhenius type equation for the experimental data, Model 1 and Michaelis-Menten's equation.
